Races in Weddington, North Carolina (NC) Detailed Stats
Ancestries, Foreign-born residents, place of birth
Settings
X


Recent posts about races in Weddington, North Carolina on our local forum with over 2,400,000 registered users:

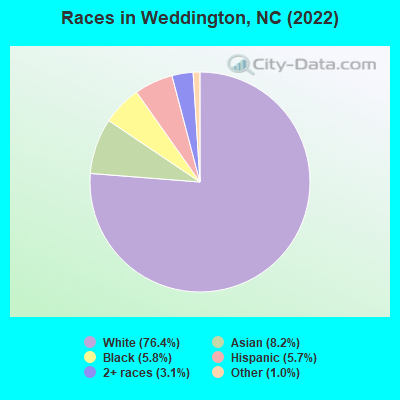
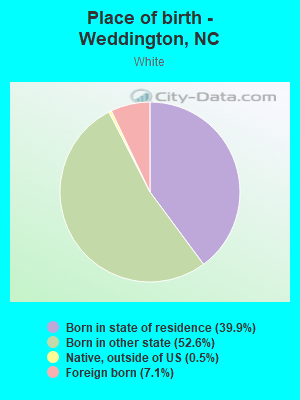
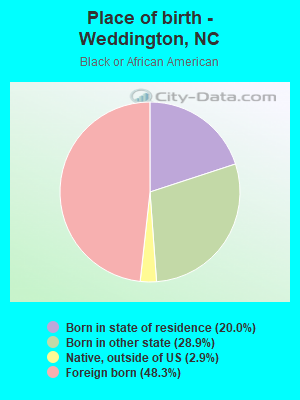
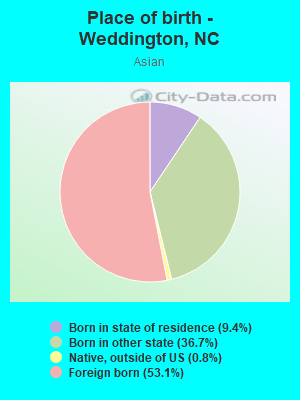
According to 2022 data, the most numerous races in Weddington, NC are White alone (10,441 residents), Black alone (788 residents), and Hispanic (779 residents). 83.8% of Weddington residents speak English at home. 14.9% of Weddington, NC residents are foreign-born (4.6% born in Europe, 3.6% born in Asia, 2.2% born in Latin America, 2.2% born in North America, 1.9% born in Africa), which is 46.2% greater than the foreign-born rate of 8.0% across the entire state of North Carolina.
Race distribution in Weddington
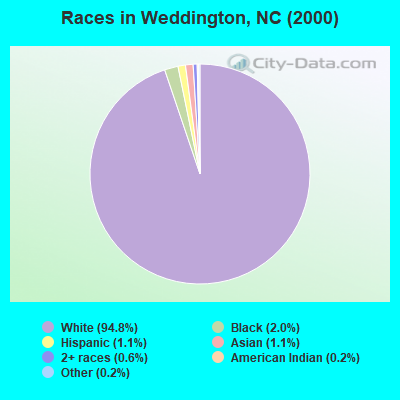
2000
2022

- 6,34994.8%White alone
- 1352.0%Black alone
- 711.1%Hispanic
- 711.1%Asian alone
- 430.6%Two or more races
- 160.2%American Indian alone
- 110.2%Other race alone
-
- 10,44176.4%White alone
- 1,1218.2%Asian alone
- 7885.8%Black alone
- 7795.7%Hispanic
- 4223.1%Two or more races
- 1381.0%Other race alone
- 10.01%Native Hawaiian and Other
Pacific Islander alone
2000
2022
-
- 5,647,15570.2%White alone
- 1,723,30121.4%Black alone
- 378,9634.7%Hispanic
- 112,4161.4%Asian alone
- 95,3331.2%American Indian alone
- 79,9651.0%Two or more races
- 9,0150.1%Other race alone
- 3,1650.04%Native Hawaiian and Other
Pacific Islander alone

-
- 6,497,51960.7%White alone
- 2,155,65020.1%Black alone
- 1,114,79910.4%Hispanic
- 438,0614.1%Two or more races
- 341,0523.2%Asian alone
- 91,7580.9%American Indian alone
- 50,1800.5%Other race alone
- 9,9540.09%Native Hawaiian and Other
Pacific Islander alone

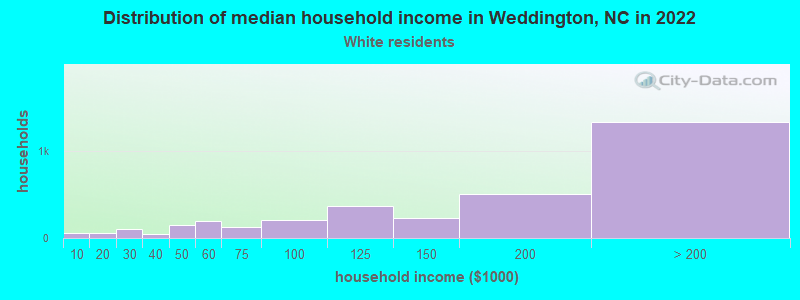
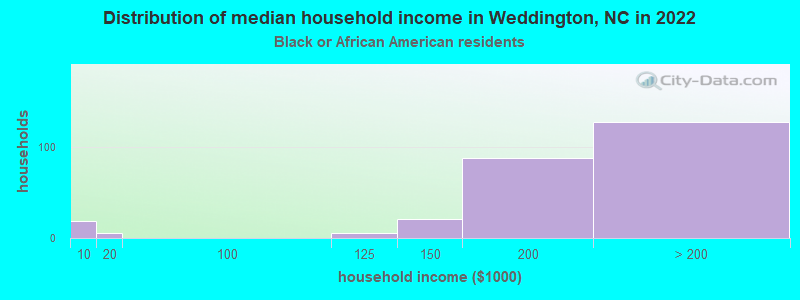
Income and house value in Weddington
- Median household income in 2022
- $155,547White non-Hispanic householders
- over $200,000Black householders
- over $200,000Asian householders
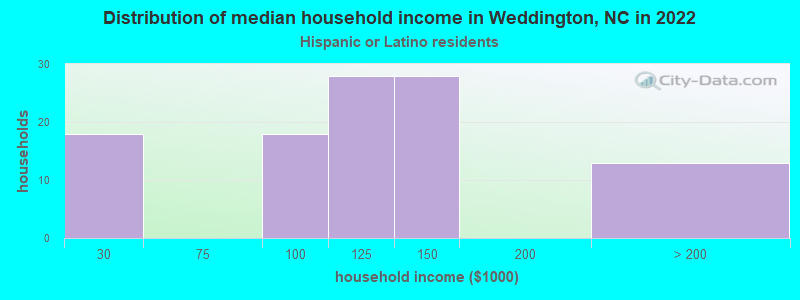
- $123,533Hispanic or Latino race householders
- Median 2022 house value
- $840,908White Non-Hispanic householders
- $681,817Black or African American householders
- $518,787American Indian or Alaska Native householders
- $492,423Asian householders
- $846,059Hispanic or Latino householders
Household income for White non-Hispanic householders
Household income for Black householders
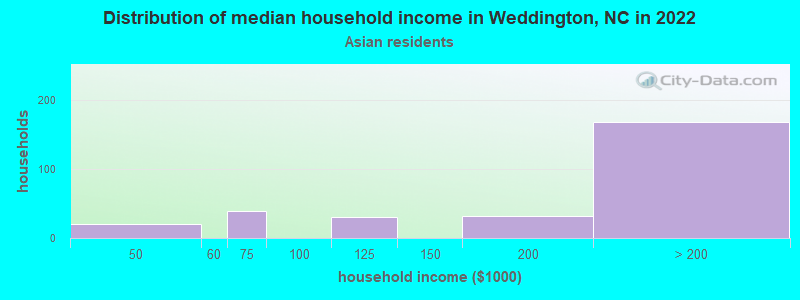
Household income for Asian householders
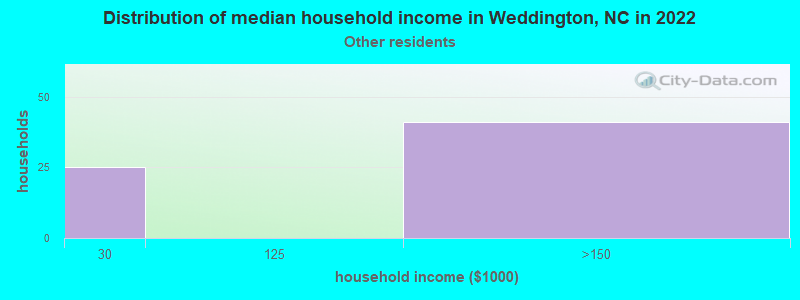
Household income for Some other race householders
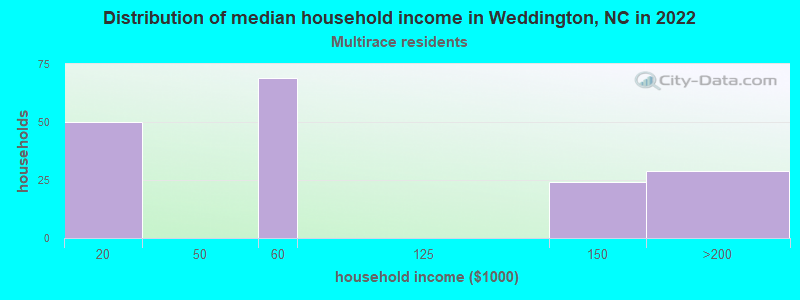
Household income for Two or more races householders
Household income for Hispanic or Latino race householders
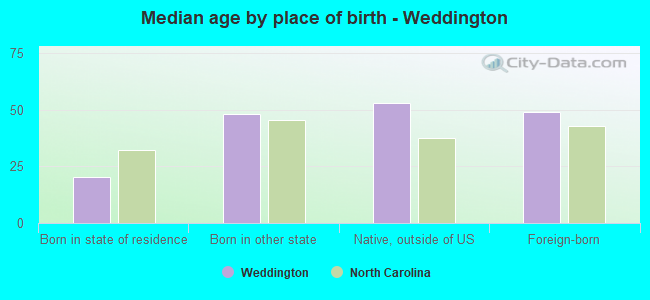
Median age by race in Weddington
- 46.8Median age for White residents
- 49.2Males
- 44.6Females
- 42.7Median age for Black or African American residents
- 39.1Males
- 49.7Females
- -708,962,738.5Median age for American Indian / Alaska Native residents
- -577,885,390.9Males
- -684,523,808.8Females
- 41.3Median age for Asian residents
- 46.1Males
- 39.2Females
- -560,606,060.0Median age for Native Hawaiian / Pacific Islander residents
- -666,666,666.0Males
- -559,017,940.9Females
- 42.3Median age for Other race residents
- 9.1Males
- -634,046,890.3Females
- 43.0Median age for Two or more races residents
- 19.5Males
- 55.0Females
- 46.8Median age for White alone residents
- 48.6Males
- 45.1Females
- 19.5Median age for Hispanic or Latino residents
- 32.2Males
- 14.2Females
Owner/renter occupied households by race in Weddington
- House owners and renters - White residents
- 3,26392.4%Owner occupied
- 2687.6%Renter occupied
- House owners and renters - Black or African American residents
- 24897.0%Owner occupied
- 83.0%Renter occupied
- House owners and renters - Asian residents
- 366100.0%Owner occupied
- House owners and renters - Other race residents
- 4256.4%Owner occupied
- 3243.6%Renter occupied
- House owners and renters - Two or more races residents
- 133100.0%Owner occupied
- House owners and renters - White alone residents
- 3,27391.6%Owner occupied
- 3008.4%Renter occupied
- House owners and renters - Hispanic or Latino residents
- 8282.2%Owner occupied
- 1817.8%Renter occupied
Language usage in Weddington
- English speakers - Total
- 83.8% of residents of Weddington speak English at home.
- 4.5% of residents speak Spanish at home
- 26043.5%Speak English very well
- 33856.5%Speak English less than very well
- 12.1% of residents speak other language at home
- 1,46291.7%Speak English very well
- 1338.3%Speak English less than very well
- English speakers - Born in the United States
- 95.2% of residents of Weddington speak English at home.
- 0.7% of residents speak Spanish at home
- 40100.0%Speak English very well
- 3.8% of residents speak other language at home
- 22093.6%Speak English very well
- 156.4%Speak English less than very well
- English speakers - Native, born elsewhere
- 76.3% of residents of Weddington speak English at home.
- 18.7% of residents speak other language at home
- 26100.0%Speak English very well
- English speakers - Foreign-born
- 47.2% of residents of Weddington speak English at home.
- 6.6% of residents speak Spanish at home
- 10163.9%Speak English very well
- 5736.1%Speak English less than very well
- 49.9% of residents speak other language at home
- 1,07690.0%Speak English very well
- 11910.0%Speak English less than very well
White (Caucasian) - Speak only English
| Native: | 96.4% (8,701) |
| Foreign-born: | 82.9% (606) |
White (Caucasian) - Speak another language
| Native: | 3.2% (289) |
| Foreign-born: | 33.5% (244) |
Black or African American - Speak only English
| Native: | 93.2% (550) |
| Foreign-born: | 44.4% (125) |
Black or African American - Speak another language
| Native: | 6.5% (38) |
| Foreign-born: | 55.6% (156) |
Asian - Speak only English
| Native: | 50.3% (261) |
| Foreign-born: | 4.2% (26) |
Asian - Speak another language
| Native: | 45.4% (235) |
| Foreign-born: | 100.0% (610) |
Two or more races - Speak only English
| Native: | 93.6% (473) |
| Foreign-born: | 93.0% (173) |
White alone - Speak only English
| Native: | 95.2% (8,649) |
| Foreign-born: | 59.4% (641) |
White alone - Speak another language
| Native: | 5.0% (457) |
| Foreign-born: | 35.4% (382) |
Hispanic or Latino - Speak only English
| Native: | 75.4% (356) |
| Foreign-born: | 10.0% (20) |
Hispanic or Latino - Speak another language
| Native: | 28.3% (134) |
| Foreign-born: | 90.6% (180) |
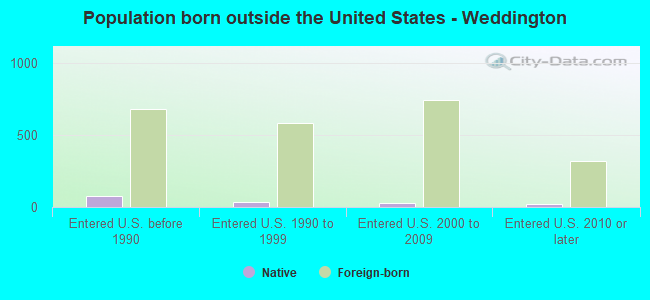
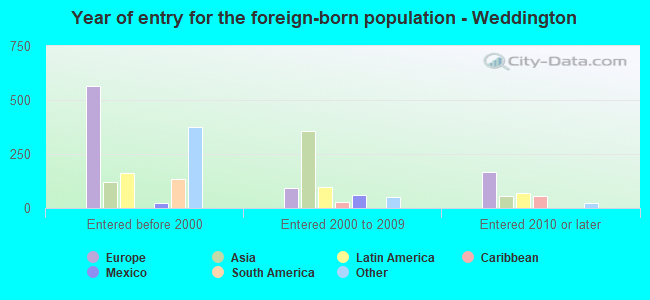
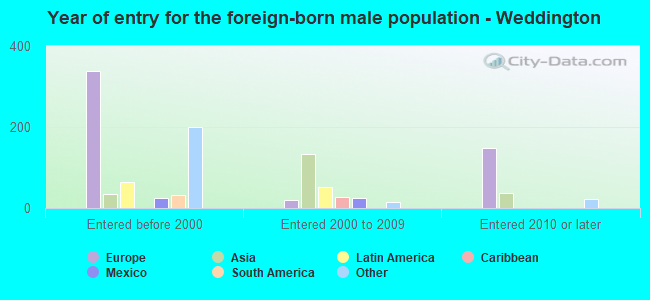
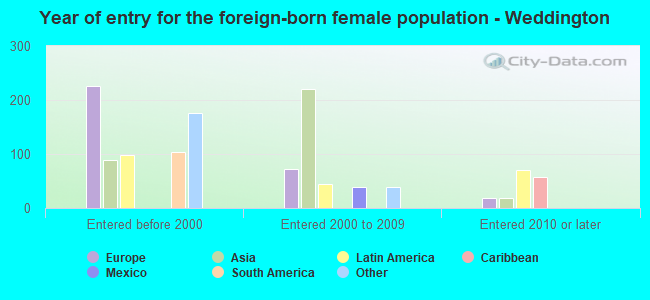
Foreign-born residents in Weddington
2,031 residents are foreign born (4.6% Europe, 3.6% Asia, 2.2% Latin America, 2.2% North America, 1.9% Africa).
| This city: | 14.9% |
| North Carolina: | 8.3% |

Marital status for residents in Weddington
Marital status - White (Caucasian) population 15 years and over
- Males
- 21.2%Never married
- 73.0%Now married
- 0.0%Separated
- 1.2%Widowed
- 4.6%Divorced
- Females
- 22.5%Never married
- 69.6%Now married
- 0.4%Separated
- 3.1%Widowed
- 4.5%Divorced
Women who gave birth in the past 12 months
| Now married: | 100.0% (87) |
| Unmarried: | 0.0% (0) |
Women who did not give birth in the past 12 months
| Now married: | 56.6% (1,128) |
| Unmarried: | 43.4% (866) |
Marital status - Black or African American population 15 years and over
- Males
- 17.9%Never married
- 82.1%Now married
- 0.0%Separated
- 0.0%Widowed
- 0.0%Divorced
- Females
- 30.0%Never married
- 65.6%Now married
- 0.0%Separated
- 1.8%Widowed
- 2.7%Divorced
Women who did not give birth in the past 12 months
| Now married: | 61.9% (146) |
| Unmarried: | 38.1% (90) |
Marital status - Asian population 15 years and over
- Males
- 14.8%Never married
- 85.2%Now married
- 0.0%Separated
- 0.0%Widowed
- 0.0%Divorced
- Females
- 5.8%Never married
- 64.2%Now married
- 10.9%Separated
- 15.0%Widowed
- 4.2%Divorced
Women who did not give birth in the past 12 months
| Now married: | 92.6% (235) |
| Unmarried: | 7.4% (19) |
Marital status - Other race population 15 years and over
- Males
- 0.0%Never married
- 100.0%Now married
- 0.0%Separated
- 0.0%Widowed
- 0.0%Divorced
- Females
- 0.0%Never married
- 100.0%Now married
- 0.0%Separated
- 0.0%Widowed
- 0.0%Divorced
Marital status - Two or more races population 15 years and over
- Males
- 39.4%Never married
- 42.0%Now married
- 0.0%Separated
- 0.0%Widowed
- 18.6%Divorced
- Females
- 0.0%Never married
- 77.3%Now married
- 0.0%Separated
- 3.5%Widowed
- 19.2%Divorced
Women who did not give birth in the past 12 months
| Now married: | 77.9% (159) |
| Unmarried: | 22.1% (45) |
Marital status - White alone, not Hispanic / Latino population 15 years and over
- Males
- 21.1%Never married
- 72.9%Now married
- 0.0%Separated
- 1.2%Widowed
- 4.7%Divorced
- Females
- 21.9%Never married
- 70.0%Now married
- 0.4%Separated
- 3.2%Widowed
- 4.6%Divorced
Women who gave birth in the past 12 months
| Now married: | 100.0% (93) |
| Unmarried: | 0.0% (0) |
Women who did not give birth in the past 12 months
| Now married: | 56.9% (1,166) |
| Unmarried: | 43.1% (883) |
Marital status - Hispanic or Latino population 15 years and over
- Males
- 35.2%Never married
- 64.8%Now married
- 0.0%Separated
- 0.0%Widowed
- 0.0%Divorced
- Females
- 27.1%Never married
- 72.9%Now married
- 0.0%Separated
- 0.0%Widowed
- 0.0%Divorced
Women who did not give birth in the past 12 months
| Now married: | 48.4% (49) |
| Unmarried: | 51.6% (53) |
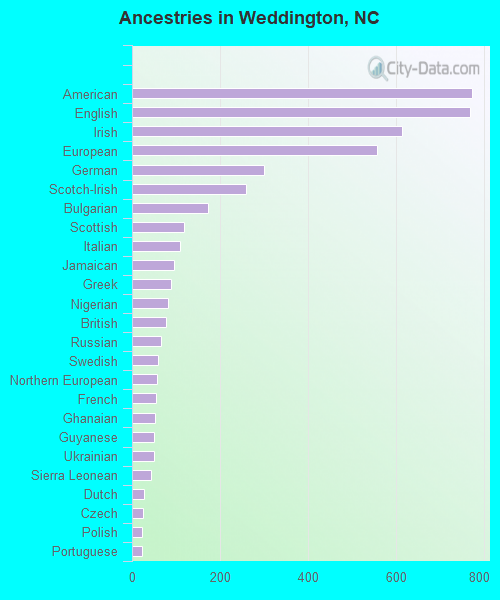
Ancestries in Weddington

- 77312.3%American
- 76812.2%English
- 6139.7%Irish
- 5578.8%European
- 2994.7%German
- 2594.1%Scotch-Irish
- 1732.7%Bulgarian
- 1181.9%Scottish
- 1081.7%Italian
- 961.5%Jamaican
- 881.4%Greek
- 811.3%Nigerian
- 771.2%British
- 671.1%Russian
- 601.0%Swedish
- 570.9%Northern European
- 540.9%French
- 530.8%Ghanaian
- 510.8%Guyanese
- 500.8%Ukrainian
- 440.7%Sierra Leonean
- 270.4%Dutch
- 250.4%Czech
- 230.4%Polish
- 220.3%Portuguese
- 190.3%Canadian
- 140.2%Norwegian
- 130.2%Swiss
- 120.2%Assyrian
- 120.2%Scandinavian
- 100.2%Welsh
- 80.1%Slovak
- 40.06%Hungarian
- 30.05%Danish
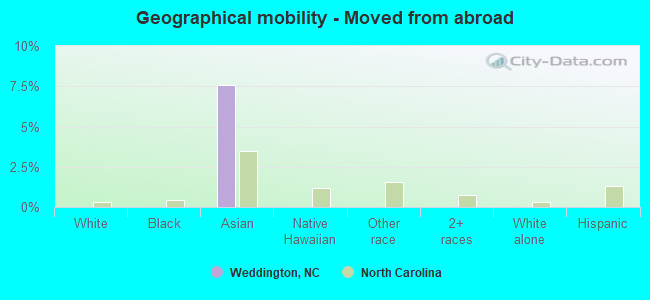
Geographical mobility in Weddington

- Same house 1 year ago
- 9,19090.0%White (Caucasian)
- 60074.9%Black or African American
- 77882.9%Asian
- 2100.0%Native Hawaiian / Pacific Islander
- 23666.9%Other race
- 73199.0%Two or more races
- 9,26489.1%White alone, not Hispanic / Latino
- 783100.0%Hispanic or Latino
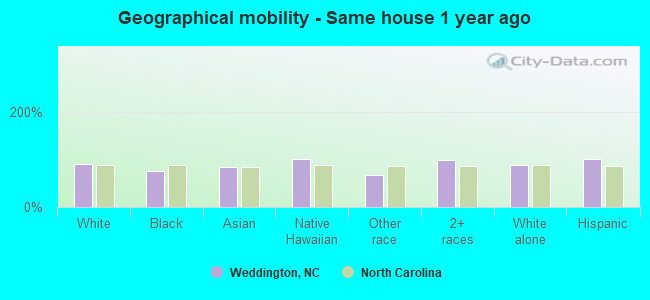
-
- Moved within same county
- 2912.8%White / Caucasian
- 161.7%Asian
- 3323.2%White alone, not Hispanic / Latino
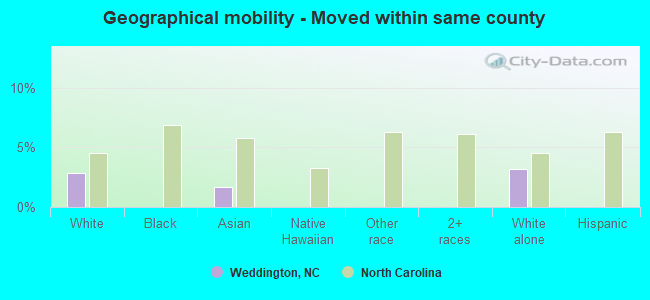
-
- Moved within same state
- 4664.6%White / Caucasian
- 14818.5%Black or African American
- 626.6%Asian
- 9226.1%Other race
- 5195.0%White alone, not Hispanic / Latino
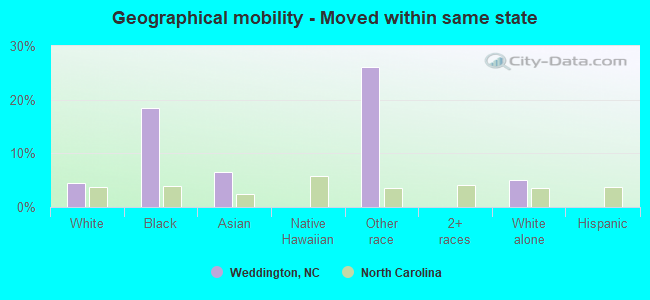
-
- Moved from different state
- 2412.4%White / Caucasian
- 8510.6%Black or African American
- 212.2%Asian
- 233.1%Two or more races
- 2502.4%White alone, not Hispanic / Latino

-
- Moved from abroad
- 717.6%Asian
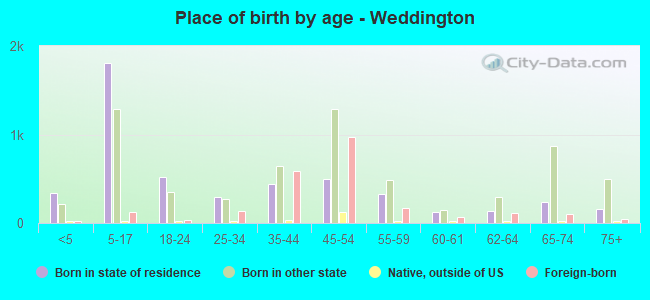
Children Nativity (place of birth) in Weddington
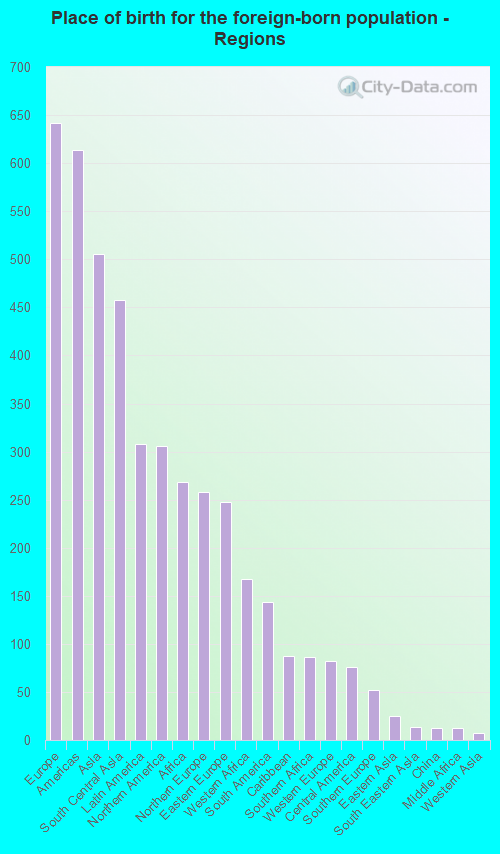
Place of birth for residents in Weddington
![Place of birth for the foreign-born population - Regions]()
- 642Europe
- 614Americas
- 505Asia
- 458South Central Asia
- 308Latin America
- 306Northern America
- 268Africa
- 258Northern Europe
- 248Eastern Europe
- 167Western Africa
- 144South America
- 87Caribbean
- 86Southern Africa
- 82Western Europe
- 76Central America
- 52Southern Europe
- 25Eastern Asia
- 14South Eastern Asia
- 13China
- 13Middle Africa
- 7Western Asia
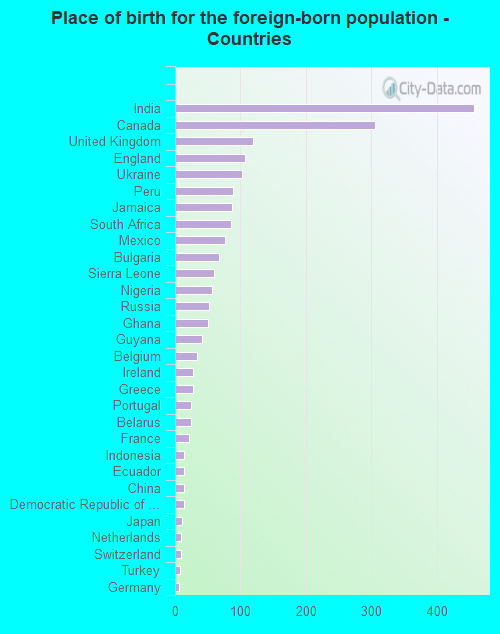
![Place of birth for the foreign-born population - Countries]()
- 457India
- 306Canada
- 119United Kingdom
- 107England
- 102Ukraine
- 88Peru
- 87Jamaica
- 86South Africa
- 76Mexico
- 67Bulgaria
- 60Sierra Leone
- 57Nigeria
- 52Russia
- 50Ghana
- 41Guyana
- 34Belgium
- 28Ireland
- 27Greece
- 25Portugal
- 25Belarus
- 22France
- 14Indonesia
- 14Ecuador
- 13China
- 13Democratic Republic of Congo (Zaire)
- 11Japan
- 9Netherlands
- 9Switzerland
- 7Turkey
- 6Germany
- 3Denmark
- 1Nepal
Grandparents responsible for own grandchildren in Weddington
Zip codes: 28104.