Races in Weatherford, Oklahoma (OK) Detailed Stats
Ancestries, Foreign-born residents, place of birth
Settings
X


Recent posts about races in Weatherford, Oklahoma on our local forum with over 2,400,000 registered users:
 | Where do we live?? Moving from WA (16 replies) |
| OK Route 66 in a 56-Year Old 356: what are your Route 66 “must see” spots in Oklahoma? (19 replies) |
| Oklahoma Weather Thread (860 replies) |
| Weatherford OK (7 replies) |
| Foreclosures, Pre-foreclosures in Oklahoma (Sheriff's sales and Sheriff auctions) (33 replies) |
| Job in Clinton???????? HELP!!!!!! (10 replies) |
Latest news about races in Weatherford, OK collected exclusively by city-data.com from local newspapers, TV, and radio stations
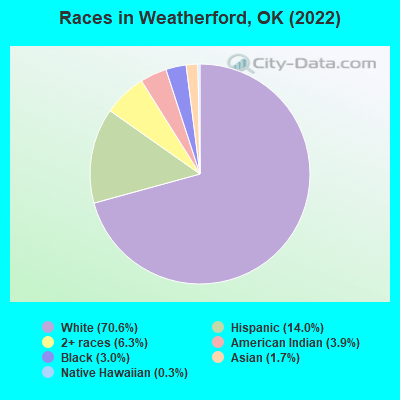
According to 2022 data, the most numerous races in Weatherford, OK are White alone (8,572 residents), Hispanic (1,705 residents), and Two or more races (765 residents). 92.1% of Weatherford residents speak English at home. 3.0% of Weatherford, OK residents are foreign-born (1.9% born in Latin America, 1.0% born in Asia), which is 102.5% less than the foreign-born rate of 6.0% across the entire state of Oklahoma.
Race distribution in Weatherford
2000
2022

- 8,41585.4%White alone
- 4624.7%American Indian alone
- 4244.3%Hispanic
- 2322.4%Two or more races
- 1891.9%Black alone
- 1241.3%Asian alone
- 70.07%Other race alone
- 60.06%Native Hawaiian and Other
Pacific Islander alone

-
- 8,57270.6%White alone
- 1,70514.0%Hispanic
- 7656.3%Two or more races
- 4753.9%American Indian alone
- 3703.0%Black alone
- 2021.7%Asian alone
- 380.3%Native Hawaiian and Other
Pacific Islander alone
2000
2022
-
- 2,556,36874.1%White alone
- 266,1587.7%American Indian alone
- 257,9817.5%Black alone
- 179,3045.2%Hispanic
- 140,2494.1%Two or more races
- 46,1721.3%Asian alone
- 2,3220.07%Other race alone
- 2,1000.06%Native Hawaiian and Other
Pacific Islander alone

-
- 2,517,40362.6%White alone
- 486,69212.1%Hispanic
- 364,4539.1%Two or more races
- 273,6506.8%American Indian alone
- 268,5436.7%Black alone
- 92,6722.3%Asian alone
- 10,7860.3%Other race alone
- 5,6010.1%Native Hawaiian and Other
Pacific Islander alone

Income and house value in Weatherford
- Median household income in 2022
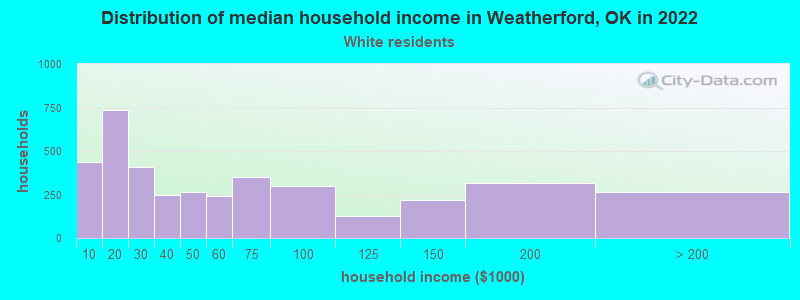
- $44,785White non-Hispanic householders
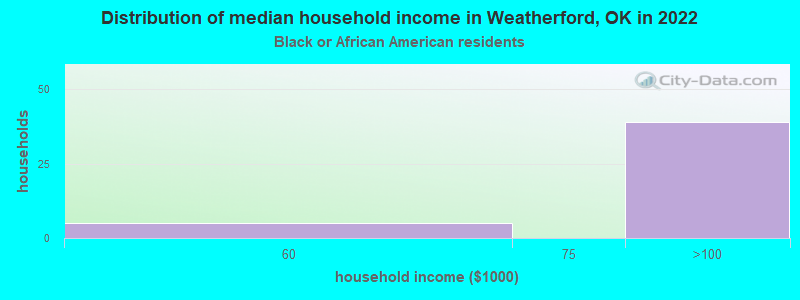
- $74,959Black householders
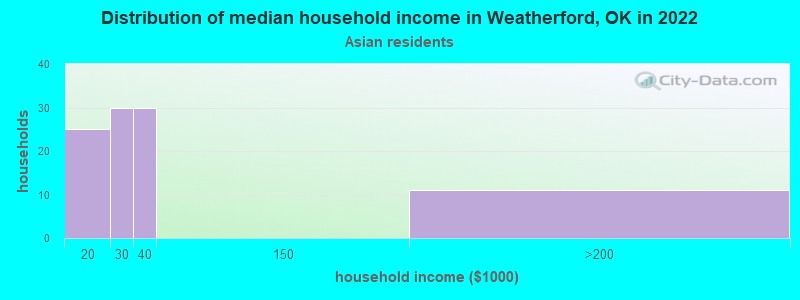
- $23,852Asian householders
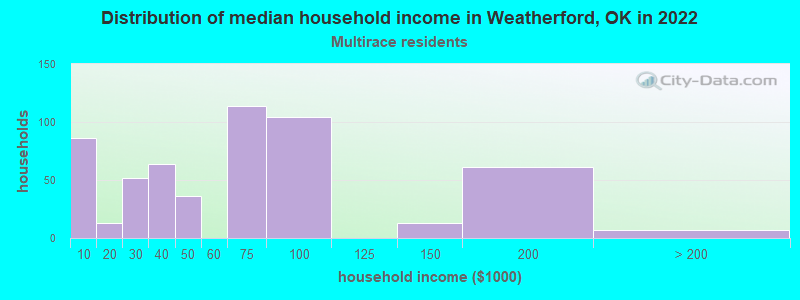
- $70,495Two or more races householders
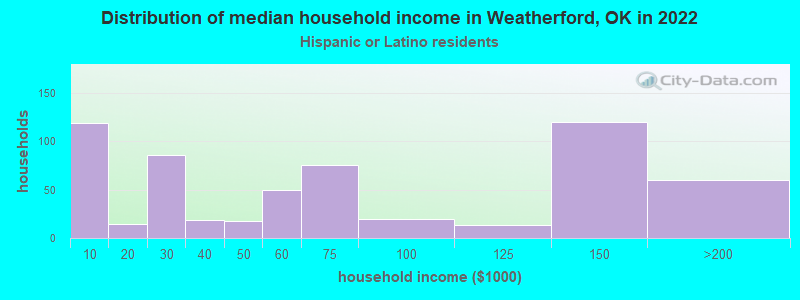
- $53,202Hispanic or Latino race householders
- Median 2022 house value
- $255,761White Non-Hispanic householders
- $53,538Black or African American householders
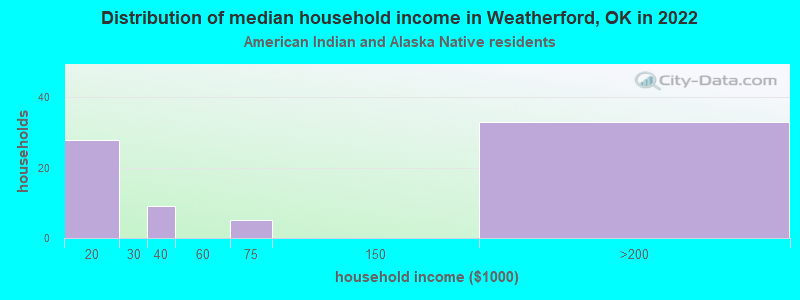
- $244,748American Indian or Alaska Native householders
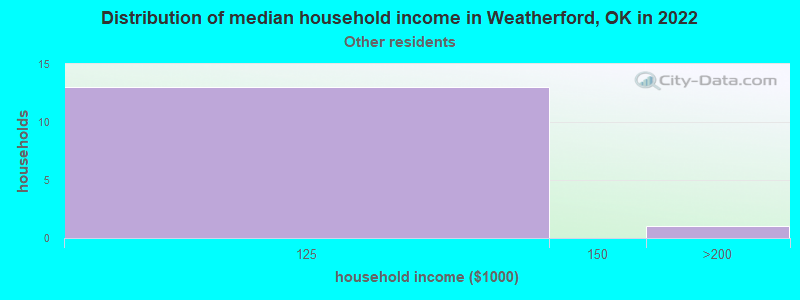
- $190,291Some other race householders
- $199,775Two or more races householders
- $200,693Hispanic or Latino householders
Household income for White non-Hispanic householders
Household income for Black householders
Household income for American Indian and Alaska Native householders
Household income for Asian householders
Household income for Some other race householders
Household income for Two or more races householders
Household income for Hispanic or Latino race householders
Median age by race in Weatherford
- 26.4Median age for White residents
- 25.7Males
- 26.7Females
- 13.6Median age for Black or African American residents
- 39.1Males
- 12.8Females
- 21.7Median age for American Indian / Alaska Native residents
- 33.9Males
- 20.1Females
- 21.9Median age for Asian residents
- 22.6Males
- 20.7Females
- -725,225,224.5Median age for Native Hawaiian / Pacific Islander residents
- -675,324,674.6Males
- -767,251,461.2Females
- 19.8Median age for Other race residents
- 24.6Males
- -690,821,255.3Females
- 22.4Median age for Two or more races residents
- 21.5Males
- 23.6Females
- 26.7Median age for White alone residents
- 25.4Males
- 28.5Females
- 21.2Median age for Hispanic or Latino residents
- 22.1Males
- 20.3Females
Owner/renter occupied households by race in Weatherford
- House owners and renters - White residents
- 1,95950.8%Owner occupied
- 1,89749.2%Renter occupied
- House owners and renters - Black or African American residents
- 611.8%Owner occupied
- 4288.2%Renter occupied
- House owners and renters - American Indian / Alaska Native residents
- 3545.7%Owner occupied
- 4254.3%Renter occupied
- House owners and renters - Asian residents
- 4946.2%Owner occupied
- 5753.8%Renter occupied
- House owners and renters - Other race residents
- 17.7%Owner occupied
- 1492.3%Renter occupied
- House owners and renters - Two or more races residents
- 20035.0%Owner occupied
- 37165.0%Renter occupied
- House owners and renters - White alone residents
- 1,88751.3%Owner occupied
- 1,78948.7%Renter occupied
- House owners and renters - Hispanic or Latino residents
- 17128.6%Owner occupied
- 42771.4%Renter occupied
Language usage in Weatherford
- English speakers - Total
- 92.1% of residents of Weatherford speak English at home.
- 6.5% of residents speak Spanish at home
- 61583.4%Speak English very well
- 12216.6%Speak English less than very well
- 1.4% of residents speak other language at home
- 12077.9%Speak English very well
- 3422.1%Speak English less than very well
- English speakers - Born in the United States
- 92.1% of residents of Weatherford speak English at home.
- 7.4% of residents speak Spanish at home
- 13962.3%Speak English very well
- 8437.7%Speak English less than very well
- 0.9% of residents speak other language at home
- 28100.0%Speak English very well
- English speakers - Native, born elsewhere
- 94.1% of residents of Weatherford speak English at home.
- 5.9% of residents speak Spanish at home
- 1100.0%Speak English very well
- English speakers - Foreign-born
- 18.9% of residents of Weatherford speak English at home.
- 55.4% of residents speak Spanish at home
- 15175.9%Speak English very well
- 4824.1%Speak English less than very well
- 24.2% of residents speak other language at home
- 5259.8%Speak English very well
- 3540.2%Speak English less than very well
White (Caucasian) - Speak only English
| Native: | 97.8% (8,368) |
| Foreign-born: | 4.4% (5) |
White (Caucasian) - Speak another language
| Native: | 2.3% (195) |
| Foreign-born: | 81.3% (100) |
Black or African American - Speak only English
| Native: | 97.8% (281) |
| Foreign-born: | 89.3% (19) |
Asian - Speak only English
| Native: | 56.4% (73) |
| Foreign-born: | 35.1% (38) |
Asian - Speak another language
| Native: | 43.6% (57) |
| Foreign-born: | 63.7% (68) |
Two or more races - Speak another language
| Native: | 25.2% (359) |
| Foreign-born: | 100.0% (2) |
White alone - Speak only English
| Native: | 99.5% (8,144) |
| Foreign-born: | 23.9% (6) |
White alone - Speak another language
| Native: | 0.6% (46) |
| Foreign-born: | 74.5% (18) |
Hispanic or Latino - Speak another language
| Native: | 40.0% (492) |
| Foreign-born: | 99.4% (206) |
Foreign-born residents in Weatherford
360 residents are foreign born (1.9% Latin America, 1.0% Asia).
| This city: | 3.0% |
| Oklahoma: | 6.1% |


Marital status for residents in Weatherford
Marital status - White (Caucasian) population 15 years and over
- Males
- 51.3%Never married
- 37.1%Now married
- 2.3%Separated
- 3.1%Widowed
- 6.2%Divorced
- Females
- 44.9%Never married
- 32.3%Now married
- 1.1%Separated
- 7.0%Widowed
- 14.6%Divorced
Women who gave birth in the past 12 months
| Now married: | 32.0% (30) |
| Unmarried: | 68.0% (64) |
Women who did not give birth in the past 12 months
| Now married: | 27.9% (780) |
| Unmarried: | 72.1% (2,018) |
Marital status - Black or African American population 15 years and over
- Males
- 38.3%Never married
- 53.2%Now married
- 0.0%Separated
- 0.0%Widowed
- 8.5%Divorced
- Females
- 67.1%Never married
- 32.9%Now married
- 0.0%Separated
- 0.0%Widowed
- 0.0%Divorced
Women who did not give birth in the past 12 months
| Now married: | 35.7% (23) |
| Unmarried: | 64.3% (42) |
Marital status - American Indian / Alaska Native population 15 years and over
- Males
- 36.6%Never married
- 61.0%Now married
- 0.0%Separated
- 0.0%Widowed
- 2.3%Divorced
- Females
- 56.2%Never married
- 43.8%Now married
- 0.0%Separated
- 0.0%Widowed
- 0.0%Divorced
Women who did not give birth in the past 12 months
| Now married: | 25.5% (43) |
| Unmarried: | 74.5% (125) |
Marital status - Asian population 15 years and over
- Males
- 59.1%Never married
- 0.0%Now married
- 0.0%Separated
- 0.0%Widowed
- 40.9%Divorced
- Females
- 58.5%Never married
- 15.4%Now married
- 0.0%Separated
- 8.5%Widowed
- 17.7%Divorced
Women who did not give birth in the past 12 months
| Now married: | 0.0% (0) |
| Unmarried: | 100.0% (110) |
Marital status - Other race population 15 years and over
- Males
- 97.1%Never married
- 2.9%Now married
- 0.0%Separated
- 0.0%Widowed
- 0.0%Divorced
- Females
- 100.0%Never married
- 0.0%Now married
- 0.0%Separated
- 0.0%Widowed
- 0.0%Divorced
Women who did not give birth in the past 12 months
| Now married: | 0.0% (0) |
| Unmarried: | 100.0% (66) |
Marital status - Two or more races population 15 years and over
- Males
- 88.3%Never married
- 10.0%Now married
- 0.5%Separated
- 1.2%Widowed
- 0.0%Divorced
- Females
- 44.8%Never married
- 47.6%Now married
- 2.1%Separated
- 0.0%Widowed
- 5.5%Divorced
Women who did not give birth in the past 12 months
| Now married: | 45.4% (210) |
| Unmarried: | 54.6% (252) |
Marital status - White alone, not Hispanic / Latino population 15 years and over
- Males
- 52.7%Never married
- 35.0%Now married
- 2.4%Separated
- 3.3%Widowed
- 6.6%Divorced
- Females
- 43.9%Never married
- 33.7%Now married
- 0.7%Separated
- 7.7%Widowed
- 14.0%Divorced
Women who gave birth in the past 12 months
| Now married: | 32.0% (31) |
| Unmarried: | 68.0% (66) |
Women who did not give birth in the past 12 months
| Now married: | 29.3% (750) |
| Unmarried: | 70.7% (1,807) |
Marital status - Hispanic or Latino population 15 years and over
- Males
- 68.6%Never married
- 31.4%Now married
- 0.0%Separated
- 0.0%Widowed
- 0.0%Divorced
- Females
- 61.7%Never married
- 22.4%Now married
- 3.4%Separated
- 0.0%Widowed
- 12.4%Divorced
Women who did not give birth in the past 12 months
| Now married: | 22.6% (145) |
| Unmarried: | 77.4% (497) |
Ancestries in Weatherford

- 69412.7%German
- 58010.6%American
- 55810.2%English
- 3796.9%Irish
- 2494.5%European
- 1362.5%Scottish
- 1041.9%Scotch-Irish
- 400.7%Czech
- 190.3%British
- 190.3%Polish
- 160.3%Italian
- 130.2%Trinidadian and Tobagonian
- 90.2%Swedish
- 80.1%Hungarian
- 80.1%Israeli
- 80.1%Norwegian
- 80.1%Scandinavian
- 70.1%French
- 60.1%Moroccan
- 60.1%Swiss

Geographical mobility in Weatherford

- Same house 1 year ago
- 6,27868.8%White (Caucasian)
- 36799.6%Black or African American
- 33969.8%American Indian / Alaska Native
- 15265.9%Asian
- 51100.0%Native Hawaiian / Pacific Islander
- 3129.1%Other race
- 1,05863.6%Two or more races
- 6,03870.7%White alone, not Hispanic / Latino
- 81547.9%Hispanic or Latino

-
- Moved within same county
- 1,27514.0%White / Caucasian
- 367.4%American Indian / Alaska Native
- 218.9%Asian
- 6056.2%Other race
- 36722.1%Two or more races
- 1,06912.5%White alone, not Hispanic / Latino
- 58334.3%Hispanic or Latino

-
- Moved within same state
- 1,16812.8%White / Caucasian
- 51.3%Black or African American
- 10521.7%American Indian / Alaska Native
- 4318.4%Asian
- 87.4%Other race
- 1086.5%Two or more races
- 1,06212.4%White alone, not Hispanic / Latino
- 1649.6%Hispanic or Latino

-
- Moved from different state
- 2242.5%White / Caucasian
- 82.1%Black or African American
- 855.1%Two or more races
- 2352.7%White alone, not Hispanic / Latino
- 684.0%Hispanic or Latino

-
- Moved from abroad
- 300.3%White
- 370.4%White alone, not Hispanic / Latino

Children Nativity (place of birth) in Weatherford
Place of birth for residents in Weatherford
![Place of birth for the foreign-born population - Regions]()
- 223Americas
- 223Latin America
- 198Central America
- 116Asia
- 78South Eastern Asia
- 37Eastern Asia
- 31China
- 24Caribbean
- 10Europe
- 10Western Europe
- 5Africa
- 5Northern Africa
- 2Oceania
- 2Australia and New Zealand Subregion

![Place of birth for the foreign-born population - Countries]()
- 197Mexico
- 35Vietnam
- 24Trinidad and Tobago
- 22Thailand
- 20China
- 19Philippines
- 10Switzerland
- 10Taiwan
- 5Japan
- 5Morocco
- 2Australia

Grandparents responsible for own grandchildren in Weatherford
Zip codes: 73096.