Races in Waxhaw, North Carolina (NC) Detailed Stats
Data:
Races - White alone (%)
Races - White alone (% change since 2000)
Races - Black alone (%)
Races - Black alone (% change since 2000)
Races - American Indian alone (%)
Races - American Indian alone (% change since 2000)
Races - Asian alone (%)
Races - Asian alone (% change since 2000)
Races - Hispanic (%)
Races - Hispanic (% change since 2000)
Races - Native Hawaiian and Other Pacific Islander alone (%)
Races - Native Hawaiian and Other Pacific Islander alone (% change since 2000)
Races - Two or more races(%)
Races - Two or more races(% change since 2000)
Races - Other race alone (%)
Races - Other race alone (% change since 2000)
Racial diversity
Place of birth - Born in state of residence (%)
Place of birth - Born in state of residence (%) - White
Place of birth - Born in state of residence (%) - Black or African American
Place of birth - Born in state of residence (%) - Asian
Place of birth - Born in state of residence (%) - Hispanic or Latino
Place of birth - Born in state of residence (%) - American Indian and Alaska Native
Place of birth - Born in state of residence (%) - Multirace
Place of birth - Born in state of residence (%) - Other Race
Place of birth - Born in other state (%)
Place of birth - Born in other state (%) - White
Place of birth - Born in other state (%) - Black or African American
Place of birth - Born in other state (%) - Asian
Place of birth - Born in other state (%) - Hispanic or Latino
Place of birth - Born in other state (%) - American Indian and Alaska Native
Place of birth - Born in other state (%) - Multirace
Place of birth - Born in other state (%) - Other Race
Place of birth - Native, outside of US (%)
Place of birth - Native, outside of US (%) - White
Place of birth - Native, outside of US (%) - Black or African American
Place of birth - Native, outside of US (%) - Asian
Place of birth - Native, outside of US (%) - Hispanic or Latino
Place of birth - Native, outside of US (%) - American Indian and Alaska Native
Place of birth - Native, outside of US (%) - Multirace
Place of birth - Native, outside of US (%) - Other Race
Place of birth - Foreign born (%)
Place of birth - Foreign born (%) - White
Place of birth - Foreign born (%) - Black or African American
Place of birth - Foreign born (%) - Asian
Place of birth - Foreign born (%) - Hispanic or Latino
Place of birth - Foreign born (%) - American Indian and Alaska Native
Place of birth - Foreign born (%) - Multirace
Place of birth - Foreign born (%) - Other Race
Residents speaking English at home (%)
Residents speaking English at home - Born in the United States (%)
Residents speaking English at home - Native, born elsewhere (%)
Residents speaking English at home - Foreign born (%)
Residents speaking Spanish at home (%)
Residents speaking Spanish at home - Born in the United States (%)
Residents speaking Spanish at home - Native, born elsewhere (%)
Residents speaking Spanish at home - Foreign born (%)
Residents speaking other language at home (%)
Residents speaking other language at home - Born in the United States (%)
Residents speaking other language at home - Native, born elsewhere (%)
Residents speaking other language at home - Foreign born (%)
Marital status - Never married (%)
Marital status - Now married (%)
Marital status - Separated (%)
Marital status - Widowed (%)
Marital status - Divorced (%)
Ancestries Reported - Arab (%)
Ancestries Reported - Czech (%)
Ancestries Reported - Danish (%)
Ancestries Reported - Dutch (%)
Ancestries Reported - English (%)
Ancestries Reported - French (%)
Ancestries Reported - French Canadian (%)
Ancestries Reported - German (%)
Ancestries Reported - Greek (%)
Ancestries Reported - Hungarian (%)
Ancestries Reported - Irish (%)
Ancestries Reported - Italian (%)
Ancestries Reported - Lithuanian (%)
Ancestries Reported - Norwegian (%)
Ancestries Reported - Polish (%)
Ancestries Reported - Portuguese (%)
Ancestries Reported - Russian (%)
Ancestries Reported - Scotch-Irish (%)
Ancestries Reported - Scottish (%)
Ancestries Reported - Slovak (%)
Ancestries Reported - Subsaharan African (%)
Ancestries Reported - Swedish (%)
Ancestries Reported - Swiss (%)
Ancestries Reported - Ukrainian (%)
Ancestries Reported - United States (%)
Ancestries Reported - Welsh (%)
Ancestries Reported - West Indian (%)
Ancestries Reported - Other (%)
Geographical mobility - Same house 1 year ago (%)
Geographical mobility - Same house 1 year ago (%) - White
Geographical mobility - Same house 1 year ago (%) - Black or African American
Geographical mobility - Same house 1 year ago (%) - Asian
Geographical mobility - Same house 1 year ago (%) - Hispanic or Latino
Geographical mobility - Same house 1 year ago (%) - American Indian and Alaska Native
Geographical mobility - Same house 1 year ago (%) - Multirace
Geographical mobility - Same house 1 year ago (%) - Other Race
Geographical mobility - Moved within same county (%)
Geographical mobility - Moved within same county (%) - White
Geographical mobility - Moved within same county (%) - Black or African American
Geographical mobility - Moved within same county (%) - Asian
Geographical mobility - Moved within same county (%) - Hispanic or Latino
Geographical mobility - Moved within same county (%) - American Indian and Alaska Native
Geographical mobility - Moved within same county (%) - Multirace
Geographical mobility - Moved within same county (%) - Other Race
Geographical mobility - Moved from different county within same state (%)
Geographical mobility - Moved from different county within same state (%) - White
Geographical mobility - Moved from different county within same state (%) - Black or African American
Geographical mobility - Moved from different county within same state (%) - Asian
Geographical mobility - Moved from different county within same state (%) - Hispanic or Latino
Geographical mobility - Moved from different county within same state (%) - American Indian and Alaska Native
Geographical mobility - Moved from different county within same state (%) - Multirace
Geographical mobility - Moved from different county within same state (%) - Other Race
Geographical mobility - Moved from different state (%)
Geographical mobility - Moved from different state (%) - White
Geographical mobility - Moved from different state (%) - Black or African American
Geographical mobility - Moved from different state (%) - Asian
Geographical mobility - Moved from different state (%) - Hispanic or Latino
Geographical mobility - Moved from different state (%) - American Indian and Alaska Native
Geographical mobility - Moved from different state (%) - Multirace
Geographical mobility - Moved from different state (%) - Other Race
Geographical mobility - Moved from abroad (%)
Geographical mobility - Moved from abroad (%) - White
Geographical mobility - Moved from abroad (%) - Black or African American
Geographical mobility - Moved from abroad (%) - Asian
Geographical mobility - Moved from abroad (%) - Hispanic or Latino
Geographical mobility - Moved from abroad (%) - American Indian and Alaska Native
Geographical mobility - Moved from abroad (%) - Multirace
Geographical mobility - Moved from abroad (%) - Other Race
Place of birth for the foreign-born population - Ireland (%)
Place of birth for the foreign-born population - Denmark (%)
Place of birth for the foreign-born population - Norway (%)
Place of birth for the foreign-born population - Sweden (%)
Place of birth for the foreign-born population - United Kingdom (%)
Place of birth for the foreign-born population - England (%)
Place of birth for the foreign-born population - Scotland (%)
Place of birth for the foreign-born population - Other Northern Europe (%)
Place of birth for the foreign-born population - Austria (%)
Place of birth for the foreign-born population - Belgium (%)
Place of birth for the foreign-born population - France (%)
Place of birth for the foreign-born population - Germany (%)
Place of birth for the foreign-born population - Netherlands (%)
Place of birth for the foreign-born population - Switzerland (%)
Place of birth for the foreign-born population - Other Western Europe (%)
Place of birth for the foreign-born population - Greece (%)
Place of birth for the foreign-born population - Italy (%)
Place of birth for the foreign-born population - Portugal (%)
Place of birth for the foreign-born population - Spain (%)
Place of birth for the foreign-born population - Other Southern Europe (%)
Place of birth for the foreign-born population - Albania (%)
Place of birth for the foreign-born population - Belarus (%)
Place of birth for the foreign-born population - Bosnia and Herzegovina (%)
Place of birth for the foreign-born population - Bulgaria (%)
Place of birth for the foreign-born population - Croatia (%)
Place of birth for the foreign-born population - Czechoslovakia (%)
Place of birth for the foreign-born population - Hungary (%)
Place of birth for the foreign-born population - Latvia (%)
Place of birth for the foreign-born population - Lithuania (%)
Place of birth for the foreign-born population - North Macedonia (Macedonia) (%)
Place of birth for the foreign-born population - Moldova (%)
Place of birth for the foreign-born population - Poland (%)
Place of birth for the foreign-born population - Romania (%)
Place of birth for the foreign-born population - Russia (%)
Place of birth for the foreign-born population - Serbia (%)
Place of birth for the foreign-born population - Ukraine (%)
Place of birth for the foreign-born population - Other Eastern Europe (%)
Place of birth for the foreign-born population - China (%)
Place of birth for the foreign-born population - Hong Kong (%)
Place of birth for the foreign-born population - Taiwan (%)
Place of birth for the foreign-born population - Japan (%)
Place of birth for the foreign-born population - Korea (%)
Place of birth for the foreign-born population - Other Eastern Asia (%)
Place of birth for the foreign-born population - Afghanistan (%)
Place of birth for the foreign-born population - Bangladesh (%)
Place of birth for the foreign-born population - India (%)
Place of birth for the foreign-born population - Iran (%)
Place of birth for the foreign-born population - Kazakhstan (%)
Place of birth for the foreign-born population - Nepal (%)
Place of birth for the foreign-born population - Pakistan (%)
Place of birth for the foreign-born population - Sri Lanka (%)
Place of birth for the foreign-born population - Uzbekistan (%)
Place of birth for the foreign-born population - Other South Central Asia (%)
Place of birth for the foreign-born population - Burma (%)
Place of birth for the foreign-born population - Cambodia (%)
Place of birth for the foreign-born population - Indonesia (%)
Place of birth for the foreign-born population - Laos (%)
Place of birth for the foreign-born population - Malaysia (%)
Place of birth for the foreign-born population - Philippines (%)
Place of birth for the foreign-born population - Singapore (%)
Place of birth for the foreign-born population - Thailand (%)
Place of birth for the foreign-born population - Vietnam (%)
Place of birth for the foreign-born population - Other South Eastern Asia (%)
Place of birth for the foreign-born population - Armenia (%)
Place of birth for the foreign-born population - Iraq (%)
Place of birth for the foreign-born population - Israel (%)
Place of birth for the foreign-born population - Jordan (%)
Place of birth for the foreign-born population - Kuwait (%)
Place of birth for the foreign-born population - Lebanon (%)
Place of birth for the foreign-born population - Saudi Arabia (%)
Place of birth for the foreign-born population - Syria (%)
Place of birth for the foreign-born population - Turkey (%)
Place of birth for the foreign-born population - Yemen (%)
Place of birth for the foreign-born population - Other Western Asia (%)
Place of birth for the foreign-born population - Eritrea (%)
Place of birth for the foreign-born population - Ethiopia (%)
Place of birth for the foreign-born population - Kenya (%)
Place of birth for the foreign-born population - Somalia (%)
Place of birth for the foreign-born population - Uganda (%)
Place of birth for the foreign-born population - Zimbabwe (%)
Place of birth for the foreign-born population - Other Eastern Africa (%)
Place of birth for the foreign-born population - Cameroon (%)
Place of birth for the foreign-born population - Congo (%)
Place of birth for the foreign-born population - Democratic Republic of Congo (Zaire) (%)
Place of birth for the foreign-born population - Other Middle Africa (%)
Place of birth for the foreign-born population - Egypt (%)
Place of birth for the foreign-born population - Morocco (%)
Place of birth for the foreign-born population - Sudan (%)
Place of birth for the foreign-born population - Other Northern Africa (%)
Place of birth for the foreign-born population - South Africa (%)
Place of birth for the foreign-born population - Other Southern Africa (%)
Place of birth for the foreign-born population - Cabo Verde (%)
Place of birth for the foreign-born population - Ghana (%)
Place of birth for the foreign-born population - Liberia (%)
Place of birth for the foreign-born population - Nigeria (%)
Place of birth for the foreign-born population - Senegal (%)
Place of birth for the foreign-born population - Sierra Leone (%)
Place of birth for the foreign-born population - Other Western Africa (%)
Place of birth for the foreign-born population - Australia (%)
Place of birth for the foreign-born population - New Zealand (%)
Place of birth for the foreign-born population - Fiji (%)
Place of birth for the foreign-born population - Micronesia (%)
Place of birth for the foreign-born population - Bahamas (%)
Place of birth for the foreign-born population - Barbados (%)
Place of birth for the foreign-born population - Cuba (%)
Place of birth for the foreign-born population - Dominica (%)
Place of birth for the foreign-born population - Dominican Republic (%)
Place of birth for the foreign-born population - Grenada (%)
Place of birth for the foreign-born population - Haiti (%)
Place of birth for the foreign-born population - Jamaica (%)
Place of birth for the foreign-born population - St. Vincent and the Grenadines (%)
Place of birth for the foreign-born population - Trinidad and Tobago (%)
Place of birth for the foreign-born population - West Indies (%)
Place of birth for the foreign-born population - Other Caribbean (%)
Place of birth for the foreign-born population - Belize (%)
Place of birth for the foreign-born population - Costa Rica (%)
Place of birth for the foreign-born population - El Salvador (%)
Place of birth for the foreign-born population - Guatemala (%)
Place of birth for the foreign-born population - Honduras (%)
Place of birth for the foreign-born population - Mexico (%)
Place of birth for the foreign-born population - Nicaragua (%)
Place of birth for the foreign-born population - Panama (%)
Place of birth for the foreign-born population - Other Central America (%)
Place of birth for the foreign-born population - Argentina (%)
Place of birth for the foreign-born population - Bolivia (%)
Place of birth for the foreign-born population - Brazil (%)
Place of birth for the foreign-born population - Chile (%)
Place of birth for the foreign-born population - Colombia (%)
Place of birth for the foreign-born population - Ecuador (%)
Place of birth for the foreign-born population - Guyana (%)
Place of birth for the foreign-born population - Peru (%)
Place of birth for the foreign-born population - Uruguay (%)
Place of birth for the foreign-born population - Venezuela (%)
Place of birth for the foreign-born population - Other South America (%)
Place of birth for the foreign-born population - Canada (%)
Place of birth for the foreign-born population - Other Northern America (%)
Place of birth for the foreign-born population - Other (%)
Latest news about races in Waxhaw, NC collected exclusively by city-data.com from local newspapers, TV, and radio stations
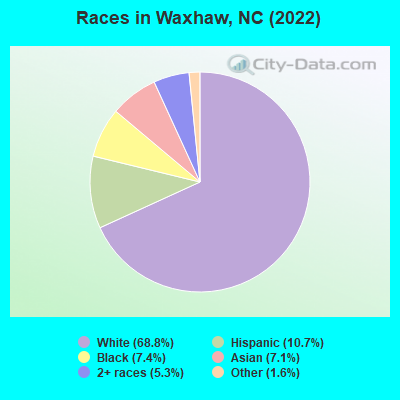
According to 2022 data, the most numerous races in Waxhaw, NC are White alone (14,751 residents), Black alone (1,592 residents), and Hispanic (2,287 residents). 81.5% of Waxhaw residents speak English at home. 13.7% of Waxhaw, NC residents are foreign-born (4.9% born in Latin America, 4.7% born in Asia, 2.7% born in Europe), which is 41.5% greater than the foreign-born rate of 8.0% across the entire state of North Carolina.
Race distribution in Waxhaw
2000 2022
5,647,155 70.2% White alone 1,723,301 21.4% Black alone 378,963 4.7% Hispanic 112,416 1.4% Asian alone 95,333 1.2% American Indian alone 79,965 1.0% Two or more races 9,015 0.1% Other race alone 3,165 0.04% Native Hawaiian and Other
6,497,519 60.7% White alone 2,155,650 20.1% Black alone 1,114,799 10.4% Hispanic 438,061 4.1% Two or more races 341,052 3.2% Asian alone 91,758 0.9% American Indian alone 50,180 0.5% Other race alone 9,954 0.09% Native Hawaiian and Other
Income and house value in Waxhaw Median household income in 2022 $127,652 White non-Hispanic householders$118,291 Black householdersover $200,000 Asian householders$87,814 Some other race householders$84,936 Two or more races householders$94,655 Hispanic or Latino race householdersMedian 2022 house value $579,801 White Non-Hispanic householders$326,774 Black or African American householders$560,243 Two or more races householders$322,700 Hispanic or Latino householders
Median age by race in Waxhaw
40.1 Median age for White residents38.8 40.5 34.0 Median age for Black or African American residents17.8 46.7 -708,962,738.5 Median age for American Indian / Alaska Native residents-577,885,390.9 -684,523,808.8 37.6 Median age for Asian residents39.4 36.3 -560,606,060.0 Median age for Native Hawaiian / Pacific Islander residents-666,666,666.0 -559,017,940.9 36.0 Median age for Other race residents33.7 40.3 23.0 Median age for Two or more races residents25.6 22.3 40.3 Median age for White alone residents39.8 40.1 21.1 Median age for Hispanic or Latino residents21.8 21.8
Owner/renter occupied households by race in Waxhaw
House owners and renters - White residents 4,138 84.4% Owner occupied763 15.6% Renter occupiedHouse owners and renters - Black or African American residents 409 74.6% Owner occupied139 25.4% Renter occupiedHouse owners and renters - Asian residents 442 98.4% Owner occupied7 1.6% Renter occupiedHouse owners and renters - Other race residents 72 16.8% Owner occupied357 83.2% Renter occupiedHouse owners and renters - Two or more races residents 246 76.9% Owner occupied74 23.1% Renter occupiedHouse owners and renters - White alone residents 4,112 83.6% Owner occupied807 16.4% Renter occupiedHouse owners and renters - Hispanic or Latino residents 288 66.9% Owner occupied143 33.1% Renter occupied
Language usage in Waxhaw
English speakers - Total 81.5% of residents of Waxhaw speak English at home.
5.7% of residents speak Spanish at home 904 79.0% Speak English very well241 21.0% Speak English less than very well13.5% of residents speak other language at home 2,189 80.1% Speak English very well543 19.9% Speak English less than very well
English speakers - Born in the United States 92.7% of residents of Waxhaw speak English at home.
3.1% of residents speak Spanish at home 250 66.5% Speak English very well126 33.5% Speak English less than very well4.6% of residents speak other language at home 534 95.7% Speak English very well24 4.3% Speak English less than very well
English speakers - Native, born elsewhere 65.6% of residents of Waxhaw speak English at home.
30.1% of residents speak Spanish at home 83 100.0% Speak English very well12.3% of residents speak other language at home 34 100.0% Speak English very well
English speakers - Foreign-born 35.6% of residents of Waxhaw speak English at home.
12.2% of residents speak Spanish at home 331 78.6% Speak English very well90 21.4% Speak English less than very well53.7% of residents speak other language at home 1,352 72.7% Speak English very well507 27.3% Speak English less than very well
White (Caucasian) - Speak only English Native:
95.8% (12,397)Foreign-born:
33.4% (292)
White (Caucasian) - Speak another language Native:
3.5% (459)Foreign-born:
67.8% (592)
Black or African American - Speak only English Native:
94.8% (1,327)Foreign-born:
97.4% (344)
Black or African American - Speak another language Native:
5.0% (70)Foreign-born:
3.7% (13)
Asian - Speak only English Native:
53.8% (203)Foreign-born:
14.4% (155)
Asian - Speak another language Native:
40.5% (153)Foreign-born:
75.8% (815)
Other race - Speak only English Native:
61.6% (389)Foreign-born:
9.2% (50)
Other race - Speak another language Native:
45.6% (288)Foreign-born:
90.6% (490)
Two or more races - Speak only English Native:
81.9% (1,507)Foreign-born:
26.5% (59)
Two or more races - Speak another language Native:
16.2% (298)Foreign-born:
72.3% (160)
White alone - Speak only English Native:
96.1% (12,375)Foreign-born:
26.6% (316)
White alone - Speak another language Native:
4.1% (526)Foreign-born:
74.0% (879)
Hispanic or Latino - Speak only English Native:
54.9% (810)Foreign-born:
13.9% (78)
Hispanic or Latino - Speak another language Native:
46.7% (688)Foreign-born:
87.4% (490)
Foreign-born residents in Waxhaw 2,931 residents are foreign born (4.9% Latin America , 4.7% Asia , 2.7% Europe ).
This city:
13.7%North Carolina:
8.3%
Marital status for residents in Waxhaw Marital status - White (Caucasian) population 15 years and over
Males 26.6% Never married62.7% Now married0.9% Separated1.0% Widowed8.8% DivorcedFemales 19.9% Never married65.8% Now married2.5% Separated4.7% Widowed7.1% DivorcedWomen who gave birth in the past 12 months Now married:
100.0% (214)Unmarried:
0.0% (0)
Women who did not give birth in the past 12 months Now married:
63.7% (2,074)Unmarried:
36.3% (1,180)
Marital status - Black or African American population 15 years and over
Males 48.4% Never married44.4% Now married3.6% Separated0.0% Widowed3.6% DivorcedFemales 36.8% Never married24.9% Now married5.2% Separated17.8% Widowed15.2% DivorcedWomen who gave birth in the past 12 months Now married:
100.0% (22)Unmarried:
0.0% (0)
Women who did not give birth in the past 12 months Now married:
21.5% (122)Unmarried:
78.5% (443)
Marital status - Asian population 15 years and over
Males 26.2% Never married73.8% Now married0.0% Separated0.0% Widowed0.0% DivorcedFemales 11.4% Never married76.7% Now married0.0% Separated8.5% Widowed3.4% DivorcedWomen who gave birth in the past 12 months Now married:
100.0% (10)Unmarried:
0.0% (0)
Women who did not give birth in the past 12 months Now married:
78.9% (239)Unmarried:
21.1% (64)
Marital status - Other race population 15 years and over
Males 42.1% Never married48.5% Now married0.0% Separated0.0% Widowed9.5% DivorcedFemales 25.1% Never married37.7% Now married0.0% Separated0.0% Widowed37.1% DivorcedWomen who did not give birth in the past 12 months Now married:
38.8% (64)Unmarried:
61.2% (101)
Marital status - Two or more races population 15 years and over
Males 49.4% Never married50.6% Now married0.0% Separated0.0% Widowed0.0% DivorcedFemales 51.6% Never married31.5% Now married0.0% Separated7.3% Widowed9.6% DivorcedWomen who did not give birth in the past 12 months Now married:
33.1% (238)Unmarried:
66.9% (480)
Marital status - White alone, not Hispanic / Latino population 15 years and over
Males 27.1% Never married62.7% Now married0.8% Separated1.0% Widowed8.4% DivorcedFemales 19.0% Never married66.4% Now married2.6% Separated4.9% Widowed7.2% DivorcedWomen who gave birth in the past 12 months Now married:
100.0% (219)Unmarried:
0.0% (0)
Women who did not give birth in the past 12 months Now married:
64.6% (2,149)Unmarried:
35.4% (1,180)
Marital status - Hispanic or Latino population 15 years and over
Males 38.5% Never married49.6% Now married1.1% Separated0.0% Widowed10.8% DivorcedFemales 43.2% Never married46.5% Now married0.0% Separated0.0% Widowed10.2% DivorcedWomen who gave birth in the past 12 months Now married:
100.0% (40)Unmarried:
0.0% (0)
Women who did not give birth in the past 12 months Now married:
43.2% (291)Unmarried:
56.8% (383)
Ancestries in Waxhaw
1,216 13.6% Italian998 11.2% English612 6.9% American510 5.7% Irish478 5.4% Ukrainian452 5.1% Brazilian420 4.7% German180 2.0% Scottish168 1.9% European162 1.8% Haitian134 1.5% Russian128 1.4% Liberian119 1.3% Polish81 0.9% Greek62 0.7% French60 0.7% Jamaican57 0.6% Scotch-Irish47 0.5% African40 0.4% Eastern European38 0.4% Norwegian37 0.4% British29 0.3% Turkish27 0.3% Dutch27 0.3% Portuguese23 0.3% South African21 0.2% Scandinavian18 0.2% Lebanese11 0.1% Canadian10 0.1% Hungarian9 0.1% Swedish6 0.07% Ugandan3 0.03% Lithuanian
Geographical mobility in Waxhaw Same house 1 year ago 12,943 89.3% White (Caucasian)1,158 67.7% Black or African American13 100.0% American Indian / Alaska Native1,141 89.5% Asian780 66.7% Other race2,209 93.4% Two or more races12,953 88.6% White alone, not Hispanic / Latino1,950 87.4% Hispanic or LatinoMoved within same county 230 1.6% White / Caucasian11 0.6% Black or African American44 3.5% Asian145 12.4% Other race52 2.2% Two or more races208 1.4% White alone, not Hispanic / Latino83 3.7% Hispanic or LatinoMoved within same state 640 4.4% White / Caucasian435 25.5% Black or African American60 4.7% Asian25 2.2% Other race11 0.5% Two or more races713 4.9% White alone, not Hispanic / Latino27 1.2% Hispanic or LatinoMoved from different state 688 4.7% White / Caucasian172 10.1% Black or African American27 2.1% Asian241 20.6% Other race101 4.3% Two or more races715 4.9% White alone, not Hispanic / Latino179 8.0% Hispanic or LatinoMoved from abroad 44 0.3% White20 0.8% Two or more races72 0.5% White alone, not Hispanic / Latino
Children Nativity (place of birth) in Waxhaw
Children under 6 years - Living with two parents Both parents native 1,086 100.0% NativeBoth parents foreign-born 147 100.0% NativeOne native, one foreign-born parent 254 100.0% NativeChildren under 6 years - Living with one parent Native parent 28 100.0% NativeForeign-born parent 9 100.0% NativeChildren 6 to 17 years - Living with two parents Both parents native 3,276 97.7% Native76 2.3% Foreign-bornBoth parents foreign-born 807 90.7% Native82 9.3% Foreign-bornOne native, one foreign-born parent 503 100.0% NativeChildren 6 to 17 years - Living with one parent Native parent 649 100.0% NativeForeign-born parent 227 59.2% Native156 40.8% Foreign-born
Grandparents responsible for own grandchildren in Waxhaw
Grandparents (30 to 59 years) White / Caucasian 12 24.9% Responsible for grandchildren35 75.1% Not responsible for grandchildrenTwo or more races 1 8.8% Responsible for grandchildren15 91.2% Not responsible for grandchildrenWhite alone, not Hispanic / Latino 12 24.2% Responsible for grandchildren39 75.8% Not responsible for grandchildrenHispanic or Latino 13 100.0% Not responsible for grandchildren
Grandparents (60 years and over) White / Caucasian 119 100.0% Not responsible for grandchildrenWhite alone, not Hispanic / Latino 55 100.0% Not responsible for grandchildrenHispanic or Latino 11 100.0% Not responsible for grandchildren