Races in Waterbury, Connecticut (CT) Detailed Stats
Data:
Races - White alone (%)
Races - White alone (% change since 2000)
Races - Black alone (%)
Races - Black alone (% change since 2000)
Races - American Indian alone (%)
Races - American Indian alone (% change since 2000)
Races - Asian alone (%)
Races - Asian alone (% change since 2000)
Races - Hispanic (%)
Races - Hispanic (% change since 2000)
Races - Native Hawaiian and Other Pacific Islander alone (%)
Races - Native Hawaiian and Other Pacific Islander alone (% change since 2000)
Races - Two or more races(%)
Races - Two or more races(% change since 2000)
Races - Other race alone (%)
Races - Other race alone (% change since 2000)
Racial diversity
Place of birth - Born in state of residence (%)
Place of birth - Born in state of residence (%) - White
Place of birth - Born in state of residence (%) - Black or African American
Place of birth - Born in state of residence (%) - Asian
Place of birth - Born in state of residence (%) - Hispanic or Latino
Place of birth - Born in state of residence (%) - American Indian and Alaska Native
Place of birth - Born in state of residence (%) - Multirace
Place of birth - Born in state of residence (%) - Other Race
Place of birth - Born in other state (%)
Place of birth - Born in other state (%) - White
Place of birth - Born in other state (%) - Black or African American
Place of birth - Born in other state (%) - Asian
Place of birth - Born in other state (%) - Hispanic or Latino
Place of birth - Born in other state (%) - American Indian and Alaska Native
Place of birth - Born in other state (%) - Multirace
Place of birth - Born in other state (%) - Other Race
Place of birth - Native, outside of US (%)
Place of birth - Native, outside of US (%) - White
Place of birth - Native, outside of US (%) - Black or African American
Place of birth - Native, outside of US (%) - Asian
Place of birth - Native, outside of US (%) - Hispanic or Latino
Place of birth - Native, outside of US (%) - American Indian and Alaska Native
Place of birth - Native, outside of US (%) - Multirace
Place of birth - Native, outside of US (%) - Other Race
Place of birth - Foreign born (%)
Place of birth - Foreign born (%) - White
Place of birth - Foreign born (%) - Black or African American
Place of birth - Foreign born (%) - Asian
Place of birth - Foreign born (%) - Hispanic or Latino
Place of birth - Foreign born (%) - American Indian and Alaska Native
Place of birth - Foreign born (%) - Multirace
Place of birth - Foreign born (%) - Other Race
Residents speaking English at home (%)
Residents speaking English at home - Born in the United States (%)
Residents speaking English at home - Native, born elsewhere (%)
Residents speaking English at home - Foreign born (%)
Residents speaking Spanish at home (%)
Residents speaking Spanish at home - Born in the United States (%)
Residents speaking Spanish at home - Native, born elsewhere (%)
Residents speaking Spanish at home - Foreign born (%)
Residents speaking other language at home (%)
Residents speaking other language at home - Born in the United States (%)
Residents speaking other language at home - Native, born elsewhere (%)
Residents speaking other language at home - Foreign born (%)
Marital status - Never married (%)
Marital status - Now married (%)
Marital status - Separated (%)
Marital status - Widowed (%)
Marital status - Divorced (%)
Ancestries Reported - Arab (%)
Ancestries Reported - Czech (%)
Ancestries Reported - Danish (%)
Ancestries Reported - Dutch (%)
Ancestries Reported - English (%)
Ancestries Reported - French (%)
Ancestries Reported - French Canadian (%)
Ancestries Reported - German (%)
Ancestries Reported - Greek (%)
Ancestries Reported - Hungarian (%)
Ancestries Reported - Irish (%)
Ancestries Reported - Italian (%)
Ancestries Reported - Lithuanian (%)
Ancestries Reported - Norwegian (%)
Ancestries Reported - Polish (%)
Ancestries Reported - Portuguese (%)
Ancestries Reported - Russian (%)
Ancestries Reported - Scotch-Irish (%)
Ancestries Reported - Scottish (%)
Ancestries Reported - Slovak (%)
Ancestries Reported - Subsaharan African (%)
Ancestries Reported - Swedish (%)
Ancestries Reported - Swiss (%)
Ancestries Reported - Ukrainian (%)
Ancestries Reported - United States (%)
Ancestries Reported - Welsh (%)
Ancestries Reported - West Indian (%)
Ancestries Reported - Other (%)
Geographical mobility - Same house 1 year ago (%)
Geographical mobility - Same house 1 year ago (%) - White
Geographical mobility - Same house 1 year ago (%) - Black or African American
Geographical mobility - Same house 1 year ago (%) - Asian
Geographical mobility - Same house 1 year ago (%) - Hispanic or Latino
Geographical mobility - Same house 1 year ago (%) - American Indian and Alaska Native
Geographical mobility - Same house 1 year ago (%) - Multirace
Geographical mobility - Same house 1 year ago (%) - Other Race
Geographical mobility - Moved within same county (%)
Geographical mobility - Moved within same county (%) - White
Geographical mobility - Moved within same county (%) - Black or African American
Geographical mobility - Moved within same county (%) - Asian
Geographical mobility - Moved within same county (%) - Hispanic or Latino
Geographical mobility - Moved within same county (%) - American Indian and Alaska Native
Geographical mobility - Moved within same county (%) - Multirace
Geographical mobility - Moved within same county (%) - Other Race
Geographical mobility - Moved from different county within same state (%)
Geographical mobility - Moved from different county within same state (%) - White
Geographical mobility - Moved from different county within same state (%) - Black or African American
Geographical mobility - Moved from different county within same state (%) - Asian
Geographical mobility - Moved from different county within same state (%) - Hispanic or Latino
Geographical mobility - Moved from different county within same state (%) - American Indian and Alaska Native
Geographical mobility - Moved from different county within same state (%) - Multirace
Geographical mobility - Moved from different county within same state (%) - Other Race
Geographical mobility - Moved from different state (%)
Geographical mobility - Moved from different state (%) - White
Geographical mobility - Moved from different state (%) - Black or African American
Geographical mobility - Moved from different state (%) - Asian
Geographical mobility - Moved from different state (%) - Hispanic or Latino
Geographical mobility - Moved from different state (%) - American Indian and Alaska Native
Geographical mobility - Moved from different state (%) - Multirace
Geographical mobility - Moved from different state (%) - Other Race
Geographical mobility - Moved from abroad (%)
Geographical mobility - Moved from abroad (%) - White
Geographical mobility - Moved from abroad (%) - Black or African American
Geographical mobility - Moved from abroad (%) - Asian
Geographical mobility - Moved from abroad (%) - Hispanic or Latino
Geographical mobility - Moved from abroad (%) - American Indian and Alaska Native
Geographical mobility - Moved from abroad (%) - Multirace
Geographical mobility - Moved from abroad (%) - Other Race
Place of birth for the foreign-born population - Ireland (%)
Place of birth for the foreign-born population - Denmark (%)
Place of birth for the foreign-born population - Norway (%)
Place of birth for the foreign-born population - Sweden (%)
Place of birth for the foreign-born population - United Kingdom (%)
Place of birth for the foreign-born population - England (%)
Place of birth for the foreign-born population - Scotland (%)
Place of birth for the foreign-born population - Other Northern Europe (%)
Place of birth for the foreign-born population - Austria (%)
Place of birth for the foreign-born population - Belgium (%)
Place of birth for the foreign-born population - France (%)
Place of birth for the foreign-born population - Germany (%)
Place of birth for the foreign-born population - Netherlands (%)
Place of birth for the foreign-born population - Switzerland (%)
Place of birth for the foreign-born population - Other Western Europe (%)
Place of birth for the foreign-born population - Greece (%)
Place of birth for the foreign-born population - Italy (%)
Place of birth for the foreign-born population - Portugal (%)
Place of birth for the foreign-born population - Spain (%)
Place of birth for the foreign-born population - Other Southern Europe (%)
Place of birth for the foreign-born population - Albania (%)
Place of birth for the foreign-born population - Belarus (%)
Place of birth for the foreign-born population - Bosnia and Herzegovina (%)
Place of birth for the foreign-born population - Bulgaria (%)
Place of birth for the foreign-born population - Croatia (%)
Place of birth for the foreign-born population - Czechoslovakia (%)
Place of birth for the foreign-born population - Hungary (%)
Place of birth for the foreign-born population - Latvia (%)
Place of birth for the foreign-born population - Lithuania (%)
Place of birth for the foreign-born population - North Macedonia (Macedonia) (%)
Place of birth for the foreign-born population - Moldova (%)
Place of birth for the foreign-born population - Poland (%)
Place of birth for the foreign-born population - Romania (%)
Place of birth for the foreign-born population - Russia (%)
Place of birth for the foreign-born population - Serbia (%)
Place of birth for the foreign-born population - Ukraine (%)
Place of birth for the foreign-born population - Other Eastern Europe (%)
Place of birth for the foreign-born population - China (%)
Place of birth for the foreign-born population - Hong Kong (%)
Place of birth for the foreign-born population - Taiwan (%)
Place of birth for the foreign-born population - Japan (%)
Place of birth for the foreign-born population - Korea (%)
Place of birth for the foreign-born population - Other Eastern Asia (%)
Place of birth for the foreign-born population - Afghanistan (%)
Place of birth for the foreign-born population - Bangladesh (%)
Place of birth for the foreign-born population - India (%)
Place of birth for the foreign-born population - Iran (%)
Place of birth for the foreign-born population - Kazakhstan (%)
Place of birth for the foreign-born population - Nepal (%)
Place of birth for the foreign-born population - Pakistan (%)
Place of birth for the foreign-born population - Sri Lanka (%)
Place of birth for the foreign-born population - Uzbekistan (%)
Place of birth for the foreign-born population - Other South Central Asia (%)
Place of birth for the foreign-born population - Burma (%)
Place of birth for the foreign-born population - Cambodia (%)
Place of birth for the foreign-born population - Indonesia (%)
Place of birth for the foreign-born population - Laos (%)
Place of birth for the foreign-born population - Malaysia (%)
Place of birth for the foreign-born population - Philippines (%)
Place of birth for the foreign-born population - Singapore (%)
Place of birth for the foreign-born population - Thailand (%)
Place of birth for the foreign-born population - Vietnam (%)
Place of birth for the foreign-born population - Other South Eastern Asia (%)
Place of birth for the foreign-born population - Armenia (%)
Place of birth for the foreign-born population - Iraq (%)
Place of birth for the foreign-born population - Israel (%)
Place of birth for the foreign-born population - Jordan (%)
Place of birth for the foreign-born population - Kuwait (%)
Place of birth for the foreign-born population - Lebanon (%)
Place of birth for the foreign-born population - Saudi Arabia (%)
Place of birth for the foreign-born population - Syria (%)
Place of birth for the foreign-born population - Turkey (%)
Place of birth for the foreign-born population - Yemen (%)
Place of birth for the foreign-born population - Other Western Asia (%)
Place of birth for the foreign-born population - Eritrea (%)
Place of birth for the foreign-born population - Ethiopia (%)
Place of birth for the foreign-born population - Kenya (%)
Place of birth for the foreign-born population - Somalia (%)
Place of birth for the foreign-born population - Uganda (%)
Place of birth for the foreign-born population - Zimbabwe (%)
Place of birth for the foreign-born population - Other Eastern Africa (%)
Place of birth for the foreign-born population - Cameroon (%)
Place of birth for the foreign-born population - Congo (%)
Place of birth for the foreign-born population - Democratic Republic of Congo (Zaire) (%)
Place of birth for the foreign-born population - Other Middle Africa (%)
Place of birth for the foreign-born population - Egypt (%)
Place of birth for the foreign-born population - Morocco (%)
Place of birth for the foreign-born population - Sudan (%)
Place of birth for the foreign-born population - Other Northern Africa (%)
Place of birth for the foreign-born population - South Africa (%)
Place of birth for the foreign-born population - Other Southern Africa (%)
Place of birth for the foreign-born population - Cabo Verde (%)
Place of birth for the foreign-born population - Ghana (%)
Place of birth for the foreign-born population - Liberia (%)
Place of birth for the foreign-born population - Nigeria (%)
Place of birth for the foreign-born population - Senegal (%)
Place of birth for the foreign-born population - Sierra Leone (%)
Place of birth for the foreign-born population - Other Western Africa (%)
Place of birth for the foreign-born population - Australia (%)
Place of birth for the foreign-born population - New Zealand (%)
Place of birth for the foreign-born population - Fiji (%)
Place of birth for the foreign-born population - Micronesia (%)
Place of birth for the foreign-born population - Bahamas (%)
Place of birth for the foreign-born population - Barbados (%)
Place of birth for the foreign-born population - Cuba (%)
Place of birth for the foreign-born population - Dominica (%)
Place of birth for the foreign-born population - Dominican Republic (%)
Place of birth for the foreign-born population - Grenada (%)
Place of birth for the foreign-born population - Haiti (%)
Place of birth for the foreign-born population - Jamaica (%)
Place of birth for the foreign-born population - St. Vincent and the Grenadines (%)
Place of birth for the foreign-born population - Trinidad and Tobago (%)
Place of birth for the foreign-born population - West Indies (%)
Place of birth for the foreign-born population - Other Caribbean (%)
Place of birth for the foreign-born population - Belize (%)
Place of birth for the foreign-born population - Costa Rica (%)
Place of birth for the foreign-born population - El Salvador (%)
Place of birth for the foreign-born population - Guatemala (%)
Place of birth for the foreign-born population - Honduras (%)
Place of birth for the foreign-born population - Mexico (%)
Place of birth for the foreign-born population - Nicaragua (%)
Place of birth for the foreign-born population - Panama (%)
Place of birth for the foreign-born population - Other Central America (%)
Place of birth for the foreign-born population - Argentina (%)
Place of birth for the foreign-born population - Bolivia (%)
Place of birth for the foreign-born population - Brazil (%)
Place of birth for the foreign-born population - Chile (%)
Place of birth for the foreign-born population - Colombia (%)
Place of birth for the foreign-born population - Ecuador (%)
Place of birth for the foreign-born population - Guyana (%)
Place of birth for the foreign-born population - Peru (%)
Place of birth for the foreign-born population - Uruguay (%)
Place of birth for the foreign-born population - Venezuela (%)
Place of birth for the foreign-born population - Other South America (%)
Place of birth for the foreign-born population - Canada (%)
Place of birth for the foreign-born population - Other Northern America (%)
Place of birth for the foreign-born population - Other (%)
Latest news about races in Waterbury, CT collected exclusively by city-data.com from local newspapers, TV, and radio stations
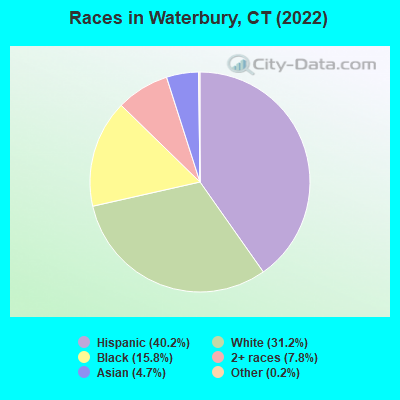
According to 2022 data, the most numerous races in Waterbury, CT are White alone (35,919 residents), Hispanic (46,226 residents), and Black alone (18,199 residents). 54.3% of Waterbury residents speak English at home. 18.8% of Waterbury, CT residents are foreign-born (11.6% born in Latin America, 3.2% born in Europe), which is 20.3% greater than the foreign-born rate of 15.0% across the entire state of Connecticut.
Race distribution in Waterbury
2000 2022
62,406 58.2% White alone 23,354 21.8% Hispanic 16,335 15.2% Black alone 2,575 2.4% Two or more races 1,584 1.5% Asian alone 655 0.6% Other race alone 319 0.3% American Indian alone 43 0.04% Native Hawaiian and Other
46,226 40.2% Hispanic 35,919 31.2% White alone 18,199 15.8% Black alone 8,958 7.8% Two or more races 5,437 4.7% Asian alone 270 0.2% Other race alone
2000 2022
2,638,845 77.5% White alone 320,323 9.4% Hispanic 295,571 8.7% Black alone 81,564 2.4% Asian alone 52,896 1.6% Two or more races 8,141 0.2% Other race alone 7,267 0.2% American Indian alone 958 0.03% Native Hawaiian and Other
2,246,913 62.0% White alone 658,978 18.2% Hispanic 353,973 9.8% Black alone 172,929 4.8% Asian alone 159,631 4.4% Two or more races 29,761 0.8% Other race alone 3,428 0.09% American Indian alone 592 0.02% Native Hawaiian and Other
Income and house value in Waterbury Median household income in 2022 $73,003 White non-Hispanic householders$32,447 Black householders$87,337 Asian householders$44,908 Some other race householders$35,064 Two or more races householders$40,042 Hispanic or Latino race householdersMedian 2022 house value $218,942 White Non-Hispanic householders$205,499 Black or African American householders$204,005 American Indian or Alaska Native householders $238,361 Asian householders$185,226 Some other race householders$224,277 Two or more races householders$188,640 Hispanic or Latino householders
Median age by race in Waterbury
48.2 Median age for White residents46.3 50.9 45.1 Median age for Black or African American residents39.1 47.8 -666,666,666.0 Median age for American Indian / Alaska Native residents-666,666,666.0 -666,666,666.0 35.4 Median age for Asian residents30.5 48.2 -666,666,666.0 Median age for Native Hawaiian / Pacific Islander residents-666,666,666.0 -666,666,666.0 28.1 Median age for Other race residents26.0 29.3 28.9 Median age for Two or more races residents25.9 31.4 50.5 Median age for White alone residents48.9 52.2 28.3 Median age for Hispanic or Latino residents25.9 30.5
Owner/renter occupied households by race in Waterbury
House owners and renters - White residents 10,457 58.5% Owner occupied7,421 41.5% Renter occupiedHouse owners and renters - Black or African American residents 2,640 33.5% Owner occupied5,238 66.5% Renter occupiedHouse owners and renters - American Indian / Alaska Native residents 89 64.5% Owner occupied49 35.5% Renter occupiedHouse owners and renters - Asian residents 763 66.8% Owner occupied380 33.2% Renter occupiedHouse owners and renters - Native Hawaiian / Pacific Islander residents 43 100.0% Renter occupiedHouse owners and renters - Other race residents 1,256 20.6% Owner occupied4,829 79.4% Renter occupiedHouse owners and renters - Two or more races residents 3,304 31.2% Owner occupied7,269 68.8% Renter occupiedHouse owners and renters - White alone residents 9,553 57.9% Owner occupied6,942 42.1% Renter occupiedHouse owners and renters - Hispanic or Latino residents 4,363 29.9% Owner occupied10,224 70.1% Renter occupied
Language usage in Waterbury
English speakers - Total 54.3% of residents of Waterbury speak English at home.
32.5% of residents speak Spanish at home 19,114 53.5% Speak English very well16,615 46.5% Speak English less than very well13.2% of residents speak other language at home 8,750 60.5% Speak English very well5,723 39.5% Speak English less than very well
English speakers - Born in the United States 65.8% of residents of Waterbury speak English at home.
29.7% of residents speak Spanish at home 4,461 68.1% Speak English very well2,086 31.9% Speak English less than very well4.5% of residents speak other language at home 991 100.0% Speak English very well
English speakers - Native, born elsewhere 16.4% of residents of Waterbury speak English at home.
83.6% of residents speak Spanish at home 6,181 49.2% Speak English very well6,394 50.8% Speak English less than very well
English speakers - Foreign-born 15.9% of residents of Waterbury speak English at home.
40.8% of residents speak Spanish at home 2,175 25.3% Speak English very well6,425 74.7% Speak English less than very well43.3% of residents speak other language at home 3,609 39.5% Speak English very well5,529 60.5% Speak English less than very well
White (Caucasian) - Speak only English Native:
79.2% (27,741)Foreign-born:
8.2% (389)
White (Caucasian) - Speak another language Native:
20.8% (7,281)Foreign-born:
91.8% (4,381)
Black or African American - Speak only English Native:
87.6% (14,459)Foreign-born:
39.4% (851)
Black or African American - Speak another language Native:
12.4% (2,056)Foreign-born:
60.6% (1,307)
American Indian / Alaska Native - Speak another language Native:
66.6% (98)Foreign-born:
92.6% (171)
Asian - Speak only English Native:
86.1% (1,602)Foreign-born:
52.5% (1,854)
Asian - Speak another language Native:
13.9% (259)Foreign-born:
47.5% (1,676)
Other race - Speak only English Native:
24.8% (2,501)Foreign-born:
3.2% (217)
Other race - Speak another language Native:
75.2% (7,565)Foreign-born:
96.8% (6,485)
Two or more races - Speak only English Native:
39.2% (9,878)Foreign-born:
1.2% (47)
Two or more races - Speak another language Native:
60.8% (15,303)Foreign-born:
98.8% (3,889)
White alone - Speak only English Native:
88.9% (26,992)Foreign-born:
8.2% (389)
White alone - Speak another language Native:
11.1% (3,360)Foreign-born:
91.8% (4,381)
Hispanic or Latino - Speak only English Native:
26.2% (8,893)Foreign-born:
2.5% (217)
Hispanic or Latino - Speak another language Native:
73.8% (25,015)Foreign-born:
97.5% (8,600)
Foreign-born residents in Waterbury 21,627 residents are foreign born (11.6% Latin America , 3.2% Europe ).
This city:
18.8%Connecticut:
15.0%
Marital status for residents in Waterbury Marital status - White (Caucasian) population 15 years and over
Males 40.9% Never married43.9% Now married1.0% Separated3.8% Widowed10.4% DivorcedFemales 25.8% Never married40.3% Now married3.3% Separated10.9% Widowed19.7% DivorcedWomen who gave birth in the past 12 months Now married:
30.9% (43)Unmarried:
69.1% (96)
Women who did not give birth in the past 12 months Now married:
37.9% (2,888)Unmarried:
62.1% (4,723)
Marital status - Black or African American population 15 years and over
Males 54.4% Never married34.3% Now married0.0% Separated0.0% Widowed11.2% DivorcedFemales 48.6% Never married6.1% Now married6.9% Separated14.7% Widowed23.8% DivorcedWomen who gave birth in the past 12 months Now married:
55.0% (187)Unmarried:
45.0% (153)
Women who did not give birth in the past 12 months Now married:
26.4% (2,136)Unmarried:
73.6% (5,945)
Marital status - American Indian / Alaska Native population 15 years and over
Males 68.2% Never married27.8% Now married0.0% Separated0.0% Widowed4.0% DivorcedFemales 44.9% Never married3.1% Now married0.0% Separated0.0% Widowed52.0% DivorcedWomen who did not give birth in the past 12 months Now married:
3.5% (3)Unmarried:
96.5% (83)
Marital status - Asian population 15 years and over
Males 19.6% Never married78.7% Now married0.0% Separated0.0% Widowed1.7% DivorcedFemales 23.4% Never married58.0% Now married0.0% Separated8.5% Widowed10.1% DivorcedWomen who did not give birth in the past 12 months Now married:
60.9% (545)Unmarried:
39.1% (350)
Marital status - Native Hawaiian / Pacific Islander population 15 years and over
Males 0.0% Never married100.0% Now married0.0% Separated0.0% Widowed0.0% DivorcedFemales 0.0% Never married0.0% Now married0.0% Separated0.0% Widowed100.0% DivorcedMarital status - Other race population 15 years and over
Males 50.1% Never married46.0% Now married3.9% Separated0.0% Widowed0.0% DivorcedFemales 37.3% Never married36.4% Now married9.3% Separated4.3% Widowed12.7% DivorcedWomen who gave birth in the past 12 months Now married:
45.0% (315)Unmarried:
55.0% (385)
Women who did not give birth in the past 12 months Now married:
44.9% (2,583)Unmarried:
55.1% (3,167)
Marital status - Two or more races population 15 years and over
Males 56.2% Never married34.7% Now married0.0% Separated0.7% Widowed8.5% DivorcedFemales 48.5% Never married28.8% Now married2.1% Separated4.5% Widowed16.1% DivorcedWomen who gave birth in the past 12 months Now married:
73.9% (376)Unmarried:
26.1% (133)
Women who did not give birth in the past 12 months Now married:
29.0% (2,619)Unmarried:
71.0% (6,414)
Marital status - White alone, not Hispanic / Latino population 15 years and over
Males 42.9% Never married40.6% Now married1.1% Separated4.1% Widowed11.3% DivorcedFemales 26.3% Never married40.3% Now married3.6% Separated11.1% Widowed18.7% DivorcedWomen who gave birth in the past 12 months Now married:
53.1% (147)Unmarried:
46.9% (130)
Women who did not give birth in the past 12 months Now married:
35.8% (2,373)Unmarried:
64.2% (4,261)
Marital status - Hispanic or Latino population 15 years and over
Males 51.1% Never married42.7% Now married1.6% Separated0.0% Widowed4.6% DivorcedFemales 47.0% Never married28.8% Now married5.1% Separated4.0% Widowed15.1% DivorcedWomen who gave birth in the past 12 months Now married:
43.1% (466)Unmarried:
56.9% (614)
Women who did not give birth in the past 12 months Now married:
32.1% (4,230)Unmarried:
67.9% (8,936)
Ancestries in Waterbury
5,546 7.9% Italian2,615 3.7% Jamaican1,865 2.7% Albanian1,833 2.6% Irish1,232 1.8% Brazilian1,053 1.5% American807 1.2% Guyanese792 1.1% Portuguese713 1.0% West Indian609 0.9% French571 0.8% German536 0.8% Polish529 0.8% English516 0.7% Trinidadian and Tobagonian455 0.6% Nigerian414 0.6% African400 0.6% Cape Verdean391 0.6% Haitian291 0.4% Lithuanian291 0.4% British West Indian286 0.4% French Canadian236 0.3% European211 0.3% Russian131 0.2% Jordanian126 0.2% Israeli113 0.2% Canadian109 0.2% Estonian68 0.10% Afghan65 0.09% Ukrainian60 0.09% Scottish58 0.08% Bahamian53 0.08% Arab49 0.07% Ugandan48 0.07% Hungarian45 0.06% Lebanese44 0.06% Macedonian40 0.06% British34 0.05% Greek33 0.05% Finnish32 0.05% Barbadian28 0.04% Eastern European28 0.04% Turkish19 0.03% Swedish17 0.02% Palestinian17 0.02% Armenian17 0.02% Belgian17 0.02% Swiss14 0.02% Scandinavian14 0.02% Slovak12 0.02% Moroccan11 0.02% Cypriot10 0.01% Dutch West Indian8 0.01% Scotch-Irish8 0.01% Romanian7 0.01% Austrian6 0.01% Iranian6 0.01% U.S. Virgin Islander5 0.01% Dutch5 0.01% Croatian
Geographical mobility in Waterbury Same house 1 year ago 38,096 94.0% White (Caucasian)15,759 83.8% Black or African American281 88.1% American Indian / Alaska Native2,964 85.7% Asian78 100.0% Native Hawaiian / Pacific Islander15,574 89.1% Other race15,993 88.0% Two or more races33,581 93.7% White alone, not Hispanic / Latino41,795 91.3% Hispanic or LatinoMoved within same county 733 1.8% White / Caucasian578 3.1% Black or African American218 6.3% Asian1,068 6.1% Other race1,566 8.6% Two or more races620 1.7% White alone, not Hispanic / Latino2,049 4.5% Hispanic or LatinoMoved within same state 292 0.7% White / Caucasian1,493 7.9% Black or African American19 5.9% American Indian / Alaska Native71 2.1% Asian243 1.4% Other race285 1.6% Two or more races292 0.8% White alone, not Hispanic / Latino293 0.6% Hispanic or LatinoMoved from different state 1,128 2.8% White / Caucasian973 5.2% Black or African American54 1.6% Asian453 2.6% Other race137 0.8% Two or more races1,041 2.9% White alone, not Hispanic / Latino1,245 2.7% Hispanic or LatinoMoved from abroad 299 0.7% White3 0.9% American Indian / Alaska Native104 3.0% Asian99 0.6% Other race42 0.2% Two or more races299 0.8% White alone, not Hispanic / Latino379 0.8% Hispanic or Latino
Children Nativity (place of birth) in Waterbury
Children under 6 years - Living with two parents Both parents native 1,152 100.0% NativeBoth parents foreign-born 965 56.3% Native749 43.7% Foreign-bornOne native, one foreign-born parent 650 86.4% Native102 13.6% Foreign-bornChildren under 6 years - Living with one parent Native parent 2,855 100.0% NativeForeign-born parent 448 100.0% NativeChildren 6 to 17 years - Living with two parents Both parents native 2,076 100.0% NativeBoth parents foreign-born 1,556 61.6% Native969 38.4% Foreign-bornOne native, one foreign-born parent 2,294 100.0% NativeChildren 6 to 17 years - Living with one parent Native parent 7,563 100.0% NativeForeign-born parent 2,737 53.4% Native2,393 46.6% Foreign-born
Place of birth for residents in Waterbury 14,120 Americas13,859 Latin America7,407 Caribbean4,559 South America3,837 Europe2,345 Eastern Europe2,150 Asia1,892 Central America1,518 Africa1,345 South Central Asia1,242 Southern Europe785 Western Africa370 Eastern Asia346 South Eastern Asia297 Eastern Africa265 China260 Northern America176 Northern Europe141 Middle Africa129 Southern Africa88 Western Asia80 Northern Africa72 Western Europe4,111 Dominican Republic2,072 Jamaica1,354 Albania1,340 Brazil1,193 Guyana1,052 Ecuador687 Guatemala647 India609 Pakistan554 Italy501 Colombia494 Portugal480 Mexico426 Cabo Verde423 Honduras415 North Macedonia (Macedonia)364 Haiti267 Cuba265 China252 Trinidad and Tobago251 Kenya229 Canada216 Nigeria209 Poland180 Peru173 El Salvador154 Vietnam152 Spain147 Venezuela144 England142 Ghana135 Philippines129 South Africa115 Ukraine110 Congo85 Korea82 Chile64 Nicaragua57 Dominica52 Afghanistan47 Morocco47 Panama45 Cambodia43 Russia42 Jordan40 Greece34 Argentina33 Egypt31 Lebanon31 Bahamas28 St. Vincent and the Grenadines27 France27 Germany25 United Kingdom24 West Indies24 Uganda18 Japan17 Switzerland14 Serbia14 Turkey13 Uzbekistan12 Sri Lanka11 Laos10 Democratic Republic of Congo (Zaire)10 Lithuania9 Iran4 Ireland4 Azores Islands3 Sweden1 Uruguay
Grandparents responsible for own grandchildren in Waterbury
Grandparents (30 to 59 years) White / Caucasian 86 21.6% Responsible for grandchildren314 78.4% Not responsible for grandchildrenBlack or African American 82 27.7% Responsible for grandchildren214 72.3% Not responsible for grandchildrenAsian 14 100.0% Not responsible for grandchildrenOther race 36 11.0% Responsible for grandchildren290 89.0% Not responsible for grandchildrenTwo or more races 16 100.0% Not responsible for grandchildrenWhite alone, not Hispanic / Latino 21 11.4% Responsible for grandchildren165 88.6% Not responsible for grandchildrenHispanic or Latino 193 30.6% Responsible for grandchildren438 69.4% Not responsible for grandchildrenGrandparents (60 years and over) White / Caucasian 40 10.7% Responsible for grandchildren334 89.3% Not responsible for grandchildrenBlack or African American 46 15.8% Responsible for grandchildren245 84.2% Not responsible for grandchildrenAsian 109 100.0% Not responsible for grandchildrenOther race 267 74.3% Responsible for grandchildren93 25.7% Not responsible for grandchildrenTwo or more races 77 100.0% Not responsible for grandchildrenWhite alone, not Hispanic / Latino 20 6.9% Responsible for grandchildren266 93.1% Not responsible for grandchildrenHispanic or Latino 160 43.9% Responsible for grandchildren204 56.1% Not responsible for grandchildren