Races in Washington, Ohio (OH) Detailed Stats
Ancestries, Foreign-born residents, place of birth

Recent posts about races in Washington, Ohio on our local forum with over 2,400,000 registered users:
 | Cleveland Development Discussions (4357 replies) |
| The Cleveland Indians are caving to the PC police (127 replies) |
| COVID-19 in Ohio (112 replies) |
| What do Ohioans think of this PBS documentary about their state from 2003? (9 replies) |
| Mt. Washington neighborhood (10 replies) |
| Accepted job offer in Cincy. Looking to buy a house - where should I look? (27 replies) |
Latest news about races in Washington, OH collected exclusively by city-data.com from local newspapers, TV, and radio stations
1.3% of Washington, OH residents are foreign-born , which is 207.4% less than the foreign-born rate of 4.0% across the entire state of Ohio.
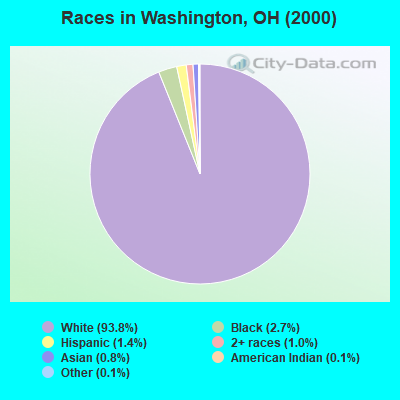
Race distribution in Washington

- 12,69193.8%White alone
- 3612.7%Black alone
- 1871.4%Hispanic
- 1371.0%Two or more races
- 1110.8%Asian alone
- 150.1%Other race alone
- 200.1%American Indian alone
- 20.01%Native Hawaiian and Other
Pacific Islander alone
2000
2022
-
- 9,538,11184.0%White alone
- 1,290,66211.4%Black alone
- 217,1231.9%Hispanic
- 137,7701.2%Two or more races
- 131,6701.2%Asian alone
- 21,9850.2%American Indian alone
- 13,4830.1%Other race alone
- 2,3360.02%Native Hawaiian and Other
Pacific Islander alone

-
- 8,948,79376.1%White alone
- 1,401,40311.9%Black alone
- 529,2914.5%Two or more races
- 517,2324.4%Hispanic
- 293,3872.5%Asian alone
- 52,8050.4%Other race alone
- 9,7850.08%American Indian alone
- 3,3620.03%Native Hawaiian and Other
Pacific Islander alone

Income and house value in Washington
- Median household income in 2022
- $54,849White non-Hispanic householders
- $46,839Black householders
- $28,107American Indian and Alaska Native householders
- $84,945Asian householders
- $65,503Some other race householders
- $46,651Two or more races householders
- $33,022Hispanic or Latino race householders
- Median 2022 house value
- $157,341White Non-Hispanic householders
- $149,978Black or African American householders
- $141,452Asian householders
- $125,950Two or more races householders
Household income for White non-Hispanic householders

Household income for Black householders

Household income for American Indian and Alaska Native householders

Household income for Asian householders

Household income for Two or more races householders

Household income for Hispanic or Latino race householders

Foreign-born residents in Washington
176 residents are foreign born
| This city: | 1.3% |
| Ohio: | 3.0% |
Ancestries in Washington

- 2,57023.9%German
- 2,42022.5%United States
- 1,66515.5%Irish
- 1,33812.4%Other
- 1,28111.9%English
- 3042.8%Italian
- 2942.7%Dutch
- 2342.2%French
- 1571.5%Scottish
- 1541.4%Scotch-Irish
- 880.8%Welsh
- 620.6%Polish
- 500.5%Swedish
- 340.3%Subsaharan African
- 220.2%Czech
- 200.2%Norwegian
- 190.2%Swiss
- 150.1%Arab
- 140.1%Ukrainian
- 90.08%Hungarian
- 70.06%Russian
- 60.06%Danish
- 50.05%French Canadian
- 50.05%Greek

Zip codes: 43160.