Races in Washington, Indiana (IN) Detailed Stats
Data:
Races - White alone (%)
Races - White alone (% change since 2000)
Races - Black alone (%)
Races - Black alone (% change since 2000)
Races - American Indian alone (%)
Races - American Indian alone (% change since 2000)
Races - Asian alone (%)
Races - Asian alone (% change since 2000)
Races - Hispanic (%)
Races - Hispanic (% change since 2000)
Races - Native Hawaiian and Other Pacific Islander alone (%)
Races - Native Hawaiian and Other Pacific Islander alone (% change since 2000)
Races - Two or more races(%)
Races - Two or more races(% change since 2000)
Races - Other race alone (%)
Races - Other race alone (% change since 2000)
Racial diversity
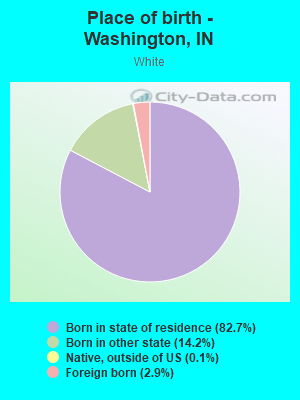
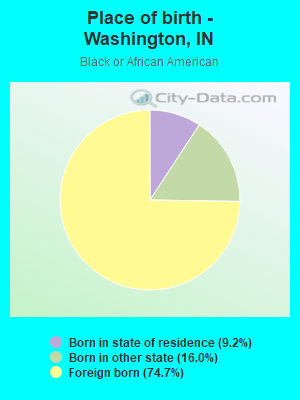
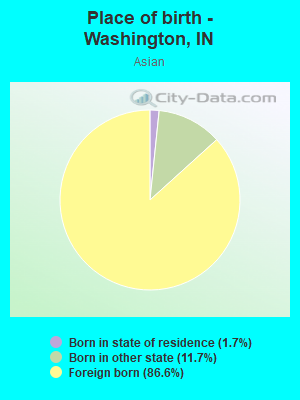
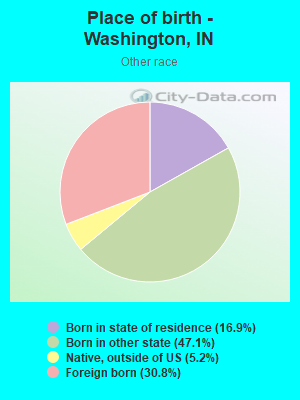
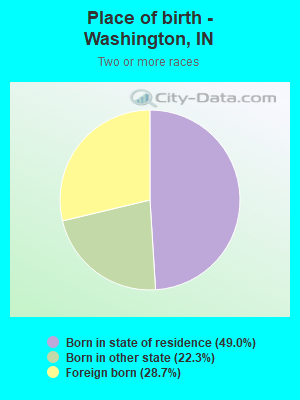
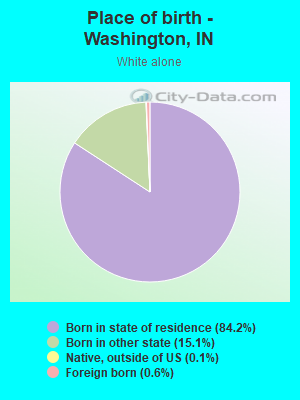
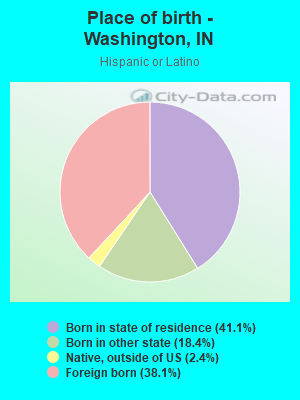
Place of birth - Born in state of residence (%)
Place of birth - Born in state of residence (%) - White
Place of birth - Born in state of residence (%) - Black or African American
Place of birth - Born in state of residence (%) - Asian
Place of birth - Born in state of residence (%) - Hispanic or Latino
Place of birth - Born in state of residence (%) - American Indian and Alaska Native
Place of birth - Born in state of residence (%) - Multirace
Place of birth - Born in state of residence (%) - Other Race
Place of birth - Born in other state (%)
Place of birth - Born in other state (%) - White
Place of birth - Born in other state (%) - Black or African American
Place of birth - Born in other state (%) - Asian
Place of birth - Born in other state (%) - Hispanic or Latino
Place of birth - Born in other state (%) - American Indian and Alaska Native
Place of birth - Born in other state (%) - Multirace
Place of birth - Born in other state (%) - Other Race
Place of birth - Native, outside of US (%)
Place of birth - Native, outside of US (%) - White
Place of birth - Native, outside of US (%) - Black or African American
Place of birth - Native, outside of US (%) - Asian
Place of birth - Native, outside of US (%) - Hispanic or Latino
Place of birth - Native, outside of US (%) - American Indian and Alaska Native
Place of birth - Native, outside of US (%) - Multirace
Place of birth - Native, outside of US (%) - Other Race
Place of birth - Foreign born (%)
Place of birth - Foreign born (%) - White
Place of birth - Foreign born (%) - Black or African American
Place of birth - Foreign born (%) - Asian
Place of birth - Foreign born (%) - Hispanic or Latino
Place of birth - Foreign born (%) - American Indian and Alaska Native
Place of birth - Foreign born (%) - Multirace
Place of birth - Foreign born (%) - Other Race
Residents speaking English at home (%)
Residents speaking English at home - Born in the United States (%)
Residents speaking English at home - Native, born elsewhere (%)
Residents speaking English at home - Foreign born (%)
Residents speaking Spanish at home (%)
Residents speaking Spanish at home - Born in the United States (%)
Residents speaking Spanish at home - Native, born elsewhere (%)
Residents speaking Spanish at home - Foreign born (%)
Residents speaking other language at home (%)
Residents speaking other language at home - Born in the United States (%)
Residents speaking other language at home - Native, born elsewhere (%)
Residents speaking other language at home - Foreign born (%)
Marital status - Never married (%)
Marital status - Now married (%)
Marital status - Separated (%)
Marital status - Widowed (%)
Marital status - Divorced (%)
Ancestries Reported - Arab (%)
Ancestries Reported - Czech (%)
Ancestries Reported - Danish (%)
Ancestries Reported - Dutch (%)
Ancestries Reported - English (%)
Ancestries Reported - French (%)
Ancestries Reported - French Canadian (%)
Ancestries Reported - German (%)
Ancestries Reported - Greek (%)
Ancestries Reported - Hungarian (%)
Ancestries Reported - Irish (%)
Ancestries Reported - Italian (%)
Ancestries Reported - Lithuanian (%)
Ancestries Reported - Norwegian (%)
Ancestries Reported - Polish (%)
Ancestries Reported - Portuguese (%)
Ancestries Reported - Russian (%)
Ancestries Reported - Scotch-Irish (%)
Ancestries Reported - Scottish (%)
Ancestries Reported - Slovak (%)
Ancestries Reported - Subsaharan African (%)
Ancestries Reported - Swedish (%)
Ancestries Reported - Swiss (%)
Ancestries Reported - Ukrainian (%)
Ancestries Reported - United States (%)
Ancestries Reported - Welsh (%)
Ancestries Reported - West Indian (%)
Ancestries Reported - Other (%)
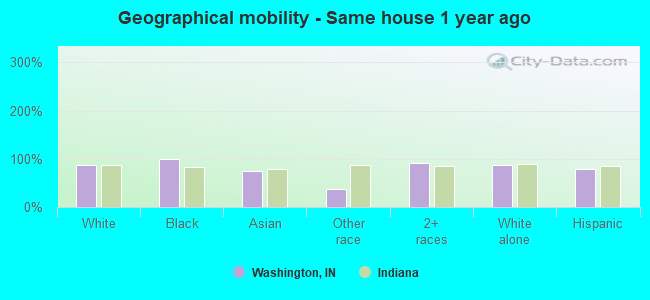
Geographical mobility - Same house 1 year ago (%)
Geographical mobility - Same house 1 year ago (%) - White
Geographical mobility - Same house 1 year ago (%) - Black or African American
Geographical mobility - Same house 1 year ago (%) - Asian
Geographical mobility - Same house 1 year ago (%) - Hispanic or Latino
Geographical mobility - Same house 1 year ago (%) - American Indian and Alaska Native
Geographical mobility - Same house 1 year ago (%) - Multirace
Geographical mobility - Same house 1 year ago (%) - Other Race
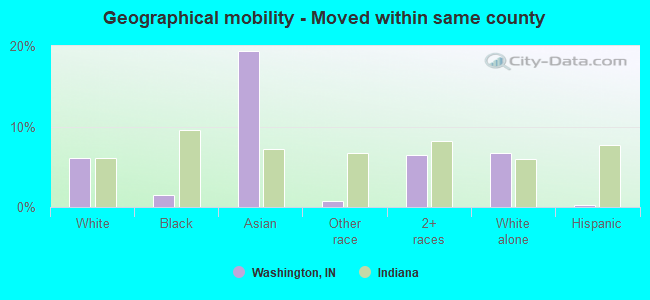
Geographical mobility - Moved within same county (%)
Geographical mobility - Moved within same county (%) - White
Geographical mobility - Moved within same county (%) - Black or African American
Geographical mobility - Moved within same county (%) - Asian
Geographical mobility - Moved within same county (%) - Hispanic or Latino
Geographical mobility - Moved within same county (%) - American Indian and Alaska Native
Geographical mobility - Moved within same county (%) - Multirace
Geographical mobility - Moved within same county (%) - Other Race
Geographical mobility - Moved from different county within same state (%)
Geographical mobility - Moved from different county within same state (%) - White
Geographical mobility - Moved from different county within same state (%) - Black or African American
Geographical mobility - Moved from different county within same state (%) - Asian
Geographical mobility - Moved from different county within same state (%) - Hispanic or Latino
Geographical mobility - Moved from different county within same state (%) - American Indian and Alaska Native
Geographical mobility - Moved from different county within same state (%) - Multirace
Geographical mobility - Moved from different county within same state (%) - Other Race
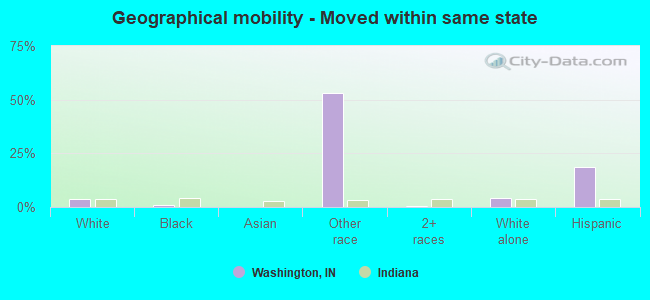
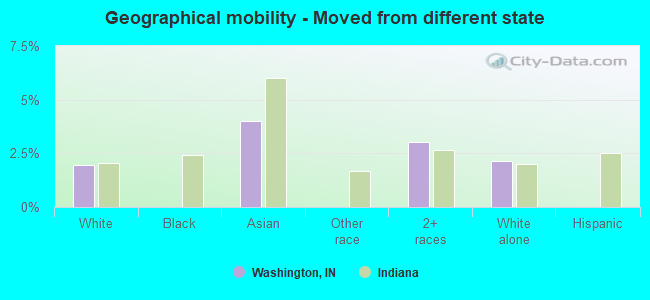
Geographical mobility - Moved from different state (%)
Geographical mobility - Moved from different state (%) - White
Geographical mobility - Moved from different state (%) - Black or African American
Geographical mobility - Moved from different state (%) - Asian
Geographical mobility - Moved from different state (%) - Hispanic or Latino
Geographical mobility - Moved from different state (%) - American Indian and Alaska Native
Geographical mobility - Moved from different state (%) - Multirace
Geographical mobility - Moved from different state (%) - Other Race
Geographical mobility - Moved from abroad (%)
Geographical mobility - Moved from abroad (%) - White
Geographical mobility - Moved from abroad (%) - Black or African American
Geographical mobility - Moved from abroad (%) - Asian
Geographical mobility - Moved from abroad (%) - Hispanic or Latino
Geographical mobility - Moved from abroad (%) - American Indian and Alaska Native
Geographical mobility - Moved from abroad (%) - Multirace
Geographical mobility - Moved from abroad (%) - Other Race
Place of birth for the foreign-born population - Ireland (%)
Place of birth for the foreign-born population - Denmark (%)
Place of birth for the foreign-born population - Norway (%)
Place of birth for the foreign-born population - Sweden (%)
Place of birth for the foreign-born population - United Kingdom (%)
Place of birth for the foreign-born population - England (%)
Place of birth for the foreign-born population - Scotland (%)
Place of birth for the foreign-born population - Other Northern Europe (%)
Place of birth for the foreign-born population - Austria (%)
Place of birth for the foreign-born population - Belgium (%)
Place of birth for the foreign-born population - France (%)
Place of birth for the foreign-born population - Germany (%)
Place of birth for the foreign-born population - Netherlands (%)
Place of birth for the foreign-born population - Switzerland (%)
Place of birth for the foreign-born population - Other Western Europe (%)
Place of birth for the foreign-born population - Greece (%)
Place of birth for the foreign-born population - Italy (%)
Place of birth for the foreign-born population - Portugal (%)
Place of birth for the foreign-born population - Spain (%)
Place of birth for the foreign-born population - Other Southern Europe (%)
Place of birth for the foreign-born population - Albania (%)
Place of birth for the foreign-born population - Belarus (%)
Place of birth for the foreign-born population - Bosnia and Herzegovina (%)
Place of birth for the foreign-born population - Bulgaria (%)
Place of birth for the foreign-born population - Croatia (%)
Place of birth for the foreign-born population - Czechoslovakia (%)
Place of birth for the foreign-born population - Hungary (%)
Place of birth for the foreign-born population - Latvia (%)
Place of birth for the foreign-born population - Lithuania (%)
Place of birth for the foreign-born population - North Macedonia (Macedonia) (%)
Place of birth for the foreign-born population - Moldova (%)
Place of birth for the foreign-born population - Poland (%)
Place of birth for the foreign-born population - Romania (%)
Place of birth for the foreign-born population - Russia (%)
Place of birth for the foreign-born population - Serbia (%)
Place of birth for the foreign-born population - Ukraine (%)
Place of birth for the foreign-born population - Other Eastern Europe (%)
Place of birth for the foreign-born population - China (%)
Place of birth for the foreign-born population - Hong Kong (%)
Place of birth for the foreign-born population - Taiwan (%)
Place of birth for the foreign-born population - Japan (%)
Place of birth for the foreign-born population - Korea (%)
Place of birth for the foreign-born population - Other Eastern Asia (%)
Place of birth for the foreign-born population - Afghanistan (%)
Place of birth for the foreign-born population - Bangladesh (%)
Place of birth for the foreign-born population - India (%)
Place of birth for the foreign-born population - Iran (%)
Place of birth for the foreign-born population - Kazakhstan (%)
Place of birth for the foreign-born population - Nepal (%)
Place of birth for the foreign-born population - Pakistan (%)
Place of birth for the foreign-born population - Sri Lanka (%)
Place of birth for the foreign-born population - Uzbekistan (%)
Place of birth for the foreign-born population - Other South Central Asia (%)
Place of birth for the foreign-born population - Burma (%)
Place of birth for the foreign-born population - Cambodia (%)
Place of birth for the foreign-born population - Indonesia (%)
Place of birth for the foreign-born population - Laos (%)
Place of birth for the foreign-born population - Malaysia (%)
Place of birth for the foreign-born population - Philippines (%)
Place of birth for the foreign-born population - Singapore (%)
Place of birth for the foreign-born population - Thailand (%)
Place of birth for the foreign-born population - Vietnam (%)
Place of birth for the foreign-born population - Other South Eastern Asia (%)
Place of birth for the foreign-born population - Armenia (%)
Place of birth for the foreign-born population - Iraq (%)
Place of birth for the foreign-born population - Israel (%)
Place of birth for the foreign-born population - Jordan (%)
Place of birth for the foreign-born population - Kuwait (%)
Place of birth for the foreign-born population - Lebanon (%)
Place of birth for the foreign-born population - Saudi Arabia (%)
Place of birth for the foreign-born population - Syria (%)
Place of birth for the foreign-born population - Turkey (%)
Place of birth for the foreign-born population - Yemen (%)
Place of birth for the foreign-born population - Other Western Asia (%)
Place of birth for the foreign-born population - Eritrea (%)
Place of birth for the foreign-born population - Ethiopia (%)
Place of birth for the foreign-born population - Kenya (%)
Place of birth for the foreign-born population - Somalia (%)
Place of birth for the foreign-born population - Uganda (%)
Place of birth for the foreign-born population - Zimbabwe (%)
Place of birth for the foreign-born population - Other Eastern Africa (%)
Place of birth for the foreign-born population - Cameroon (%)
Place of birth for the foreign-born population - Congo (%)
Place of birth for the foreign-born population - Democratic Republic of Congo (Zaire) (%)
Place of birth for the foreign-born population - Other Middle Africa (%)
Place of birth for the foreign-born population - Egypt (%)
Place of birth for the foreign-born population - Morocco (%)
Place of birth for the foreign-born population - Sudan (%)
Place of birth for the foreign-born population - Other Northern Africa (%)
Place of birth for the foreign-born population - South Africa (%)
Place of birth for the foreign-born population - Other Southern Africa (%)
Place of birth for the foreign-born population - Cabo Verde (%)
Place of birth for the foreign-born population - Ghana (%)
Place of birth for the foreign-born population - Liberia (%)
Place of birth for the foreign-born population - Nigeria (%)
Place of birth for the foreign-born population - Senegal (%)
Place of birth for the foreign-born population - Sierra Leone (%)
Place of birth for the foreign-born population - Other Western Africa (%)
Place of birth for the foreign-born population - Australia (%)
Place of birth for the foreign-born population - New Zealand (%)
Place of birth for the foreign-born population - Fiji (%)
Place of birth for the foreign-born population - Micronesia (%)
Place of birth for the foreign-born population - Bahamas (%)
Place of birth for the foreign-born population - Barbados (%)
Place of birth for the foreign-born population - Cuba (%)
Place of birth for the foreign-born population - Dominica (%)
Place of birth for the foreign-born population - Dominican Republic (%)
Place of birth for the foreign-born population - Grenada (%)
Place of birth for the foreign-born population - Haiti (%)
Place of birth for the foreign-born population - Jamaica (%)
Place of birth for the foreign-born population - St. Vincent and the Grenadines (%)
Place of birth for the foreign-born population - Trinidad and Tobago (%)
Place of birth for the foreign-born population - West Indies (%)
Place of birth for the foreign-born population - Other Caribbean (%)
Place of birth for the foreign-born population - Belize (%)
Place of birth for the foreign-born population - Costa Rica (%)
Place of birth for the foreign-born population - El Salvador (%)
Place of birth for the foreign-born population - Guatemala (%)
Place of birth for the foreign-born population - Honduras (%)
Place of birth for the foreign-born population - Mexico (%)
Place of birth for the foreign-born population - Nicaragua (%)
Place of birth for the foreign-born population - Panama (%)
Place of birth for the foreign-born population - Other Central America (%)
Place of birth for the foreign-born population - Argentina (%)
Place of birth for the foreign-born population - Bolivia (%)
Place of birth for the foreign-born population - Brazil (%)
Place of birth for the foreign-born population - Chile (%)
Place of birth for the foreign-born population - Colombia (%)
Place of birth for the foreign-born population - Ecuador (%)
Place of birth for the foreign-born population - Guyana (%)
Place of birth for the foreign-born population - Peru (%)
Place of birth for the foreign-born population - Uruguay (%)
Place of birth for the foreign-born population - Venezuela (%)
Place of birth for the foreign-born population - Other South America (%)
Place of birth for the foreign-born population - Canada (%)
Place of birth for the foreign-born population - Other Northern America (%)
Place of birth for the foreign-born population - Other (%)
Latest news about races in Washington, IN collected exclusively by city-data.com from local newspapers, TV, and radio stations
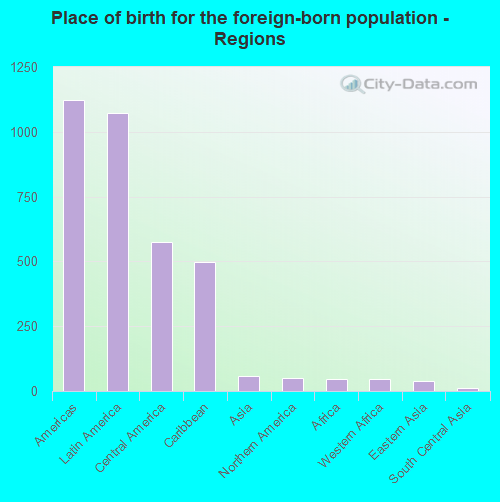
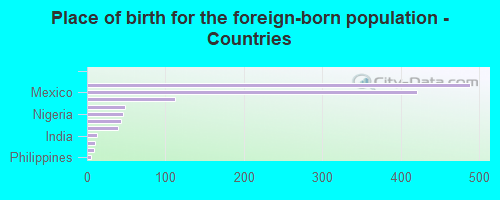
According to 2022 data, the most numerous races in Washington, IN are White alone (9,106 residents), Black alone (463 residents), and Hispanic (1,531 residents). 84.6% of Washington residents speak English at home. 10.2% of Washington, IN residents are foreign-born (8.1% born in Latin America), which is 41.1% greater than the foreign-born rate of 6.0% across the entire state of Indiana.
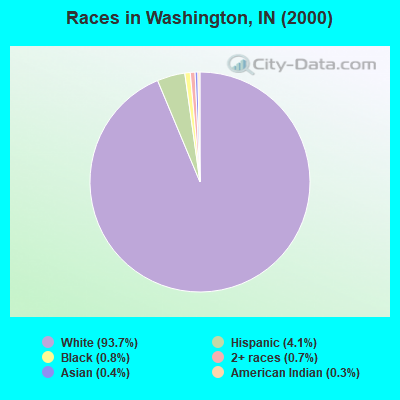
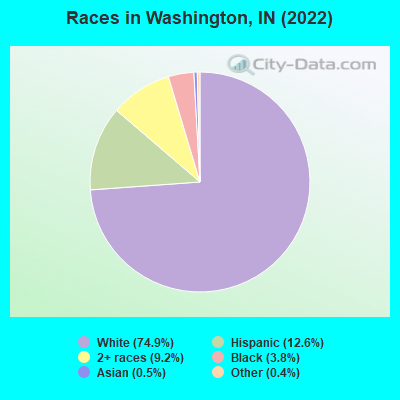
Race distribution in Washington
2000 2022
5,219,373 85.8% White alone 505,462 8.3% Black alone 214,536 3.5% Hispanic 61,115 1.0% Two or more races 58,424 1.0% Asian alone 13,654 0.2% American Indian alone 6,348 0.1% Other race alone 1,573 0.03% Native Hawaiian and Other
5,192,455 76.0% White alone 628,054 9.2% Black alone 534,528 7.8% Hispanic 263,242 3.9% Two or more races 172,880 2.5% Asian alone 33,467 0.5% Other race alone 5,866 0.09% American Indian alone 2,545 0.04% Native Hawaiian and Other
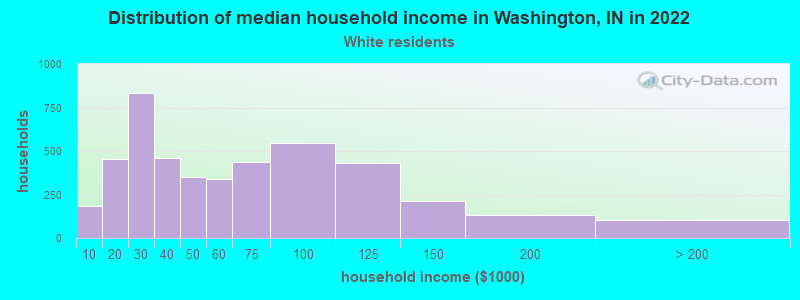
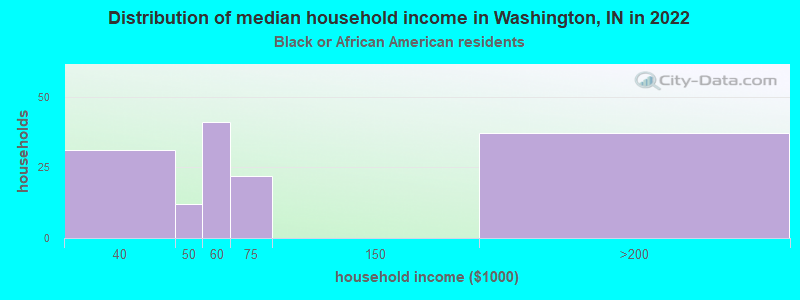
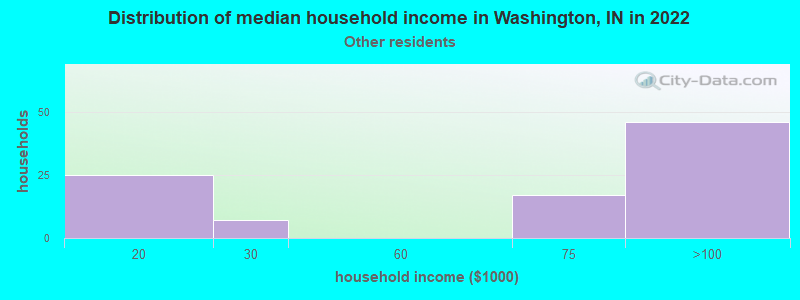
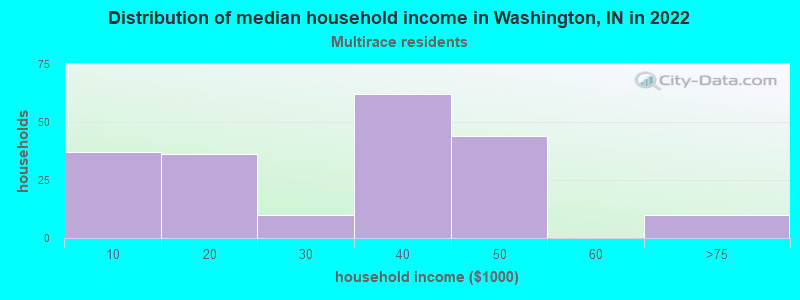
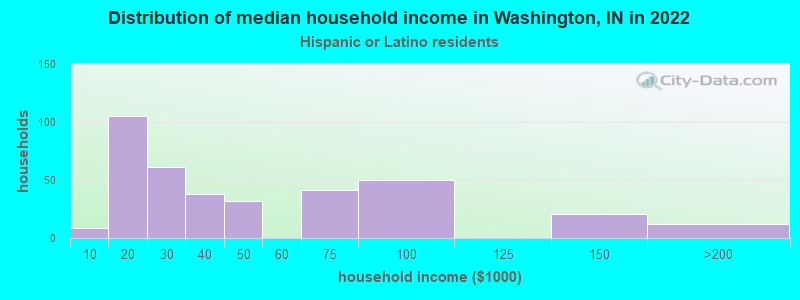
Income and house value in Washington Median household income in 2022 $49,690 White non-Hispanic householders$53,441 Black householders$68,755 Some other race householders$35,889 Two or more races householders$36,491 Hispanic or Latino race householdersMedian 2022 house value $141,569 White Non-Hispanic householders$106,454 Black or African American householders$250,024 American Indian or Alaska Native householders $305,585 Asian householders$144,458 Two or more races householders$83,341 Hispanic or Latino householders
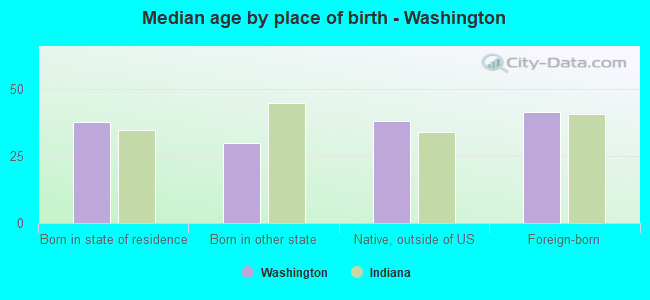
Median age by race in Washington
41.0 Median age for White residents37.4 44.1 34.5 Median age for Black or African American residents31.2 52.3 -558,797,523.8 Median age for American Indian / Alaska Native residents-654,255,318.5 -491,600,353.2 43.6 Median age for Asian residents20.4 42.9 -664,335,663.7 Median age for Native Hawaiian / Pacific Islander residents-644,025,156.6 -664,437,011.6 17.1 Median age for Other race residents13.2 18.0 22.0 Median age for Two or more races residents33.5 22.0 44.1 Median age for White alone residents40.4 45.9 16.7 Median age for Hispanic or Latino residents21.0 16.8
Owner/renter occupied households by race in Washington
House owners and renters - White residents 2,502 55.8% Owner occupied1,979 44.2% Renter occupiedHouse owners and renters - Black or African American residents 19 13.4% Owner occupied123 86.6% Renter occupiedHouse owners and renters - Asian residents 2 100.0% Renter occupiedHouse owners and renters - Other race residents 54 53.3% Owner occupied48 46.7% Renter occupiedHouse owners and renters - Two or more races residents 63 34.1% Owner occupied122 65.9% Renter occupiedHouse owners and renters - White alone residents 2,423 56.1% Owner occupied1,899 43.9% Renter occupiedHouse owners and renters - Hispanic or Latino residents 182 52.1% Owner occupied168 47.9% Renter occupied
Language usage in Washington
English speakers - Total 84.6% of residents of Washington speak English at home.
9.4% of residents speak Spanish at home 558 53.3% Speak English very well489 46.7% Speak English less than very well6.5% of residents speak other language at home 383 53.0% Speak English very well339 47.0% Speak English less than very well
English speakers - Born in the United States 96.3% of residents of Washington speak English at home.
0.5% of residents speak Spanish at home 10 100.0% Speak English very well3.1% of residents speak other language at home 59 100.0% Speak English very well
English speakers - Native, born elsewhere 26.1% of residents of Washington speak English at home.
69.6% of residents speak Spanish at home 32 100.0% Speak English less than very well
English speakers - Foreign-born 9.4% of residents of Washington speak English at home.
44.7% of residents speak Spanish at home 146 26.3% Speak English very well409 73.7% Speak English less than very well46.7% of residents speak other language at home 237 40.8% Speak English very well344 59.2% Speak English less than very well
White (Caucasian) - Speak only English Native:
94.9% (8,273)Foreign-born:
13.1% (38)
White (Caucasian) - Speak another language Native:
5.0% (432)Foreign-born:
82.5% (239)
Black or African American - Speak only English Native:
81.9% (97)Foreign-born:
11.6% (54)
Black or African American - Speak another language Native:
22.1% (26)Foreign-born:
94.5% (438)
Asian - Speak another language Native:
70.0% (5)Foreign-born:
99.7% (53)
Other race - Speak only English Native:
91.2% (306)Foreign-born:
13.8% (23)
Other race - Speak another language Native:
14.5% (49)Foreign-born:
86.6% (146)
Two or more races - Speak another language Native:
9.3% (82)Foreign-born:
99.0% (385)
White alone - Speak only English Native:
98.6% (8,257)Foreign-born:
47.4% (27)
White alone - Speak another language Native:
1.4% (115)Foreign-born:
51.7% (29)
Hispanic or Latino - Speak only English Native:
39.6% (291)Foreign-born:
6.2% (37)
Hispanic or Latino - Speak another language Native:
61.3% (450)Foreign-born:
93.6% (550)
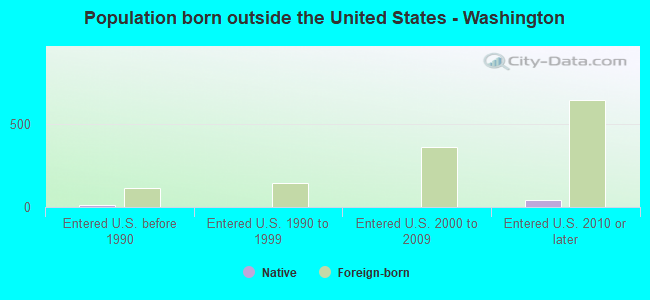
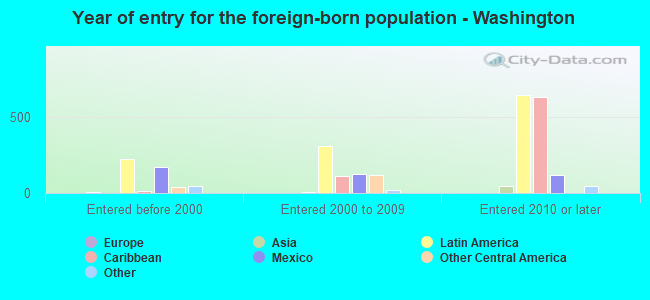
Foreign-born residents in Washington 1,239 residents are foreign born (8.1% Latin America ).
This city:
10.2%Indiana:
5.6%
Marital status for residents in Washington Marital status - White (Caucasian) population 15 years and over
Males 26.1% Never married55.5% Now married1.4% Separated3.1% Widowed13.9% DivorcedFemales 17.9% Never married46.3% Now married1.4% Separated13.3% Widowed21.1% DivorcedWomen who gave birth in the past 12 months Now married:
73.5% (110)Unmarried:
26.5% (40)
Women who did not give birth in the past 12 months Now married:
50.9% (930)Unmarried:
49.1% (898)
Marital status - Black or African American population 15 years and over
Males 34.2% Never married53.2% Now married5.4% Separated0.0% Widowed7.2% DivorcedFemales 37.6% Never married24.4% Now married16.2% Separated18.3% Widowed3.6% DivorcedWomen who did not give birth in the past 12 months Now married:
35.6% (32)Unmarried:
64.4% (58)
Marital status - Asian population 15 years and over
Males 75.0% Never married25.0% Now married0.0% Separated0.0% Widowed0.0% DivorcedFemales 0.0% Never married100.0% Now married0.0% Separated0.0% Widowed0.0% DivorcedWomen who did not give birth in the past 12 months Now married:
100.0% (43)Unmarried:
0.0% (0)
Marital status - Other race population 15 years and over
Males 32.1% Never married10.7% Now married0.0% Separated0.0% Widowed57.1% DivorcedFemales 82.1% Never married0.0% Now married17.9% Separated0.0% Widowed0.0% DivorcedWomen who gave birth in the past 12 months Now married:
0.0% (0)Unmarried:
100.0% (25)
Women who did not give birth in the past 12 months Now married:
19.6% (52)Unmarried:
80.4% (214)
Marital status - Two or more races population 15 years and over
Males 30.3% Never married55.1% Now married14.6% Separated0.0% Widowed0.0% DivorcedFemales 38.3% Never married40.6% Now married0.8% Separated17.5% Widowed2.7% DivorcedWomen who gave birth in the past 12 months Now married:
100.0% (37)Unmarried:
0.0% (0)
Women who did not give birth in the past 12 months Now married:
22.3% (71)Unmarried:
77.7% (248)
Marital status - White alone, not Hispanic / Latino population 15 years and over
Males 24.7% Never married56.1% Now married1.6% Separated3.3% Widowed14.3% DivorcedFemales 17.3% Never married45.7% Now married1.4% Separated13.9% Widowed21.7% DivorcedWomen who gave birth in the past 12 months Now married:
73.5% (112)Unmarried:
26.5% (40)
Women who did not give birth in the past 12 months Now married:
50.1% (863)Unmarried:
49.9% (861)
Marital status - Hispanic or Latino population 15 years and over
Males 42.0% Never married41.5% Now married0.0% Separated0.0% Widowed16.6% DivorcedFemales 57.7% Never married29.3% Now married10.9% Separated0.0% Widowed2.1% DivorcedWomen who gave birth in the past 12 months Now married:
0.0% (0)Unmarried:
100.0% (23)
Women who did not give birth in the past 12 months Now married:
36.6% (142)Unmarried:
63.4% (246)
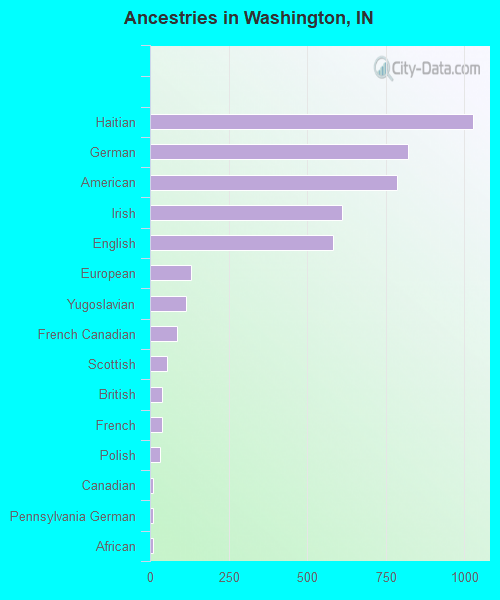
Ancestries in Washington
1,027 17.9% Haitian821 14.3% German786 13.7% American611 10.6% Irish582 10.1% English130 2.3% European114 2.0% Yugoslavian86 1.5% French Canadian53 0.9% Scottish39 0.7% British38 0.7% French31 0.5% Polish11 0.2% Canadian10 0.2% Pennsylvania German10 0.2% African9 0.2% Dutch9 0.2% Italian8 0.1% Northern European7 0.1% Iranian7 0.1% Norwegian7 0.1% Scotch-Irish5 0.09% Welsh3 0.05% Hungarian
Children Nativity (place of birth) in Washington
Children under 6 years - Living with two parents Both parents native 438 100.0% NativeBoth parents foreign-born 230 100.0% NativeChildren under 6 years - Living with one parent Native parent 284 100.0% NativeForeign-born parent 39 100.0% NativeChildren 6 to 17 years - Living with two parents Both parents native 611 100.0% NativeBoth parents foreign-born 293 66.9% Native145 33.1% Foreign-bornOne native, one foreign-born parent 46 100.0% NativeChildren 6 to 17 years - Living with one parent Native parent 341 100.0% NativeForeign-born parent 332 52.0% Native306 48.0% Foreign-born
Grandparents responsible for own grandchildren in Washington
Grandparents (30 to 59 years) White / Caucasian 15 100.0% Responsible for grandchildrenAsian 5 100.0% Responsible for grandchildrenWhite alone, not Hispanic / Latino 16 100.0% Responsible for grandchildrenGrandparents (60 years and over) White / Caucasian 108 52.4% Responsible for grandchildren98 47.6% Not responsible for grandchildrenWhite alone, not Hispanic / Latino 109 52.3% Responsible for grandchildren100 47.7% Not responsible for grandchildren