Races in Washington, District of Columbia (DC) Detailed Stats
Data:
Races - White alone (%)
Races - White alone (% change since 2000)
Races - Black alone (%)
Races - Black alone (% change since 2000)
Races - American Indian alone (%)
Races - American Indian alone (% change since 2000)
Races - Asian alone (%)
Races - Asian alone (% change since 2000)
Races - Hispanic (%)
Races - Hispanic (% change since 2000)
Races - Native Hawaiian and Other Pacific Islander alone (%)
Races - Native Hawaiian and Other Pacific Islander alone (% change since 2000)
Races - Two or more races(%)
Races - Two or more races(% change since 2000)
Races - Other race alone (%)
Races - Other race alone (% change since 2000)
Racial diversity
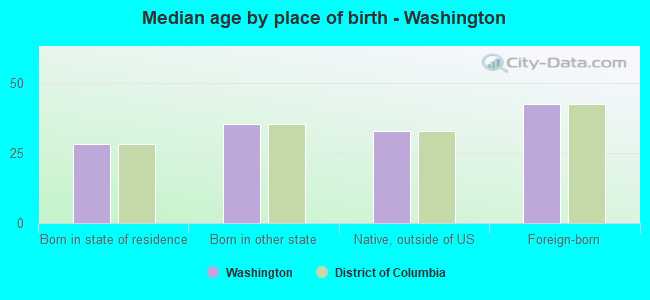
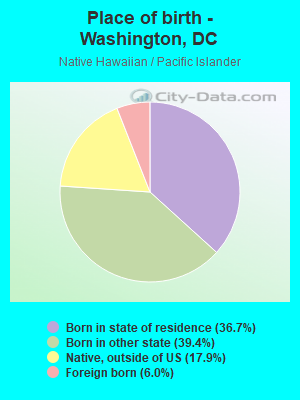
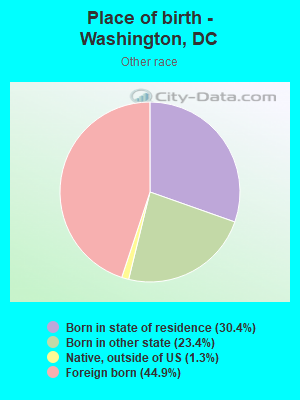
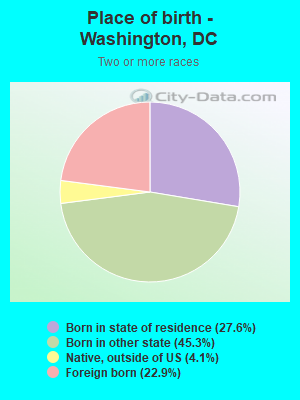
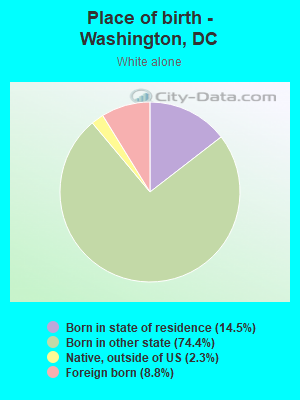
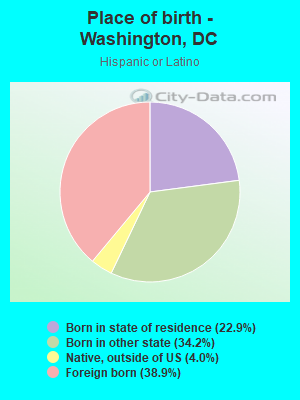
Place of birth - Born in state of residence (%)
Place of birth - Born in state of residence (%) - White
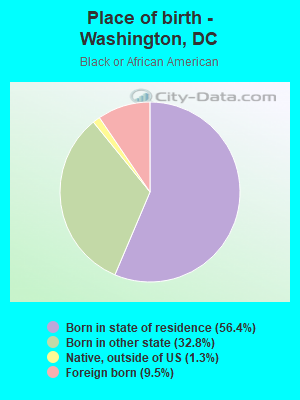
Place of birth - Born in state of residence (%) - Black or African American
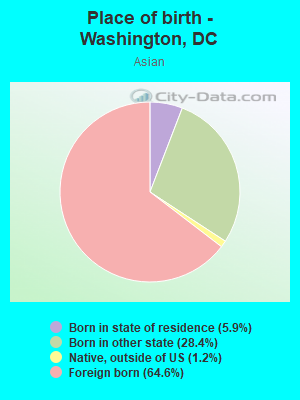
Place of birth - Born in state of residence (%) - Asian
Place of birth - Born in state of residence (%) - Hispanic or Latino
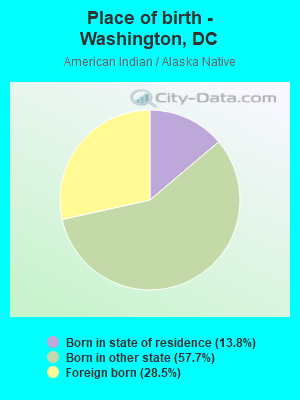
Place of birth - Born in state of residence (%) - American Indian and Alaska Native
Place of birth - Born in state of residence (%) - Multirace
Place of birth - Born in state of residence (%) - Other Race
Place of birth - Born in other state (%)
Place of birth - Born in other state (%) - White
Place of birth - Born in other state (%) - Black or African American
Place of birth - Born in other state (%) - Asian
Place of birth - Born in other state (%) - Hispanic or Latino
Place of birth - Born in other state (%) - American Indian and Alaska Native
Place of birth - Born in other state (%) - Multirace
Place of birth - Born in other state (%) - Other Race
Place of birth - Native, outside of US (%)
Place of birth - Native, outside of US (%) - White
Place of birth - Native, outside of US (%) - Black or African American
Place of birth - Native, outside of US (%) - Asian
Place of birth - Native, outside of US (%) - Hispanic or Latino
Place of birth - Native, outside of US (%) - American Indian and Alaska Native
Place of birth - Native, outside of US (%) - Multirace
Place of birth - Native, outside of US (%) - Other Race
Place of birth - Foreign born (%)
Place of birth - Foreign born (%) - White
Place of birth - Foreign born (%) - Black or African American
Place of birth - Foreign born (%) - Asian
Place of birth - Foreign born (%) - Hispanic or Latino
Place of birth - Foreign born (%) - American Indian and Alaska Native
Place of birth - Foreign born (%) - Multirace
Place of birth - Foreign born (%) - Other Race
Residents speaking English at home (%)
Residents speaking English at home - Born in the United States (%)
Residents speaking English at home - Native, born elsewhere (%)
Residents speaking English at home - Foreign born (%)
Residents speaking Spanish at home (%)
Residents speaking Spanish at home - Born in the United States (%)
Residents speaking Spanish at home - Native, born elsewhere (%)
Residents speaking Spanish at home - Foreign born (%)
Residents speaking other language at home (%)
Residents speaking other language at home - Born in the United States (%)
Residents speaking other language at home - Native, born elsewhere (%)
Residents speaking other language at home - Foreign born (%)
Marital status - Never married (%)
Marital status - Now married (%)
Marital status - Separated (%)
Marital status - Widowed (%)
Marital status - Divorced (%)
Ancestries Reported - Arab (%)
Ancestries Reported - Czech (%)
Ancestries Reported - Danish (%)
Ancestries Reported - Dutch (%)
Ancestries Reported - English (%)
Ancestries Reported - French (%)
Ancestries Reported - French Canadian (%)
Ancestries Reported - German (%)
Ancestries Reported - Greek (%)
Ancestries Reported - Hungarian (%)
Ancestries Reported - Irish (%)
Ancestries Reported - Italian (%)
Ancestries Reported - Lithuanian (%)
Ancestries Reported - Norwegian (%)
Ancestries Reported - Polish (%)
Ancestries Reported - Portuguese (%)
Ancestries Reported - Russian (%)
Ancestries Reported - Scotch-Irish (%)
Ancestries Reported - Scottish (%)
Ancestries Reported - Slovak (%)
Ancestries Reported - Subsaharan African (%)
Ancestries Reported - Swedish (%)
Ancestries Reported - Swiss (%)
Ancestries Reported - Ukrainian (%)
Ancestries Reported - United States (%)
Ancestries Reported - Welsh (%)
Ancestries Reported - West Indian (%)
Ancestries Reported - Other (%)
Geographical mobility - Same house 1 year ago (%)
Geographical mobility - Same house 1 year ago (%) - White
Geographical mobility - Same house 1 year ago (%) - Black or African American
Geographical mobility - Same house 1 year ago (%) - Asian
Geographical mobility - Same house 1 year ago (%) - Hispanic or Latino
Geographical mobility - Same house 1 year ago (%) - American Indian and Alaska Native
Geographical mobility - Same house 1 year ago (%) - Multirace
Geographical mobility - Same house 1 year ago (%) - Other Race
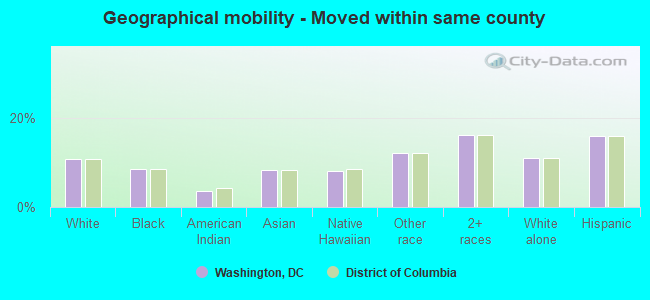
Geographical mobility - Moved within same county (%)
Geographical mobility - Moved within same county (%) - White
Geographical mobility - Moved within same county (%) - Black or African American
Geographical mobility - Moved within same county (%) - Asian
Geographical mobility - Moved within same county (%) - Hispanic or Latino
Geographical mobility - Moved within same county (%) - American Indian and Alaska Native
Geographical mobility - Moved within same county (%) - Multirace
Geographical mobility - Moved within same county (%) - Other Race
Geographical mobility - Moved from different county within same state (%)
Geographical mobility - Moved from different county within same state (%) - White
Geographical mobility - Moved from different county within same state (%) - Black or African American
Geographical mobility - Moved from different county within same state (%) - Asian
Geographical mobility - Moved from different county within same state (%) - Hispanic or Latino
Geographical mobility - Moved from different county within same state (%) - American Indian and Alaska Native
Geographical mobility - Moved from different county within same state (%) - Multirace
Geographical mobility - Moved from different county within same state (%) - Other Race
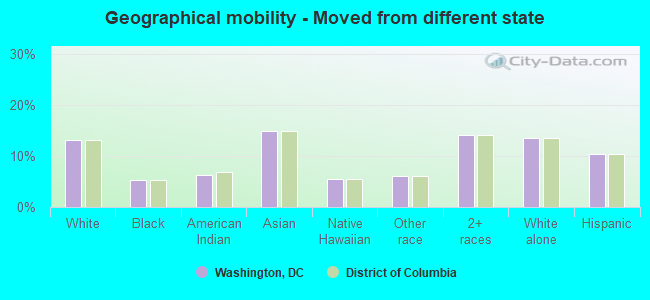
Geographical mobility - Moved from different state (%)
Geographical mobility - Moved from different state (%) - White
Geographical mobility - Moved from different state (%) - Black or African American
Geographical mobility - Moved from different state (%) - Asian
Geographical mobility - Moved from different state (%) - Hispanic or Latino
Geographical mobility - Moved from different state (%) - American Indian and Alaska Native
Geographical mobility - Moved from different state (%) - Multirace
Geographical mobility - Moved from different state (%) - Other Race
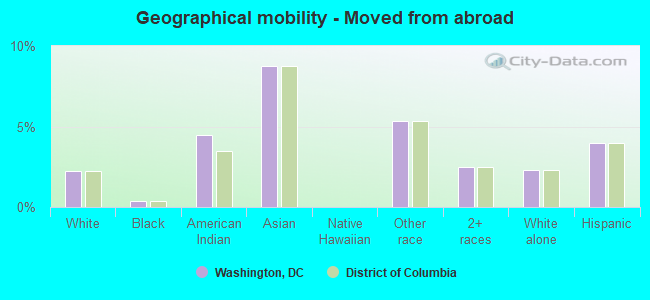
Geographical mobility - Moved from abroad (%)
Geographical mobility - Moved from abroad (%) - White
Geographical mobility - Moved from abroad (%) - Black or African American
Geographical mobility - Moved from abroad (%) - Asian
Geographical mobility - Moved from abroad (%) - Hispanic or Latino
Geographical mobility - Moved from abroad (%) - American Indian and Alaska Native
Geographical mobility - Moved from abroad (%) - Multirace
Geographical mobility - Moved from abroad (%) - Other Race
Place of birth for the foreign-born population - Ireland (%)
Place of birth for the foreign-born population - Denmark (%)
Place of birth for the foreign-born population - Norway (%)
Place of birth for the foreign-born population - Sweden (%)
Place of birth for the foreign-born population - United Kingdom (%)
Place of birth for the foreign-born population - England (%)
Place of birth for the foreign-born population - Scotland (%)
Place of birth for the foreign-born population - Other Northern Europe (%)
Place of birth for the foreign-born population - Austria (%)
Place of birth for the foreign-born population - Belgium (%)
Place of birth for the foreign-born population - France (%)
Place of birth for the foreign-born population - Germany (%)
Place of birth for the foreign-born population - Netherlands (%)
Place of birth for the foreign-born population - Switzerland (%)
Place of birth for the foreign-born population - Other Western Europe (%)
Place of birth for the foreign-born population - Greece (%)
Place of birth for the foreign-born population - Italy (%)
Place of birth for the foreign-born population - Portugal (%)
Place of birth for the foreign-born population - Spain (%)
Place of birth for the foreign-born population - Other Southern Europe (%)
Place of birth for the foreign-born population - Albania (%)
Place of birth for the foreign-born population - Belarus (%)
Place of birth for the foreign-born population - Bosnia and Herzegovina (%)
Place of birth for the foreign-born population - Bulgaria (%)
Place of birth for the foreign-born population - Croatia (%)
Place of birth for the foreign-born population - Czechoslovakia (%)
Place of birth for the foreign-born population - Hungary (%)
Place of birth for the foreign-born population - Latvia (%)
Place of birth for the foreign-born population - Lithuania (%)
Place of birth for the foreign-born population - North Macedonia (Macedonia) (%)
Place of birth for the foreign-born population - Moldova (%)
Place of birth for the foreign-born population - Poland (%)
Place of birth for the foreign-born population - Romania (%)
Place of birth for the foreign-born population - Russia (%)
Place of birth for the foreign-born population - Serbia (%)
Place of birth for the foreign-born population - Ukraine (%)
Place of birth for the foreign-born population - Other Eastern Europe (%)
Place of birth for the foreign-born population - China (%)
Place of birth for the foreign-born population - Hong Kong (%)
Place of birth for the foreign-born population - Taiwan (%)
Place of birth for the foreign-born population - Japan (%)
Place of birth for the foreign-born population - Korea (%)
Place of birth for the foreign-born population - Other Eastern Asia (%)
Place of birth for the foreign-born population - Afghanistan (%)
Place of birth for the foreign-born population - Bangladesh (%)
Place of birth for the foreign-born population - India (%)
Place of birth for the foreign-born population - Iran (%)
Place of birth for the foreign-born population - Kazakhstan (%)
Place of birth for the foreign-born population - Nepal (%)
Place of birth for the foreign-born population - Pakistan (%)
Place of birth for the foreign-born population - Sri Lanka (%)
Place of birth for the foreign-born population - Uzbekistan (%)
Place of birth for the foreign-born population - Other South Central Asia (%)
Place of birth for the foreign-born population - Burma (%)
Place of birth for the foreign-born population - Cambodia (%)
Place of birth for the foreign-born population - Indonesia (%)
Place of birth for the foreign-born population - Laos (%)
Place of birth for the foreign-born population - Malaysia (%)
Place of birth for the foreign-born population - Philippines (%)
Place of birth for the foreign-born population - Singapore (%)
Place of birth for the foreign-born population - Thailand (%)
Place of birth for the foreign-born population - Vietnam (%)
Place of birth for the foreign-born population - Other South Eastern Asia (%)
Place of birth for the foreign-born population - Armenia (%)
Place of birth for the foreign-born population - Iraq (%)
Place of birth for the foreign-born population - Israel (%)
Place of birth for the foreign-born population - Jordan (%)
Place of birth for the foreign-born population - Kuwait (%)
Place of birth for the foreign-born population - Lebanon (%)
Place of birth for the foreign-born population - Saudi Arabia (%)
Place of birth for the foreign-born population - Syria (%)
Place of birth for the foreign-born population - Turkey (%)
Place of birth for the foreign-born population - Yemen (%)
Place of birth for the foreign-born population - Other Western Asia (%)
Place of birth for the foreign-born population - Eritrea (%)
Place of birth for the foreign-born population - Ethiopia (%)
Place of birth for the foreign-born population - Kenya (%)
Place of birth for the foreign-born population - Somalia (%)
Place of birth for the foreign-born population - Uganda (%)
Place of birth for the foreign-born population - Zimbabwe (%)
Place of birth for the foreign-born population - Other Eastern Africa (%)
Place of birth for the foreign-born population - Cameroon (%)
Place of birth for the foreign-born population - Congo (%)
Place of birth for the foreign-born population - Democratic Republic of Congo (Zaire) (%)
Place of birth for the foreign-born population - Other Middle Africa (%)
Place of birth for the foreign-born population - Egypt (%)
Place of birth for the foreign-born population - Morocco (%)
Place of birth for the foreign-born population - Sudan (%)
Place of birth for the foreign-born population - Other Northern Africa (%)
Place of birth for the foreign-born population - South Africa (%)
Place of birth for the foreign-born population - Other Southern Africa (%)
Place of birth for the foreign-born population - Cabo Verde (%)
Place of birth for the foreign-born population - Ghana (%)
Place of birth for the foreign-born population - Liberia (%)
Place of birth for the foreign-born population - Nigeria (%)
Place of birth for the foreign-born population - Senegal (%)
Place of birth for the foreign-born population - Sierra Leone (%)
Place of birth for the foreign-born population - Other Western Africa (%)
Place of birth for the foreign-born population - Australia (%)
Place of birth for the foreign-born population - New Zealand (%)
Place of birth for the foreign-born population - Fiji (%)
Place of birth for the foreign-born population - Micronesia (%)
Place of birth for the foreign-born population - Bahamas (%)
Place of birth for the foreign-born population - Barbados (%)
Place of birth for the foreign-born population - Cuba (%)
Place of birth for the foreign-born population - Dominica (%)
Place of birth for the foreign-born population - Dominican Republic (%)
Place of birth for the foreign-born population - Grenada (%)
Place of birth for the foreign-born population - Haiti (%)
Place of birth for the foreign-born population - Jamaica (%)
Place of birth for the foreign-born population - St. Vincent and the Grenadines (%)
Place of birth for the foreign-born population - Trinidad and Tobago (%)
Place of birth for the foreign-born population - West Indies (%)
Place of birth for the foreign-born population - Other Caribbean (%)
Place of birth for the foreign-born population - Belize (%)
Place of birth for the foreign-born population - Costa Rica (%)
Place of birth for the foreign-born population - El Salvador (%)
Place of birth for the foreign-born population - Guatemala (%)
Place of birth for the foreign-born population - Honduras (%)
Place of birth for the foreign-born population - Mexico (%)
Place of birth for the foreign-born population - Nicaragua (%)
Place of birth for the foreign-born population - Panama (%)
Place of birth for the foreign-born population - Other Central America (%)
Place of birth for the foreign-born population - Argentina (%)
Place of birth for the foreign-born population - Bolivia (%)
Place of birth for the foreign-born population - Brazil (%)
Place of birth for the foreign-born population - Chile (%)
Place of birth for the foreign-born population - Colombia (%)
Place of birth for the foreign-born population - Ecuador (%)
Place of birth for the foreign-born population - Guyana (%)
Place of birth for the foreign-born population - Peru (%)
Place of birth for the foreign-born population - Uruguay (%)
Place of birth for the foreign-born population - Venezuela (%)
Place of birth for the foreign-born population - Other South America (%)
Place of birth for the foreign-born population - Canada (%)
Place of birth for the foreign-born population - Other Northern America (%)
Place of birth for the foreign-born population - Other (%)
Latest news about races in Washington, DC collected exclusively by city-data.com from local newspapers, TV, and radio stations
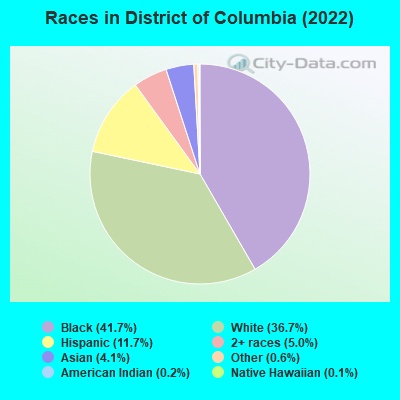
According to 2022 data, the most numerous races in Washington, DC are Black alone (279,809 residents), White alone (246,745 residents), and Hispanic (78,911 residents). 79.4% of Washington residents speak English at home. 13.7% of Washington, DC residents are foreign-born (5.6% born in Latin America, 2.9% born in Asia, 2.3% born in Africa, 2.2% born in Europe), which is about the same as the foreign-born rate of 13.4% across the entire state of District of Columbia.
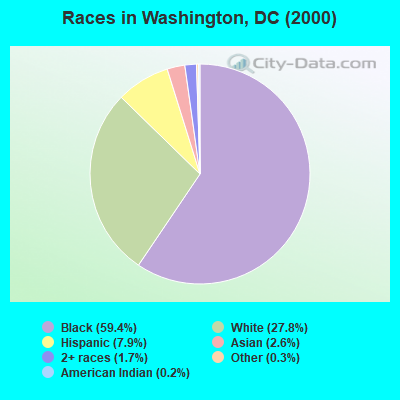
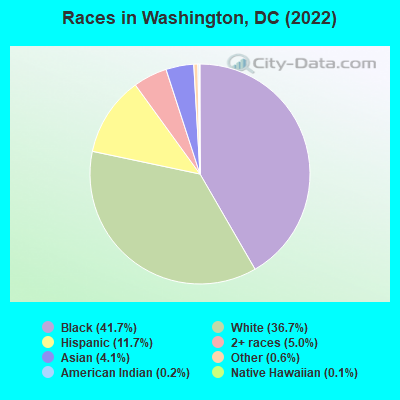
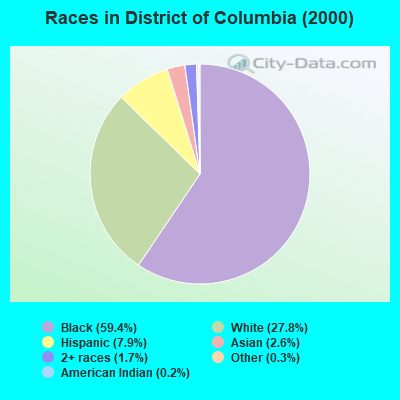
Race distribution in Washington
2000 2022
340,088 59.4% Black alone 159,178 27.8% White alone 44,953 7.9% Hispanic 15,039 2.6% Asian alone 9,584 1.7% Two or more races 1,670 0.3% Other race alone 1,274 0.2% American Indian alone 273 0.05% Native Hawaiian and Other
279,809 41.7% Black alone 246,745 36.7% White alone 78,911 11.7% Hispanic 33,544 5.0% Two or more races 27,250 4.1% Asian alone 3,823 0.6% Other race alone 1,012 0.2% American Indian alone 709 0.1% Native Hawaiian and Other
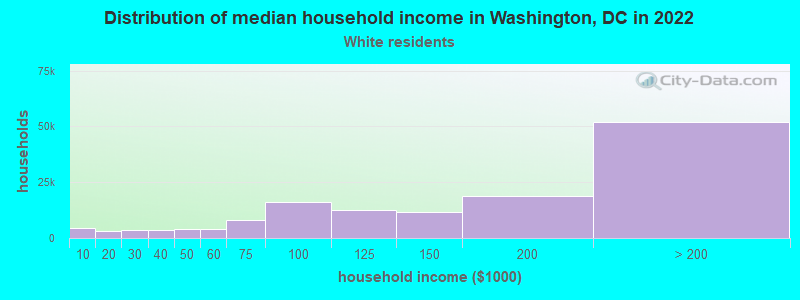
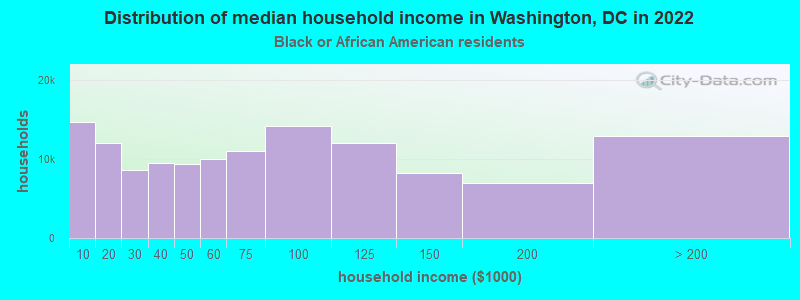
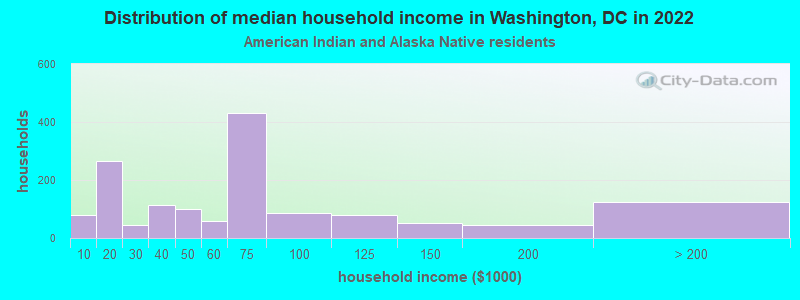
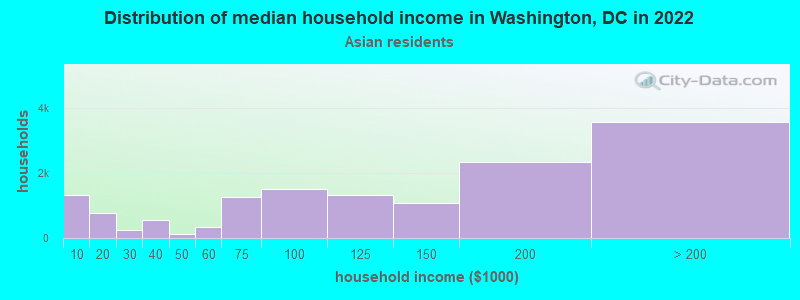
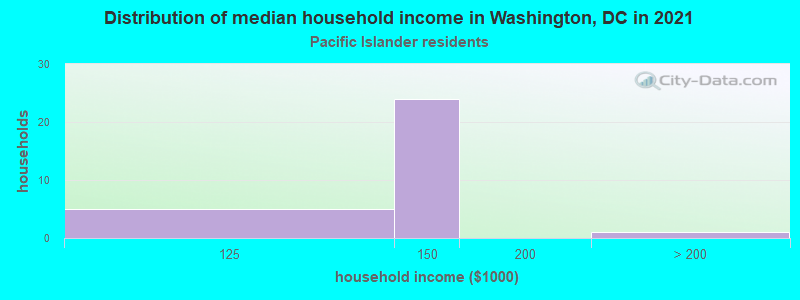
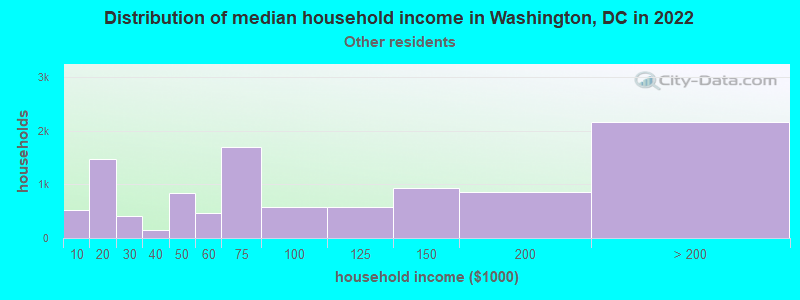
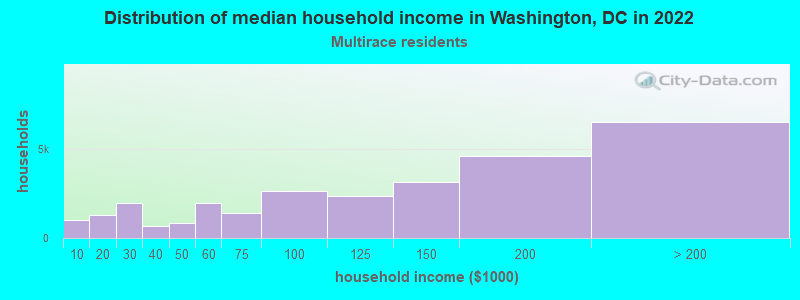
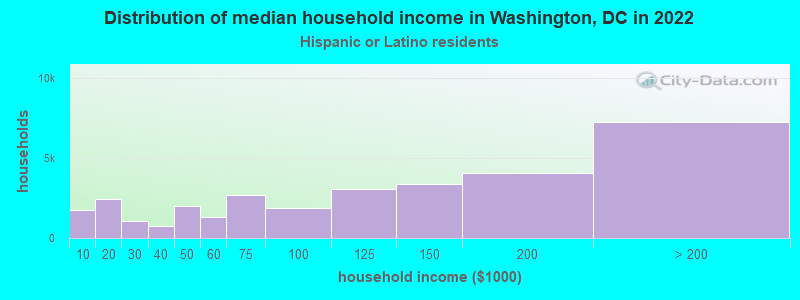
Income and house value in Washington Median household income in 2022 $151,084 White non-Hispanic householders$60,891 Black householders$39,075 American Indian and Alaska Native householders$119,607 Asian householders$73,921 Some other race householders$125,240 Two or more races householders$117,945 Hispanic or Latino race householdersMedian 2022 house value over $1,000,000 White Non-Hispanic householders$579,534 Black or African American householders$714,342 American Indian or Alaska Native householders over $1,000,000 Asian householdersover $1,000,000 Native Hawaiian and other Pacific Islander householders$668,943 Some other race householders$761,595 Two or more races householders$760,205 Hispanic or Latino householders
Median age by race in Washington
34.9 Median age for White residents35.9 34.0 37.0 Median age for Black or African American residents34.8 39.3 40.4 Median age for American Indian / Alaska Native residents40.4 45.2 34.4 Median age for Asian residents34.6 34.3 25.8 Median age for Native Hawaiian / Pacific Islander residents32.5 23.9 31.3 Median age for Other race residents30.3 31.9 31.1 Median age for Two or more races residents32.7 30.0 35.1 Median age for White alone residents36.1 34.1 31.8 Median age for Hispanic or Latino residents32.5 31.1
Owner/renter occupied households by race in Washington
House owners and renters - White residents 67,366 47.5% Owner occupied74,588 52.5% Renter occupiedHouse owners and renters - Black or African American residents 44,003 34.0% Owner occupied85,269 66.0% Renter occupiedHouse owners and renters - American Indian / Alaska Native residents 572 33.8% Owner occupied1,122 66.2% Renter occupiedHouse owners and renters - Asian residents 5,652 39.1% Owner occupied8,813 60.9% Renter occupiedHouse owners and renters - Native Hawaiian / Pacific Islander residents 61 65.2% Owner occupied32 34.8% Renter occupiedHouse owners and renters - Other race residents 3,769 35.3% Owner occupied6,895 64.7% Renter occupiedHouse owners and renters - Two or more races residents 12,566 44.1% Owner occupied15,897 55.9% Renter occupiedHouse owners and renters - White alone residents 64,517 47.5% Owner occupied71,343 52.5% Renter occupiedHouse owners and renters - Hispanic or Latino residents 13,817 43.8% Owner occupied17,724 56.2% Renter occupied
Language usage in Washington
English speakers - Total 79.4% of residents of Washington speak English at home.
9.4% of residents speak Spanish at home 44,974 75.3% Speak English very well14,759 24.7% Speak English less than very well11.1% of residents speak other language at home 52,903 75.0% Speak English very well17,617 25.0% Speak English less than very well
English speakers - Born in the United States 90.9% of residents of Washington speak English at home.
5.0% of residents speak Spanish at home 15,420 94.5% Speak English very well899 5.5% Speak English less than very well4.1% of residents speak other language at home 12,566 94.3% Speak English very well753 5.7% Speak English less than very well
English speakers - Native, born elsewhere 58.1% of residents of Washington speak English at home.
22.0% of residents speak Spanish at home 2,364 79.5% Speak English very well611 20.5% Speak English less than very well19.9% of residents speak other language at home 2,488 92.7% Speak English very well196 7.3% Speak English less than very well
English speakers - Foreign-born 21.4% of residents of Washington speak English at home.
29.0% of residents speak Spanish at home 17,046 59.3% Speak English very well11,702 40.7% Speak English less than very well49.6% of residents speak other language at home 32,729 66.6% Speak English very well16,436 33.4% Speak English less than very well
White (Caucasian) - Speak only English Native:
92.0% (203,635)Foreign-born:
36.0% (8,848)
White (Caucasian) - Speak another language Native:
8.0% (17,738)Foreign-born:
64.0% (15,698)
Black or African American - Speak only English Native:
96.9% (232,925)Foreign-born:
25.2% (6,695)
Black or African American - Speak another language Native:
3.1% (7,568)Foreign-born:
74.8% (19,922)
American Indian / Alaska Native - Speak only English Native:
74.8% (1,529)Foreign-born:
14.3% (127)
American Indian / Alaska Native - Speak another language Native:
25.2% (514)Foreign-born:
85.7% (764)
Asian - Speak only English Native:
57.5% (5,422)Foreign-born:
19.4% (3,430)
Asian - Speak another language Native:
42.5% (4,008)Foreign-born:
80.6% (14,287)
Native Hawaiian / Pacific Islander - Speak only English Native:
85.3% (272)Foreign-born:
54.3% (61)
Native Hawaiian / Pacific Islander - Speak another language Native:
14.5% (46)Foreign-born:
44.0% (50)
Other race - Speak only English Native:
32.3% (4,630)Foreign-born:
4.3% (595)
Other race - Speak another language Native:
67.7% (9,687)Foreign-born:
95.7% (13,223)
Two or more races - Speak only English Native:
72.0% (32,586)Foreign-born:
9.9% (1,541)
Two or more races - Speak another language Native:
28.0% (12,683)Foreign-born:
90.1% (13,969)
White alone - Speak only English Native:
92.8% (198,535)Foreign-born:
38.7% (8,392)
White alone - Speak another language Native:
7.2% (15,353)Foreign-born:
61.3% (13,290)
Hispanic or Latino - Speak only English Native:
45.5% (18,931)Foreign-born:
6.8% (2,076)
Hispanic or Latino - Speak another language Native:
54.5% (22,637)Foreign-born:
93.2% (28,360)
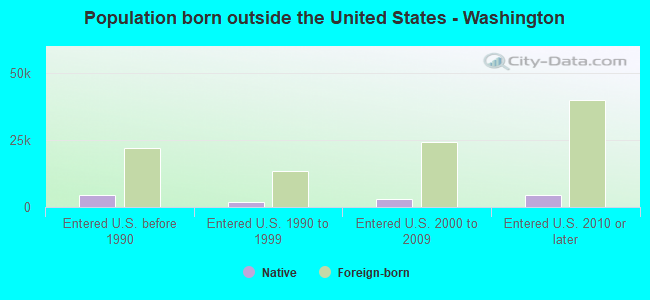
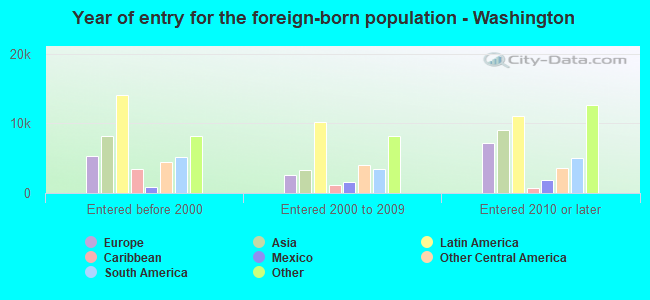
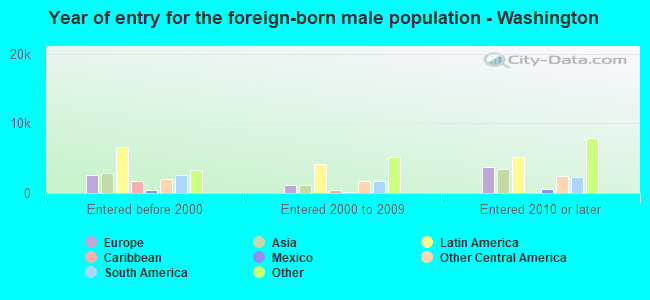
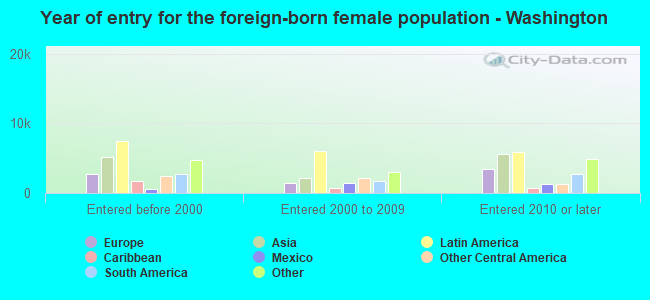
Foreign-born residents in Washington 91,889 residents are foreign born (5.6% Latin America , 2.9% Asia , 2.3% Africa , 2.2% Europe ).
This city:
13.7%District of Columbia:
13.4%
Marital status for residents in Washington Marital status - White (Caucasian) population 15 years and over
Males 51.1% Never married40.6% Now married0.8% Separated0.9% Widowed6.5% DivorcedFemales 54.0% Never married35.6% Now married0.4% Separated3.2% Widowed6.8% DivorcedWomen who gave birth in the past 12 months Now married:
100.0% (2,358)Unmarried:
0.0% (0)
Women who did not give birth in the past 12 months Now married:
30.8% (26,314)Unmarried:
69.2% (59,141)
Marital status - Black or African American population 15 years and over
Males 62.0% Never married23.0% Now married2.0% Separated3.2% Widowed9.7% DivorcedFemales 57.7% Never married18.2% Now married2.1% Separated8.2% Widowed13.9% DivorcedWomen who gave birth in the past 12 months Now married:
27.1% (1,005)Unmarried:
72.9% (2,697)
Women who did not give birth in the past 12 months Now married:
18.5% (13,010)Unmarried:
81.5% (57,457)
Marital status - American Indian / Alaska Native population 15 years and over
Males 53.0% Never married31.5% Now married7.6% Separated0.0% Widowed7.9% DivorcedFemales 20.6% Never married27.9% Now married5.3% Separated4.6% Widowed41.6% DivorcedWomen who gave birth in the past 12 months Now married:
100.0% (21)Unmarried:
0.0% (0)
Women who did not give birth in the past 12 months Now married:
58.4% (310)Unmarried:
41.6% (220)
Marital status - Asian population 15 years and over
Males 59.4% Never married35.4% Now married0.0% Separated0.6% Widowed4.7% DivorcedFemales 48.6% Never married37.0% Now married0.8% Separated6.2% Widowed7.5% DivorcedWomen who gave birth in the past 12 months Now married:
100.0% (166)Unmarried:
0.0% (0)
Women who did not give birth in the past 12 months Now married:
35.6% (4,377)Unmarried:
64.4% (7,933)
Marital status - Native Hawaiian / Pacific Islander population 15 years and over
Males 16.3% Never married22.9% Now married0.0% Separated0.0% Widowed60.8% DivorcedFemales 56.7% Never married27.7% Now married0.0% Separated9.2% Widowed6.3% DivorcedWomen who did not give birth in the past 12 months Now married:
22.1% (38)Unmarried:
77.9% (134)
Marital status - Other race population 15 years and over
Males 64.2% Never married27.5% Now married0.0% Separated0.7% Widowed7.6% DivorcedFemales 62.7% Never married25.6% Now married1.5% Separated1.1% Widowed9.1% DivorcedWomen who gave birth in the past 12 months Now married:
77.2% (681)Unmarried:
22.8% (201)
Women who did not give birth in the past 12 months Now married:
21.3% (1,741)Unmarried:
78.7% (6,435)
Marital status - Two or more races population 15 years and over
Males 56.2% Never married36.7% Now married0.3% Separated0.0% Widowed6.9% DivorcedFemales 48.8% Never married37.7% Now married1.6% Separated1.9% Widowed9.9% DivorcedWomen who gave birth in the past 12 months Now married:
52.3% (628)Unmarried:
47.7% (573)
Women who did not give birth in the past 12 months Now married:
38.1% (6,305)Unmarried:
61.9% (10,242)
Marital status - White alone, not Hispanic / Latino population 15 years and over
Males 50.5% Never married41.1% Now married0.8% Separated0.9% Widowed6.6% DivorcedFemales 53.5% Never married36.2% Now married0.4% Separated3.2% Widowed6.8% DivorcedWomen who gave birth in the past 12 months Now married:
100.0% (2,358)Unmarried:
0.0% (0)
Women who did not give birth in the past 12 months Now married:
31.4% (25,514)Unmarried:
68.6% (55,694)
Marital status - Hispanic or Latino population 15 years and over
Males 58.3% Never married34.8% Now married0.5% Separated0.3% Widowed6.3% DivorcedFemales 54.6% Never married32.0% Now married1.7% Separated2.7% Widowed9.1% DivorcedWomen who gave birth in the past 12 months Now married:
81.3% (876)Unmarried:
18.7% (201)
Women who did not give birth in the past 12 months Now married:
28.8% (6,068)Unmarried:
71.2% (14,987)
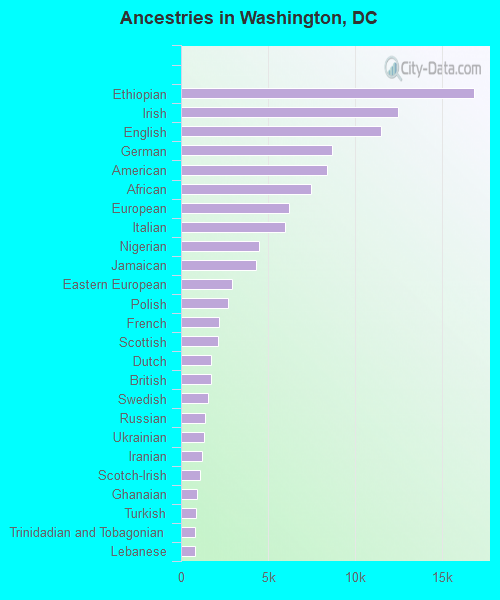
Ancestries in Washington
16,852 4.5% Ethiopian12,495 3.3% Irish11,502 3.1% English8,665 2.3% German8,411 2.2% American7,487 2.0% African6,218 1.7% European5,981 1.6% Italian4,503 1.2% Nigerian4,337 1.2% Jamaican2,937 0.8% Eastern European2,703 0.7% Polish2,211 0.6% French2,151 0.6% Scottish1,750 0.5% Dutch1,707 0.5% British1,543 0.4% Swedish1,388 0.4% Russian1,304 0.3% Ukrainian1,224 0.3% Iranian1,076 0.3% Scotch-Irish903 0.2% Ghanaian842 0.2% Turkish830 0.2% Trinidadian and Tobagonian812 0.2% Lebanese799 0.2% Haitian714 0.2% Hungarian626 0.2% Greek615 0.2% Norwegian602 0.2% Czech585 0.2% Scandinavian574 0.2% Arab553 0.1% West Indian535 0.1% Canadian506 0.1% Romanian485 0.1% Palestinian444 0.1% Lithuanian441 0.1% Kenyan401 0.1% Slovene392 0.1% Guyanese390 0.1% Slovak384 0.1% Brazilian383 0.1% Northern European376 0.10% Swiss362 0.10% British West Indian347 0.09% Egyptian317 0.08% Austrian310 0.08% French Canadian277 0.07% Portuguese266 0.07% South African260 0.07% Armenian251 0.07% Moroccan221 0.06% Danish213 0.06% Welsh206 0.05% Albanian201 0.05% Israeli195 0.05% Liberian162 0.04% Belizean159 0.04% Macedonian147 0.04% Serbian143 0.04% Afghan142 0.04% Croatian133 0.04% Ugandan130 0.03% Estonian127 0.03% Slavic122 0.03% Sierra Leonean110 0.03% Barbadian109 0.03% Australian93 0.02% Latvian88 0.02% Syrian83 0.02% Czechoslovakian75 0.02% Cypriot75 0.02% Finnish58 0.02% Bulgarian56 0.01% Pennsylvania German48 0.01% Cape Verdean35 0.01% Celtic21 0.01% Belgian
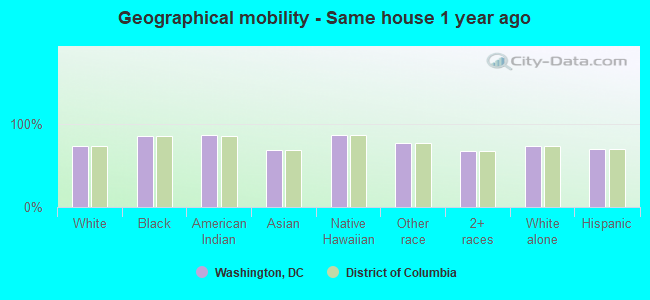
Geographical mobility in Washington Same house 1 year ago 188,444 73.8% White (Caucasian)238,267 85.7% Black or African American2,141 86.9% American Indian / Alaska Native18,909 68.1% Asian388 86.9% Native Hawaiian / Pacific Islander22,629 76.5% Other race44,679 67.2% Two or more races178,962 73.3% White alone, not Hispanic / Latino53,788 69.9% Hispanic or LatinoMoved within same county 27,582 10.8% White / Caucasian23,753 8.5% Black or African American87 3.5% American Indian / Alaska Native2,298 8.3% Asian36 8.1% Native Hawaiian / Pacific Islander3,561 12.0% Other race10,762 16.2% Two or more races26,610 10.9% White alone, not Hispanic / Latino12,172 15.8% Hispanic or LatinoMoved from different state 33,632 13.2% White / Caucasian14,851 5.3% Black or African American152 6.2% American Indian / Alaska Native4,119 14.8% Asian24 5.4% Native Hawaiian / Pacific Islander1,818 6.1% Other race9,396 14.1% Two or more races32,950 13.5% White alone, not Hispanic / Latino7,957 10.3% Hispanic or LatinoMoved from abroad 5,748 2.3% White994 0.4% Black or African American110 4.5% American Indian / Alaska Native2,437 8.8% Asian1,576 5.3% Other race1,644 2.5% Two or more races5,666 2.3% White alone, not Hispanic / Latino3,063 4.0% Hispanic or Latino
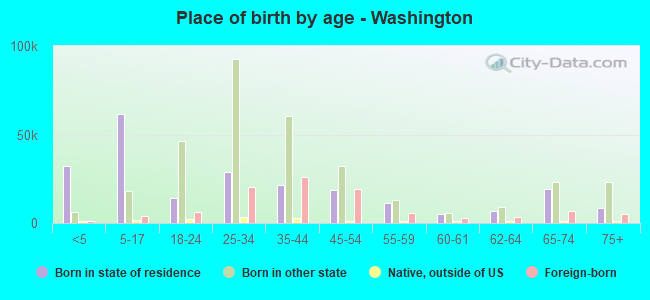
Children Nativity (place of birth) in Washington
Children under 6 years - Living with two parents Both parents native 17,813 100.0% NativeBoth parents foreign-born 3,525 85.0% Native624 15.0% Foreign-bornOne native, one foreign-born parent 3,497 95.4% Native167 4.6% Foreign-bornChildren under 6 years - Living with one parent Native parent 16,709 99.2% Native142 0.8% Foreign-bornForeign-born parent 2,728 97.3% Native77 2.7% Foreign-bornChildren 6 to 17 years - Living with two parents Both parents native 18,919 100.0% NativeBoth parents foreign-born 6,793 75.7% Native2,183 24.3% Foreign-bornOne native, one foreign-born parent 6,743 98.5% Native103 1.5% Foreign-bornChildren 6 to 17 years - Living with one parent Native parent 31,905 100.0% NativeForeign-born parent 6,898 51.8% Native6,426 48.2% Foreign-born
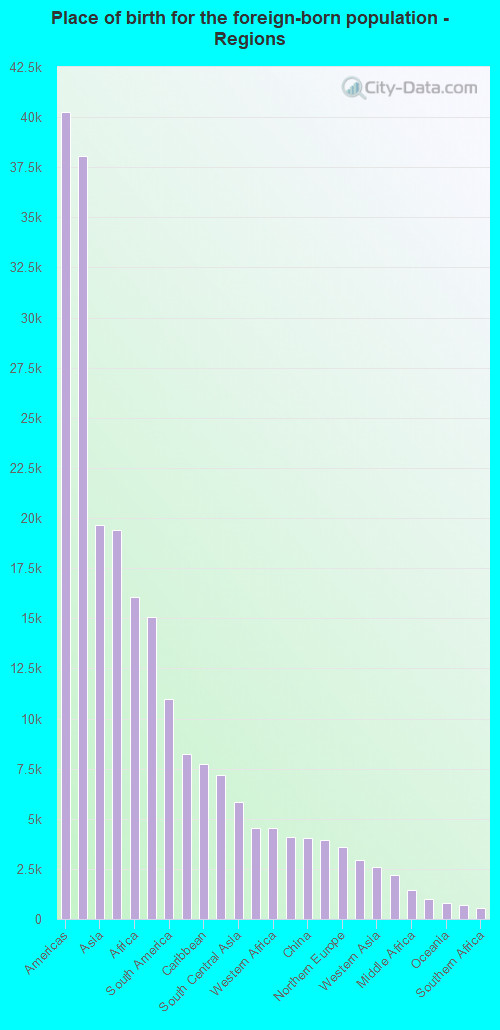
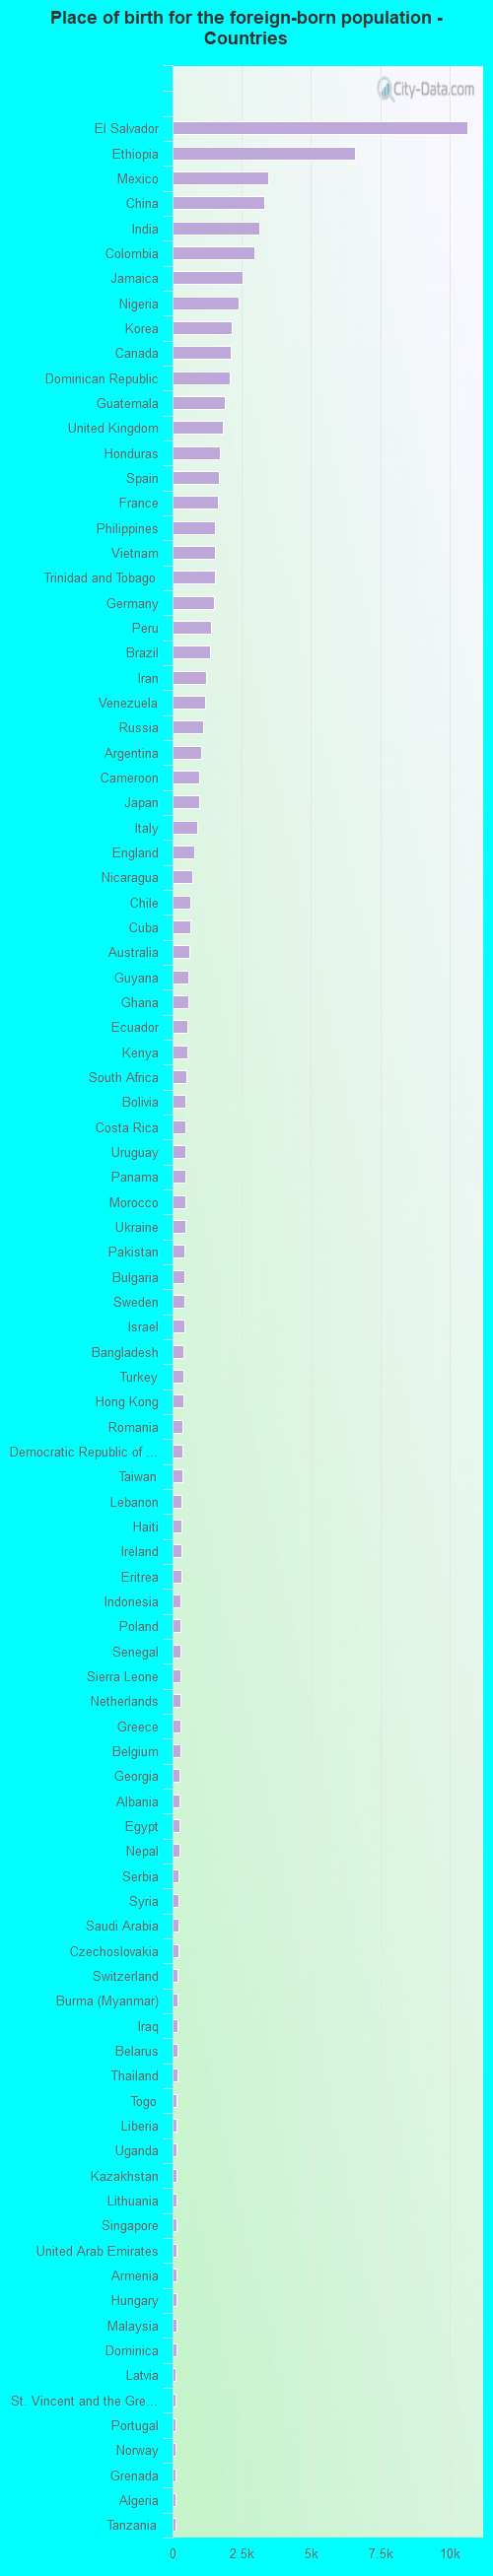
Place of birth for residents in Washington 40,275 Americas38,065 Latin America19,674 Asia19,384 Central America16,055 Africa15,074 Europe10,951 South America8,244 Eastern Africa7,729 Caribbean7,179 Eastern Asia5,824 South Central Asia4,556 Eastern Europe4,536 Western Africa4,069 South Eastern Asia4,053 China3,948 Western Europe3,597 Northern Europe2,958 Southern Europe2,596 Western Asia2,209 Northern America1,458 Middle Africa1,004 Northern Africa810 Oceania707 Australia and New Zealand Subregion561 Southern Africa10,654 El Salvador6,598 Ethiopia3,440 Mexico3,328 China3,149 India2,956 Colombia2,517 Jamaica2,378 Nigeria2,124 Korea2,118 Canada2,068 Dominican Republic1,888 Guatemala1,808 United Kingdom1,718 Honduras1,664 Spain1,644 France1,538 Philippines1,532 Vietnam1,523 Trinidad and Tobago1,494 Germany1,404 Peru1,350 Brazil1,222 Iran1,189 Venezuela1,096 Russia1,046 Argentina978 Cameroon971 Japan893 Italy777 England712 Nicaragua652 Chile647 Cuba615 Australia567 Guyana557 Ghana550 Ecuador525 Kenya501 South Africa470 Bolivia467 Costa Rica463 Uruguay451 Panama451 Morocco446 Ukraine421 Pakistan419 Bulgaria413 Sweden410 Israel388 Bangladesh385 Turkey383 Hong Kong368 Romania353 Democratic Republic of Congo (Zaire)340 Taiwan335 Lebanon311 Haiti308 Ireland304 Eritrea302 Indonesia297 Poland296 Senegal296 Sierra Leone295 Netherlands286 Greece269 Belgium267 Georgia263 Albania263 Egypt236 Nepal229 Serbia227 Syria219 Saudi Arabia209 Czechoslovakia191 Switzerland182 Burma (Myanmar)179 Iraq165 Belarus162 Thailand160 Togo159 Liberia158 Uganda155 Kazakhstan155 Lithuania154 Singapore147 United Arab Emirates141 Armenia136 Hungary132 Malaysia127 Dominica117 Latvia117 St. Vincent and the Grenadines114 Portugal113 Norway112 Grenada107 Algeria100 Tanzania93 Afghanistan92 Sudan92 New Zealand89 Croatia78 Uzbekistan78 Sri Lanka60 Kuwait59 Barbados54 Cambodia53 Austria52 Zimbabwe49 Belize45 Ivory Coast45 Azerbaijan44 Bahamas42 Jordan39 St. Lucia37 West Indies37 Scotland37 Somalia27 Denmark15 Congo12 Moldova10 Laos2 Cabo Verde
Grandparents responsible for own grandchildren in Washington
Grandparents (30 to 59 years) White / Caucasian 51 40.7% Responsible for grandchildren74 59.3% Not responsible for grandchildrenBlack or African American 534 35.7% Responsible for grandchildren963 64.3% Not responsible for grandchildrenAmerican Indian / Alaska Native 39 100.0% Not responsible for grandchildrenAsian 34 100.0% Not responsible for grandchildrenOther race 154 33.2% Responsible for grandchildren311 66.8% Not responsible for grandchildrenTwo or more races 215 74.9% Responsible for grandchildren72 25.1% Not responsible for grandchildrenWhite alone, not Hispanic / Latino 46 48.2% Responsible for grandchildren50 51.8% Not responsible for grandchildrenHispanic or Latino 249 43.3% Responsible for grandchildren326 56.7% Not responsible for grandchildrenGrandparents (60 years and over) White / Caucasian 76 14.8% Responsible for grandchildren440 85.2% Not responsible for grandchildrenBlack or African American 691 18.2% Responsible for grandchildren3,105 81.8% Not responsible for grandchildrenAmerican Indian / Alaska Native 12 100.0% Responsible for grandchildrenAsian 70 26.3% Responsible for grandchildren196 73.7% Not responsible for grandchildrenOther race 15 4.8% Responsible for grandchildren300 95.2% Not responsible for grandchildrenTwo or more races 281 100.0% Not responsible for grandchildrenWhite alone, not Hispanic / Latino 63 18.5% Responsible for grandchildren276 81.5% Not responsible for grandchildrenHispanic or Latino 45 6.2% Responsible for grandchildren687 93.8% Not responsible for grandchildren
Zip codes: 20001 , 20002 , 20003 , 20004 , 20005 , 20006 , 20007 , 20008 , 20009 , 20010 , 20011 , 20012 , 20015 , 20016 , 20017 , 20018 , 20019 , 20020 , 20024 , 20032 , 20036 , 20037 , 20045, 20052 , 20053, 20057 , 20064 , 20202, 20204, 20228, 20230, 20240, 20245, 20260, 20307 , 20317 , 20319 , 20373 , 20390 , 20405, 20418, 20427, 20506, 20510, 20520, 20535, 20540, 20551, 20553, 20560, 20565, 20566, 20593.