Races in Warren, Ohio (OH) Detailed Stats
Data:
Races - White alone (%)
Races - White alone (% change since 2000)
Races - Black alone (%)
Races - Black alone (% change since 2000)
Races - American Indian alone (%)
Races - American Indian alone (% change since 2000)
Races - Asian alone (%)
Races - Asian alone (% change since 2000)
Races - Hispanic (%)
Races - Hispanic (% change since 2000)
Races - Native Hawaiian and Other Pacific Islander alone (%)
Races - Native Hawaiian and Other Pacific Islander alone (% change since 2000)
Races - Two or more races(%)
Races - Two or more races(% change since 2000)
Races - Other race alone (%)
Races - Other race alone (% change since 2000)
Racial diversity
Place of birth - Born in state of residence (%)
Place of birth - Born in state of residence (%) - White
Place of birth - Born in state of residence (%) - Black or African American
Place of birth - Born in state of residence (%) - Asian
Place of birth - Born in state of residence (%) - Hispanic or Latino
Place of birth - Born in state of residence (%) - American Indian and Alaska Native
Place of birth - Born in state of residence (%) - Multirace
Place of birth - Born in state of residence (%) - Other Race
Place of birth - Born in other state (%)
Place of birth - Born in other state (%) - White
Place of birth - Born in other state (%) - Black or African American
Place of birth - Born in other state (%) - Asian
Place of birth - Born in other state (%) - Hispanic or Latino
Place of birth - Born in other state (%) - American Indian and Alaska Native
Place of birth - Born in other state (%) - Multirace
Place of birth - Born in other state (%) - Other Race
Place of birth - Native, outside of US (%)
Place of birth - Native, outside of US (%) - White
Place of birth - Native, outside of US (%) - Black or African American
Place of birth - Native, outside of US (%) - Asian
Place of birth - Native, outside of US (%) - Hispanic or Latino
Place of birth - Native, outside of US (%) - American Indian and Alaska Native
Place of birth - Native, outside of US (%) - Multirace
Place of birth - Native, outside of US (%) - Other Race
Place of birth - Foreign born (%)
Place of birth - Foreign born (%) - White
Place of birth - Foreign born (%) - Black or African American
Place of birth - Foreign born (%) - Asian
Place of birth - Foreign born (%) - Hispanic or Latino
Place of birth - Foreign born (%) - American Indian and Alaska Native
Place of birth - Foreign born (%) - Multirace
Place of birth - Foreign born (%) - Other Race
Residents speaking English at home (%)
Residents speaking English at home - Born in the United States (%)
Residents speaking English at home - Native, born elsewhere (%)
Residents speaking English at home - Foreign born (%)
Residents speaking Spanish at home (%)
Residents speaking Spanish at home - Born in the United States (%)
Residents speaking Spanish at home - Native, born elsewhere (%)
Residents speaking Spanish at home - Foreign born (%)
Residents speaking other language at home (%)
Residents speaking other language at home - Born in the United States (%)
Residents speaking other language at home - Native, born elsewhere (%)
Residents speaking other language at home - Foreign born (%)
Marital status - Never married (%)
Marital status - Now married (%)
Marital status - Separated (%)
Marital status - Widowed (%)
Marital status - Divorced (%)
Ancestries Reported - Arab (%)
Ancestries Reported - Czech (%)
Ancestries Reported - Danish (%)
Ancestries Reported - Dutch (%)
Ancestries Reported - English (%)
Ancestries Reported - French (%)
Ancestries Reported - French Canadian (%)
Ancestries Reported - German (%)
Ancestries Reported - Greek (%)
Ancestries Reported - Hungarian (%)
Ancestries Reported - Irish (%)
Ancestries Reported - Italian (%)
Ancestries Reported - Lithuanian (%)
Ancestries Reported - Norwegian (%)
Ancestries Reported - Polish (%)
Ancestries Reported - Portuguese (%)
Ancestries Reported - Russian (%)
Ancestries Reported - Scotch-Irish (%)
Ancestries Reported - Scottish (%)
Ancestries Reported - Slovak (%)
Ancestries Reported - Subsaharan African (%)
Ancestries Reported - Swedish (%)
Ancestries Reported - Swiss (%)
Ancestries Reported - Ukrainian (%)
Ancestries Reported - United States (%)
Ancestries Reported - Welsh (%)
Ancestries Reported - West Indian (%)
Ancestries Reported - Other (%)
Geographical mobility - Same house 1 year ago (%)
Geographical mobility - Same house 1 year ago (%) - White
Geographical mobility - Same house 1 year ago (%) - Black or African American
Geographical mobility - Same house 1 year ago (%) - Asian
Geographical mobility - Same house 1 year ago (%) - Hispanic or Latino
Geographical mobility - Same house 1 year ago (%) - American Indian and Alaska Native
Geographical mobility - Same house 1 year ago (%) - Multirace
Geographical mobility - Same house 1 year ago (%) - Other Race
Geographical mobility - Moved within same county (%)
Geographical mobility - Moved within same county (%) - White
Geographical mobility - Moved within same county (%) - Black or African American
Geographical mobility - Moved within same county (%) - Asian
Geographical mobility - Moved within same county (%) - Hispanic or Latino
Geographical mobility - Moved within same county (%) - American Indian and Alaska Native
Geographical mobility - Moved within same county (%) - Multirace
Geographical mobility - Moved within same county (%) - Other Race
Geographical mobility - Moved from different county within same state (%)
Geographical mobility - Moved from different county within same state (%) - White
Geographical mobility - Moved from different county within same state (%) - Black or African American
Geographical mobility - Moved from different county within same state (%) - Asian
Geographical mobility - Moved from different county within same state (%) - Hispanic or Latino
Geographical mobility - Moved from different county within same state (%) - American Indian and Alaska Native
Geographical mobility - Moved from different county within same state (%) - Multirace
Geographical mobility - Moved from different county within same state (%) - Other Race
Geographical mobility - Moved from different state (%)
Geographical mobility - Moved from different state (%) - White
Geographical mobility - Moved from different state (%) - Black or African American
Geographical mobility - Moved from different state (%) - Asian
Geographical mobility - Moved from different state (%) - Hispanic or Latino
Geographical mobility - Moved from different state (%) - American Indian and Alaska Native
Geographical mobility - Moved from different state (%) - Multirace
Geographical mobility - Moved from different state (%) - Other Race
Geographical mobility - Moved from abroad (%)
Geographical mobility - Moved from abroad (%) - White
Geographical mobility - Moved from abroad (%) - Black or African American
Geographical mobility - Moved from abroad (%) - Asian
Geographical mobility - Moved from abroad (%) - Hispanic or Latino
Geographical mobility - Moved from abroad (%) - American Indian and Alaska Native
Geographical mobility - Moved from abroad (%) - Multirace
Geographical mobility - Moved from abroad (%) - Other Race
Place of birth for the foreign-born population - Ireland (%)
Place of birth for the foreign-born population - Denmark (%)
Place of birth for the foreign-born population - Norway (%)
Place of birth for the foreign-born population - Sweden (%)
Place of birth for the foreign-born population - United Kingdom (%)
Place of birth for the foreign-born population - England (%)
Place of birth for the foreign-born population - Scotland (%)
Place of birth for the foreign-born population - Other Northern Europe (%)
Place of birth for the foreign-born population - Austria (%)
Place of birth for the foreign-born population - Belgium (%)
Place of birth for the foreign-born population - France (%)
Place of birth for the foreign-born population - Germany (%)
Place of birth for the foreign-born population - Netherlands (%)
Place of birth for the foreign-born population - Switzerland (%)
Place of birth for the foreign-born population - Other Western Europe (%)
Place of birth for the foreign-born population - Greece (%)
Place of birth for the foreign-born population - Italy (%)
Place of birth for the foreign-born population - Portugal (%)
Place of birth for the foreign-born population - Spain (%)
Place of birth for the foreign-born population - Other Southern Europe (%)
Place of birth for the foreign-born population - Albania (%)
Place of birth for the foreign-born population - Belarus (%)
Place of birth for the foreign-born population - Bosnia and Herzegovina (%)
Place of birth for the foreign-born population - Bulgaria (%)
Place of birth for the foreign-born population - Croatia (%)
Place of birth for the foreign-born population - Czechoslovakia (%)
Place of birth for the foreign-born population - Hungary (%)
Place of birth for the foreign-born population - Latvia (%)
Place of birth for the foreign-born population - Lithuania (%)
Place of birth for the foreign-born population - North Macedonia (Macedonia) (%)
Place of birth for the foreign-born population - Moldova (%)
Place of birth for the foreign-born population - Poland (%)
Place of birth for the foreign-born population - Romania (%)
Place of birth for the foreign-born population - Russia (%)
Place of birth for the foreign-born population - Serbia (%)
Place of birth for the foreign-born population - Ukraine (%)
Place of birth for the foreign-born population - Other Eastern Europe (%)
Place of birth for the foreign-born population - China (%)
Place of birth for the foreign-born population - Hong Kong (%)
Place of birth for the foreign-born population - Taiwan (%)
Place of birth for the foreign-born population - Japan (%)
Place of birth for the foreign-born population - Korea (%)
Place of birth for the foreign-born population - Other Eastern Asia (%)
Place of birth for the foreign-born population - Afghanistan (%)
Place of birth for the foreign-born population - Bangladesh (%)
Place of birth for the foreign-born population - India (%)
Place of birth for the foreign-born population - Iran (%)
Place of birth for the foreign-born population - Kazakhstan (%)
Place of birth for the foreign-born population - Nepal (%)
Place of birth for the foreign-born population - Pakistan (%)
Place of birth for the foreign-born population - Sri Lanka (%)
Place of birth for the foreign-born population - Uzbekistan (%)
Place of birth for the foreign-born population - Other South Central Asia (%)
Place of birth for the foreign-born population - Burma (%)
Place of birth for the foreign-born population - Cambodia (%)
Place of birth for the foreign-born population - Indonesia (%)
Place of birth for the foreign-born population - Laos (%)
Place of birth for the foreign-born population - Malaysia (%)
Place of birth for the foreign-born population - Philippines (%)
Place of birth for the foreign-born population - Singapore (%)
Place of birth for the foreign-born population - Thailand (%)
Place of birth for the foreign-born population - Vietnam (%)
Place of birth for the foreign-born population - Other South Eastern Asia (%)
Place of birth for the foreign-born population - Armenia (%)
Place of birth for the foreign-born population - Iraq (%)
Place of birth for the foreign-born population - Israel (%)
Place of birth for the foreign-born population - Jordan (%)
Place of birth for the foreign-born population - Kuwait (%)
Place of birth for the foreign-born population - Lebanon (%)
Place of birth for the foreign-born population - Saudi Arabia (%)
Place of birth for the foreign-born population - Syria (%)
Place of birth for the foreign-born population - Turkey (%)
Place of birth for the foreign-born population - Yemen (%)
Place of birth for the foreign-born population - Other Western Asia (%)
Place of birth for the foreign-born population - Eritrea (%)
Place of birth for the foreign-born population - Ethiopia (%)
Place of birth for the foreign-born population - Kenya (%)
Place of birth for the foreign-born population - Somalia (%)
Place of birth for the foreign-born population - Uganda (%)
Place of birth for the foreign-born population - Zimbabwe (%)
Place of birth for the foreign-born population - Other Eastern Africa (%)
Place of birth for the foreign-born population - Cameroon (%)
Place of birth for the foreign-born population - Congo (%)
Place of birth for the foreign-born population - Democratic Republic of Congo (Zaire) (%)
Place of birth for the foreign-born population - Other Middle Africa (%)
Place of birth for the foreign-born population - Egypt (%)
Place of birth for the foreign-born population - Morocco (%)
Place of birth for the foreign-born population - Sudan (%)
Place of birth for the foreign-born population - Other Northern Africa (%)
Place of birth for the foreign-born population - South Africa (%)
Place of birth for the foreign-born population - Other Southern Africa (%)
Place of birth for the foreign-born population - Cabo Verde (%)
Place of birth for the foreign-born population - Ghana (%)
Place of birth for the foreign-born population - Liberia (%)
Place of birth for the foreign-born population - Nigeria (%)
Place of birth for the foreign-born population - Senegal (%)
Place of birth for the foreign-born population - Sierra Leone (%)
Place of birth for the foreign-born population - Other Western Africa (%)
Place of birth for the foreign-born population - Australia (%)
Place of birth for the foreign-born population - New Zealand (%)
Place of birth for the foreign-born population - Fiji (%)
Place of birth for the foreign-born population - Micronesia (%)
Place of birth for the foreign-born population - Bahamas (%)
Place of birth for the foreign-born population - Barbados (%)
Place of birth for the foreign-born population - Cuba (%)
Place of birth for the foreign-born population - Dominica (%)
Place of birth for the foreign-born population - Dominican Republic (%)
Place of birth for the foreign-born population - Grenada (%)
Place of birth for the foreign-born population - Haiti (%)
Place of birth for the foreign-born population - Jamaica (%)
Place of birth for the foreign-born population - St. Vincent and the Grenadines (%)
Place of birth for the foreign-born population - Trinidad and Tobago (%)
Place of birth for the foreign-born population - West Indies (%)
Place of birth for the foreign-born population - Other Caribbean (%)
Place of birth for the foreign-born population - Belize (%)
Place of birth for the foreign-born population - Costa Rica (%)
Place of birth for the foreign-born population - El Salvador (%)
Place of birth for the foreign-born population - Guatemala (%)
Place of birth for the foreign-born population - Honduras (%)
Place of birth for the foreign-born population - Mexico (%)
Place of birth for the foreign-born population - Nicaragua (%)
Place of birth for the foreign-born population - Panama (%)
Place of birth for the foreign-born population - Other Central America (%)
Place of birth for the foreign-born population - Argentina (%)
Place of birth for the foreign-born population - Bolivia (%)
Place of birth for the foreign-born population - Brazil (%)
Place of birth for the foreign-born population - Chile (%)
Place of birth for the foreign-born population - Colombia (%)
Place of birth for the foreign-born population - Ecuador (%)
Place of birth for the foreign-born population - Guyana (%)
Place of birth for the foreign-born population - Peru (%)
Place of birth for the foreign-born population - Uruguay (%)
Place of birth for the foreign-born population - Venezuela (%)
Place of birth for the foreign-born population - Other South America (%)
Place of birth for the foreign-born population - Canada (%)
Place of birth for the foreign-born population - Other Northern America (%)
Place of birth for the foreign-born population - Other (%)
Latest news about races in Warren, OH collected exclusively by city-data.com from local newspapers, TV, and radio stations
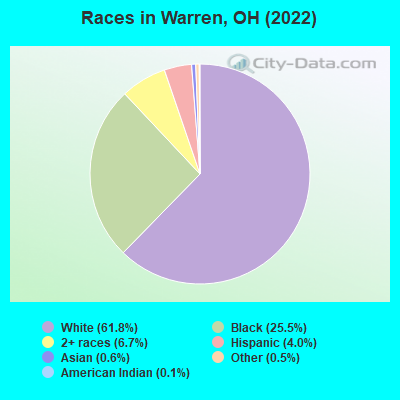
According to 2022 data, the most numerous races in Warren, OH are White alone (24,081 residents), Black alone (9,958 residents), and Two or more races (2,616 residents). 95.7% of Warren residents speak English at home. 1.4% of Warren, OH residents are foreign-born , which is 192.6% less than the foreign-born rate of 4.0% across the entire state of Ohio.
Race distribution in Warren
2000 2022
9,538,111 84.0% White alone 1,290,662 11.4% Black alone 217,123 1.9% Hispanic 137,770 1.2% Two or more races 131,670 1.2% Asian alone 21,985 0.2% American Indian alone 13,483 0.1% Other race alone 2,336 0.02% Native Hawaiian and Other
8,948,793 76.1% White alone 1,401,403 11.9% Black alone 529,291 4.5% Two or more races 517,232 4.4% Hispanic 293,387 2.5% Asian alone 52,805 0.4% Other race alone 9,785 0.08% American Indian alone 3,362 0.03% Native Hawaiian and Other
Income and house value in Warren Median household income in 2022 $36,169 White non-Hispanic householders$34,667 Black householders$13,693 American Indian and Alaska Native householders$20,697 Two or more races householdersMedian 2022 house value $81,372 White Non-Hispanic householders$62,269 Black or African American householders$85,590 American Indian or Alaska Native householders $186,065 Asian householders$79,760 Two or more races householders$73,185 Hispanic or Latino householders
Median age by race in Warren
43.6 Median age for White residents42.5 45.6 31.8 Median age for Black or African American residents30.1 39.5 79.3 Median age for American Indian / Alaska Native residents-685,185,184.5 -658,163,264.6 19.6 Median age for Asian residents-771,622,934.1 18.7 -800,387,596.1 Median age for Native Hawaiian / Pacific Islander residents-666,666,666.0 -805,394,989.6 38.2 Median age for Other race residents44.0 9.2 24.0 Median age for Two or more races residents21.8 34.9 44.3 Median age for White alone residents42.9 46.4 26.3 Median age for Hispanic or Latino residents24.8 46.9
Owner/renter occupied households by race in Warren
House owners and renters - White residents 6,887 59.6% Owner occupied4,669 40.4% Renter occupiedHouse owners and renters - Black or African American residents 1,382 39.3% Owner occupied2,137 60.7% Renter occupiedHouse owners and renters - American Indian / Alaska Native residents 41 100.0% Owner occupiedHouse owners and renters - Asian residents 16 32.3% Owner occupied34 67.7% Renter occupiedHouse owners and renters - Other race residents 38 47.5% Owner occupied42 52.5% Renter occupiedHouse owners and renters - Two or more races residents 400 42.3% Owner occupied546 57.7% Renter occupiedHouse owners and renters - White alone residents 6,749 59.1% Owner occupied4,669 40.9% Renter occupiedHouse owners and renters - Hispanic or Latino residents 274 57.6% Owner occupied202 42.4% Renter occupied
Language usage in Warren
English speakers - Total 95.7% of residents of Warren speak English at home.
1.2% of residents speak Spanish at home 188 42.0% Speak English very well260 58.0% Speak English less than very well2.8% of residents speak other language at home 650 62.9% Speak English very well384 37.1% Speak English less than very well
English speakers - Born in the United States 96.6% of residents of Warren speak English at home.
2.9% of residents speak Spanish at home 133 55.4% Speak English very well107 44.6% Speak English less than very well0.5% of residents speak other language at home 26 61.9% Speak English very well16 38.1% Speak English less than very well
English speakers - Native, born elsewhere 71.8% of residents of Warren speak English at home.
29.9% of residents speak Spanish at home 44 34.6% Speak English very well83 65.4% Speak English less than very well4.9% of residents speak other language at home 11 52.4% Speak English very well10 47.6% Speak English less than very well
English speakers - Foreign-born 7.5% of residents of Warren speak English at home.
26.2% of residents speak Spanish at home 26 23.9% Speak English very well83 76.1% Speak English less than very well72.4% of residents speak other language at home 227 75.4% Speak English very well74 24.6% Speak English less than very well
White (Caucasian) - Speak only English Native:
96.8% (22,389)Foreign-born:
5.1% (8)
White (Caucasian) - Speak another language Native:
2.7% (627)Foreign-born:
81.2% (126)
Black or African American - Speak only English Native:
99.7% (9,803)Foreign-born:
29.5% (17)
Black or African American - Speak another language Native:
0.1% (8)Foreign-born:
70.8% (42)
Asian - Speak only English Native:
95.9% (102)Foreign-born:
6.8% (11)
Asian - Speak another language Native:
6.7% (7)Foreign-born:
93.9% (146)
Other race - Speak another language Native:
17.0% (51)Foreign-born:
100.0% (32)
Two or more races - Speak another language Native:
14.5% (446)Foreign-born:
92.0% (138)
White alone - Speak only English Native:
96.6% (21,891)Foreign-born:
4.9% (9)
White alone - Speak another language Native:
2.8% (637)Foreign-born:
82.8% (145)
Hispanic or Latino - Speak another language Native:
25.9% (316)Foreign-born:
100.0% (84)
Foreign-born residents in Warren 533 residents are foreign born
Marital status for residents in Warren Marital status - White (Caucasian) population 15 years and over
Males 38.6% Never married34.2% Now married2.6% Separated6.9% Widowed17.6% DivorcedFemales 33.1% Never married31.7% Now married2.8% Separated12.0% Widowed20.4% DivorcedWomen who gave birth in the past 12 months Now married:
34.9% (128)Unmarried:
65.1% (240)
Women who did not give birth in the past 12 months Now married:
31.4% (1,572)Unmarried:
68.6% (3,431)
Marital status - Black or African American population 15 years and over
Males 64.2% Never married18.3% Now married4.6% Separated2.8% Widowed10.1% DivorcedFemales 56.7% Never married18.1% Now married1.8% Separated7.0% Widowed16.3% DivorcedWomen who gave birth in the past 12 months Now married:
8.9% (5)Unmarried:
91.1% (50)
Women who did not give birth in the past 12 months Now married:
17.1% (449)Unmarried:
82.9% (2,172)
Marital status - American Indian / Alaska Native population 15 years and over
Males 0.0% Never married0.0% Now married100.0% Separated0.0% Widowed0.0% DivorcedFemales 0.0% Never married21.2% Now married0.0% Separated78.8% Widowed0.0% DivorcedMarital status - Asian population 15 years and over
Males 0.0% Never married100.0% Now married0.0% Separated0.0% Widowed0.0% DivorcedFemales 76.4% Never married11.5% Now married0.0% Separated12.1% Widowed0.0% DivorcedWomen who did not give birth in the past 12 months Now married:
5.5% (7)Unmarried:
94.5% (120)
Marital status - Other race population 15 years and over
Males 50.2% Never married40.3% Now married0.0% Separated0.0% Widowed9.5% DivorcedFemales 0.0% Never married100.0% Now married0.0% Separated0.0% Widowed0.0% DivorcedWomen who gave birth in the past 12 months Now married:
100.0% (8)Unmarried:
0.0% (0)
Women who did not give birth in the past 12 months Now married:
100.0% (13)Unmarried:
0.0% (0)
Marital status - Two or more races population 15 years and over
Males 67.1% Never married20.7% Now married3.4% Separated0.1% Widowed8.7% DivorcedFemales 48.2% Never married24.0% Now married3.6% Separated10.9% Widowed13.3% DivorcedWomen who gave birth in the past 12 months Now married:
0.0% (0)Unmarried:
100.0% (11)
Women who did not give birth in the past 12 months Now married:
15.0% (79)Unmarried:
85.0% (446)
Marital status - White alone, not Hispanic / Latino population 15 years and over
Males 37.9% Never married34.5% Now married2.7% Separated7.1% Widowed17.8% DivorcedFemales 31.9% Never married32.2% Now married2.9% Separated12.1% Widowed20.9% DivorcedWomen who gave birth in the past 12 months Now married:
34.9% (131)Unmarried:
65.1% (244)
Women who did not give birth in the past 12 months Now married:
33.0% (1,599)Unmarried:
67.0% (3,252)
Marital status - Hispanic or Latino population 15 years and over
Males 54.1% Never married35.0% Now married0.0% Separated0.0% Widowed10.9% DivorcedFemales 54.8% Never married34.1% Now married3.7% Separated5.2% Widowed2.3% DivorcedWomen who gave birth in the past 12 months Now married:
100.0% (6)Unmarried:
0.0% (0)
Women who did not give birth in the past 12 months Now married:
17.7% (60)Unmarried:
82.3% (281)
Ancestries in Warren
7,170 35.1% American929 4.5% Italian906 4.4% Irish583 2.9% German477 2.3% English393 1.9% Jamaican351 1.7% Greek221 1.1% Polish179 0.9% Slovak152 0.7% Scottish110 0.5% African89 0.4% Scotch-Irish81 0.4% European62 0.3% Iranian46 0.2% Nigerian41 0.2% Yugoslavian39 0.2% Hungarian36 0.2% Welsh34 0.2% Ukrainian33 0.2% Finnish29 0.1% Czechoslovakian28 0.1% Swedish27 0.1% Celtic22 0.1% Dutch19 0.09% Armenian19 0.09% French Canadian19 0.09% Romanian16 0.08% Pennsylvania German14 0.07% Palestinian12 0.06% French12 0.06% Serbian12 0.06% Slovene11 0.05% Belgian10 0.05% Slavic10 0.05% Norwegian10 0.05% Moroccan9 0.04% Scandinavian7 0.03% Egyptian6 0.03% Russian5 0.02% Eastern European
Geographical mobility in Warren Same house 1 year ago 21,505 88.2% White (Caucasian)9,144 90.7% Black or African American50 89.8% American Indian / Alaska Native265 87.6% Asian291 80.1% Other race2,838 91.2% Two or more races21,050 88.4% White alone, not Hispanic / Latino1,289 86.6% Hispanic or LatinoMoved within same county 1,334 5.5% White / Caucasian420 4.2% Black or African American40 13.3% Asian26 7.2% Other race180 5.8% Two or more races1,271 5.3% White alone, not Hispanic / Latino125 8.4% Hispanic or LatinoMoved within same state 576 2.4% White / Caucasian228 2.3% Black or African American10 2.7% Other race64 2.1% Two or more races580 2.4% White alone, not Hispanic / Latino29 1.9% Hispanic or LatinoMoved from different state 1,032 4.2% White / Caucasian85 0.8% Black or African American10 18.5% American Indian / Alaska Native23 6.3% Other race51 1.7% Two or more races969 4.1% White alone, not Hispanic / Latino19 1.3% Hispanic or LatinoMoved from abroad 21 0.1% White30 0.3% Black or African American15 4.2% Other race23 0.1% White alone, not Hispanic / Latino23 1.5% Hispanic or Latino
Children Nativity (place of birth) in Warren
Children under 6 years - Living with two parents Both parents native 897 100.0% NativeOne native, one foreign-born parent 65 100.0% NativeChildren under 6 years - Living with one parent Native parent 1,697 100.0% NativeChildren 6 to 17 years - Living with two parents Both parents native 1,365 92.9% Native105 7.1% Foreign-bornChildren 6 to 17 years - Living with one parent Native parent 3,234 100.0% Native
Grandparents responsible for own grandchildren in Warren
Grandparents (30 to 59 years) White / Caucasian 110 62.1% Responsible for grandchildren67 37.9% Not responsible for grandchildrenBlack or African American 23 16.2% Responsible for grandchildren121 83.8% Not responsible for grandchildrenOther race 11 100.0% Not responsible for grandchildrenTwo or more races 6 100.0% Not responsible for grandchildrenWhite alone, not Hispanic / Latino 109 61.9% Responsible for grandchildren67 38.1% Not responsible for grandchildrenHispanic or Latino 7 100.0% Not responsible for grandchildrenGrandparents (60 years and over) White / Caucasian 69 30.9% Responsible for grandchildren155 69.1% Not responsible for grandchildrenBlack or African American 12 24.5% Responsible for grandchildren36 75.5% Not responsible for grandchildrenOther race 5 100.0% Not responsible for grandchildrenTwo or more races 30 100.0% Not responsible for grandchildrenWhite alone, not Hispanic / Latino 69 34.1% Responsible for grandchildren134 65.9% Not responsible for grandchildrenHispanic or Latino 31 100.0% Not responsible for grandchildren