Races in Warr Acres, Oklahoma (OK) Detailed Stats
Data:
Races - White alone (%)
Races - White alone (% change since 2000)
Races - Black alone (%)
Races - Black alone (% change since 2000)
Races - American Indian alone (%)
Races - American Indian alone (% change since 2000)
Races - Asian alone (%)
Races - Asian alone (% change since 2000)
Races - Hispanic (%)
Races - Hispanic (% change since 2000)
Races - Native Hawaiian and Other Pacific Islander alone (%)
Races - Native Hawaiian and Other Pacific Islander alone (% change since 2000)
Races - Two or more races(%)
Races - Two or more races(% change since 2000)
Races - Other race alone (%)
Races - Other race alone (% change since 2000)
Racial diversity
Place of birth - Born in state of residence (%)
Place of birth - Born in state of residence (%) - White
Place of birth - Born in state of residence (%) - Black or African American
Place of birth - Born in state of residence (%) - Asian
Place of birth - Born in state of residence (%) - Hispanic or Latino
Place of birth - Born in state of residence (%) - American Indian and Alaska Native
Place of birth - Born in state of residence (%) - Multirace
Place of birth - Born in state of residence (%) - Other Race
Place of birth - Born in other state (%)
Place of birth - Born in other state (%) - White
Place of birth - Born in other state (%) - Black or African American
Place of birth - Born in other state (%) - Asian
Place of birth - Born in other state (%) - Hispanic or Latino
Place of birth - Born in other state (%) - American Indian and Alaska Native
Place of birth - Born in other state (%) - Multirace
Place of birth - Born in other state (%) - Other Race
Place of birth - Native, outside of US (%)
Place of birth - Native, outside of US (%) - White
Place of birth - Native, outside of US (%) - Black or African American
Place of birth - Native, outside of US (%) - Asian
Place of birth - Native, outside of US (%) - Hispanic or Latino
Place of birth - Native, outside of US (%) - American Indian and Alaska Native
Place of birth - Native, outside of US (%) - Multirace
Place of birth - Native, outside of US (%) - Other Race
Place of birth - Foreign born (%)
Place of birth - Foreign born (%) - White
Place of birth - Foreign born (%) - Black or African American
Place of birth - Foreign born (%) - Asian
Place of birth - Foreign born (%) - Hispanic or Latino
Place of birth - Foreign born (%) - American Indian and Alaska Native
Place of birth - Foreign born (%) - Multirace
Place of birth - Foreign born (%) - Other Race
Residents speaking English at home (%)
Residents speaking English at home - Born in the United States (%)
Residents speaking English at home - Native, born elsewhere (%)
Residents speaking English at home - Foreign born (%)
Residents speaking Spanish at home (%)
Residents speaking Spanish at home - Born in the United States (%)
Residents speaking Spanish at home - Native, born elsewhere (%)
Residents speaking Spanish at home - Foreign born (%)
Residents speaking other language at home (%)
Residents speaking other language at home - Born in the United States (%)
Residents speaking other language at home - Native, born elsewhere (%)
Residents speaking other language at home - Foreign born (%)
Marital status - Never married (%)
Marital status - Now married (%)
Marital status - Separated (%)
Marital status - Widowed (%)
Marital status - Divorced (%)
Ancestries Reported - Arab (%)
Ancestries Reported - Czech (%)
Ancestries Reported - Danish (%)
Ancestries Reported - Dutch (%)
Ancestries Reported - English (%)
Ancestries Reported - French (%)
Ancestries Reported - French Canadian (%)
Ancestries Reported - German (%)
Ancestries Reported - Greek (%)
Ancestries Reported - Hungarian (%)
Ancestries Reported - Irish (%)
Ancestries Reported - Italian (%)
Ancestries Reported - Lithuanian (%)
Ancestries Reported - Norwegian (%)
Ancestries Reported - Polish (%)
Ancestries Reported - Portuguese (%)
Ancestries Reported - Russian (%)
Ancestries Reported - Scotch-Irish (%)
Ancestries Reported - Scottish (%)
Ancestries Reported - Slovak (%)
Ancestries Reported - Subsaharan African (%)
Ancestries Reported - Swedish (%)
Ancestries Reported - Swiss (%)
Ancestries Reported - Ukrainian (%)
Ancestries Reported - United States (%)
Ancestries Reported - Welsh (%)
Ancestries Reported - West Indian (%)
Ancestries Reported - Other (%)
Geographical mobility - Same house 1 year ago (%)
Geographical mobility - Same house 1 year ago (%) - White
Geographical mobility - Same house 1 year ago (%) - Black or African American
Geographical mobility - Same house 1 year ago (%) - Asian
Geographical mobility - Same house 1 year ago (%) - Hispanic or Latino
Geographical mobility - Same house 1 year ago (%) - American Indian and Alaska Native
Geographical mobility - Same house 1 year ago (%) - Multirace
Geographical mobility - Same house 1 year ago (%) - Other Race
Geographical mobility - Moved within same county (%)
Geographical mobility - Moved within same county (%) - White
Geographical mobility - Moved within same county (%) - Black or African American
Geographical mobility - Moved within same county (%) - Asian
Geographical mobility - Moved within same county (%) - Hispanic or Latino
Geographical mobility - Moved within same county (%) - American Indian and Alaska Native
Geographical mobility - Moved within same county (%) - Multirace
Geographical mobility - Moved within same county (%) - Other Race
Geographical mobility - Moved from different county within same state (%)
Geographical mobility - Moved from different county within same state (%) - White
Geographical mobility - Moved from different county within same state (%) - Black or African American
Geographical mobility - Moved from different county within same state (%) - Asian
Geographical mobility - Moved from different county within same state (%) - Hispanic or Latino
Geographical mobility - Moved from different county within same state (%) - American Indian and Alaska Native
Geographical mobility - Moved from different county within same state (%) - Multirace
Geographical mobility - Moved from different county within same state (%) - Other Race
Geographical mobility - Moved from different state (%)
Geographical mobility - Moved from different state (%) - White
Geographical mobility - Moved from different state (%) - Black or African American
Geographical mobility - Moved from different state (%) - Asian
Geographical mobility - Moved from different state (%) - Hispanic or Latino
Geographical mobility - Moved from different state (%) - American Indian and Alaska Native
Geographical mobility - Moved from different state (%) - Multirace
Geographical mobility - Moved from different state (%) - Other Race
Geographical mobility - Moved from abroad (%)
Geographical mobility - Moved from abroad (%) - White
Geographical mobility - Moved from abroad (%) - Black or African American
Geographical mobility - Moved from abroad (%) - Asian
Geographical mobility - Moved from abroad (%) - Hispanic or Latino
Geographical mobility - Moved from abroad (%) - American Indian and Alaska Native
Geographical mobility - Moved from abroad (%) - Multirace
Geographical mobility - Moved from abroad (%) - Other Race
Place of birth for the foreign-born population - Ireland (%)
Place of birth for the foreign-born population - Denmark (%)
Place of birth for the foreign-born population - Norway (%)
Place of birth for the foreign-born population - Sweden (%)
Place of birth for the foreign-born population - United Kingdom (%)
Place of birth for the foreign-born population - England (%)
Place of birth for the foreign-born population - Scotland (%)
Place of birth for the foreign-born population - Other Northern Europe (%)
Place of birth for the foreign-born population - Austria (%)
Place of birth for the foreign-born population - Belgium (%)
Place of birth for the foreign-born population - France (%)
Place of birth for the foreign-born population - Germany (%)
Place of birth for the foreign-born population - Netherlands (%)
Place of birth for the foreign-born population - Switzerland (%)
Place of birth for the foreign-born population - Other Western Europe (%)
Place of birth for the foreign-born population - Greece (%)
Place of birth for the foreign-born population - Italy (%)
Place of birth for the foreign-born population - Portugal (%)
Place of birth for the foreign-born population - Spain (%)
Place of birth for the foreign-born population - Other Southern Europe (%)
Place of birth for the foreign-born population - Albania (%)
Place of birth for the foreign-born population - Belarus (%)
Place of birth for the foreign-born population - Bosnia and Herzegovina (%)
Place of birth for the foreign-born population - Bulgaria (%)
Place of birth for the foreign-born population - Croatia (%)
Place of birth for the foreign-born population - Czechoslovakia (%)
Place of birth for the foreign-born population - Hungary (%)
Place of birth for the foreign-born population - Latvia (%)
Place of birth for the foreign-born population - Lithuania (%)
Place of birth for the foreign-born population - North Macedonia (Macedonia) (%)
Place of birth for the foreign-born population - Moldova (%)
Place of birth for the foreign-born population - Poland (%)
Place of birth for the foreign-born population - Romania (%)
Place of birth for the foreign-born population - Russia (%)
Place of birth for the foreign-born population - Serbia (%)
Place of birth for the foreign-born population - Ukraine (%)
Place of birth for the foreign-born population - Other Eastern Europe (%)
Place of birth for the foreign-born population - China (%)
Place of birth for the foreign-born population - Hong Kong (%)
Place of birth for the foreign-born population - Taiwan (%)
Place of birth for the foreign-born population - Japan (%)
Place of birth for the foreign-born population - Korea (%)
Place of birth for the foreign-born population - Other Eastern Asia (%)
Place of birth for the foreign-born population - Afghanistan (%)
Place of birth for the foreign-born population - Bangladesh (%)
Place of birth for the foreign-born population - India (%)
Place of birth for the foreign-born population - Iran (%)
Place of birth for the foreign-born population - Kazakhstan (%)
Place of birth for the foreign-born population - Nepal (%)
Place of birth for the foreign-born population - Pakistan (%)
Place of birth for the foreign-born population - Sri Lanka (%)
Place of birth for the foreign-born population - Uzbekistan (%)
Place of birth for the foreign-born population - Other South Central Asia (%)
Place of birth for the foreign-born population - Burma (%)
Place of birth for the foreign-born population - Cambodia (%)
Place of birth for the foreign-born population - Indonesia (%)
Place of birth for the foreign-born population - Laos (%)
Place of birth for the foreign-born population - Malaysia (%)
Place of birth for the foreign-born population - Philippines (%)
Place of birth for the foreign-born population - Singapore (%)
Place of birth for the foreign-born population - Thailand (%)
Place of birth for the foreign-born population - Vietnam (%)
Place of birth for the foreign-born population - Other South Eastern Asia (%)
Place of birth for the foreign-born population - Armenia (%)
Place of birth for the foreign-born population - Iraq (%)
Place of birth for the foreign-born population - Israel (%)
Place of birth for the foreign-born population - Jordan (%)
Place of birth for the foreign-born population - Kuwait (%)
Place of birth for the foreign-born population - Lebanon (%)
Place of birth for the foreign-born population - Saudi Arabia (%)
Place of birth for the foreign-born population - Syria (%)
Place of birth for the foreign-born population - Turkey (%)
Place of birth for the foreign-born population - Yemen (%)
Place of birth for the foreign-born population - Other Western Asia (%)
Place of birth for the foreign-born population - Eritrea (%)
Place of birth for the foreign-born population - Ethiopia (%)
Place of birth for the foreign-born population - Kenya (%)
Place of birth for the foreign-born population - Somalia (%)
Place of birth for the foreign-born population - Uganda (%)
Place of birth for the foreign-born population - Zimbabwe (%)
Place of birth for the foreign-born population - Other Eastern Africa (%)
Place of birth for the foreign-born population - Cameroon (%)
Place of birth for the foreign-born population - Congo (%)
Place of birth for the foreign-born population - Democratic Republic of Congo (Zaire) (%)
Place of birth for the foreign-born population - Other Middle Africa (%)
Place of birth for the foreign-born population - Egypt (%)
Place of birth for the foreign-born population - Morocco (%)
Place of birth for the foreign-born population - Sudan (%)
Place of birth for the foreign-born population - Other Northern Africa (%)
Place of birth for the foreign-born population - South Africa (%)
Place of birth for the foreign-born population - Other Southern Africa (%)
Place of birth for the foreign-born population - Cabo Verde (%)
Place of birth for the foreign-born population - Ghana (%)
Place of birth for the foreign-born population - Liberia (%)
Place of birth for the foreign-born population - Nigeria (%)
Place of birth for the foreign-born population - Senegal (%)
Place of birth for the foreign-born population - Sierra Leone (%)
Place of birth for the foreign-born population - Other Western Africa (%)
Place of birth for the foreign-born population - Australia (%)
Place of birth for the foreign-born population - New Zealand (%)
Place of birth for the foreign-born population - Fiji (%)
Place of birth for the foreign-born population - Micronesia (%)
Place of birth for the foreign-born population - Bahamas (%)
Place of birth for the foreign-born population - Barbados (%)
Place of birth for the foreign-born population - Cuba (%)
Place of birth for the foreign-born population - Dominica (%)
Place of birth for the foreign-born population - Dominican Republic (%)
Place of birth for the foreign-born population - Grenada (%)
Place of birth for the foreign-born population - Haiti (%)
Place of birth for the foreign-born population - Jamaica (%)
Place of birth for the foreign-born population - St. Vincent and the Grenadines (%)
Place of birth for the foreign-born population - Trinidad and Tobago (%)
Place of birth for the foreign-born population - West Indies (%)
Place of birth for the foreign-born population - Other Caribbean (%)
Place of birth for the foreign-born population - Belize (%)
Place of birth for the foreign-born population - Costa Rica (%)
Place of birth for the foreign-born population - El Salvador (%)
Place of birth for the foreign-born population - Guatemala (%)
Place of birth for the foreign-born population - Honduras (%)
Place of birth for the foreign-born population - Mexico (%)
Place of birth for the foreign-born population - Nicaragua (%)
Place of birth for the foreign-born population - Panama (%)
Place of birth for the foreign-born population - Other Central America (%)
Place of birth for the foreign-born population - Argentina (%)
Place of birth for the foreign-born population - Bolivia (%)
Place of birth for the foreign-born population - Brazil (%)
Place of birth for the foreign-born population - Chile (%)
Place of birth for the foreign-born population - Colombia (%)
Place of birth for the foreign-born population - Ecuador (%)
Place of birth for the foreign-born population - Guyana (%)
Place of birth for the foreign-born population - Peru (%)
Place of birth for the foreign-born population - Uruguay (%)
Place of birth for the foreign-born population - Venezuela (%)
Place of birth for the foreign-born population - Other South America (%)
Place of birth for the foreign-born population - Canada (%)
Place of birth for the foreign-born population - Other Northern America (%)
Place of birth for the foreign-born population - Other (%)
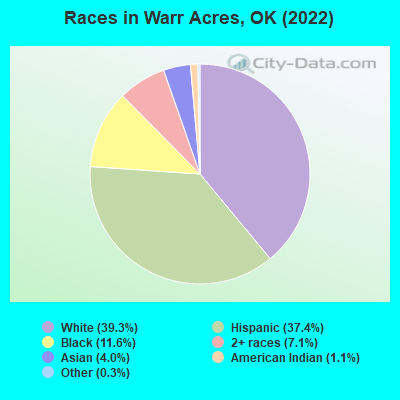
According to 2022 data, the most numerous races in Warr Acres, OK are White alone (4,128 residents), Hispanic (3,929 residents), and Two or more races (743 residents). 66.9% of Warr Acres residents speak English at home. 22.2% of Warr Acres, OK residents are foreign-born (17.3% born in Latin America, 4.1% born in Asia), which is 73.0% greater than the foreign-born rate of 6.0% across the entire state of Oklahoma.
Race distribution in Warr Acres
2000 2022
2,556,368 74.1% White alone 266,158 7.7% American Indian alone 257,981 7.5% Black alone 179,304 5.2% Hispanic 140,249 4.1% Two or more races 46,172 1.3% Asian alone 2,322 0.07% Other race alone 2,100 0.06% Native Hawaiian and Other
2,517,403 62.6% White alone 486,692 12.1% Hispanic 364,453 9.1% Two or more races 273,650 6.8% American Indian alone 268,543 6.7% Black alone 92,672 2.3% Asian alone 10,786 0.3% Other race alone 5,601 0.1% Native Hawaiian and Other
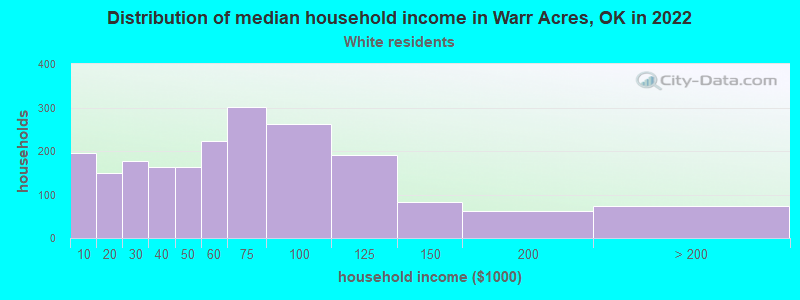
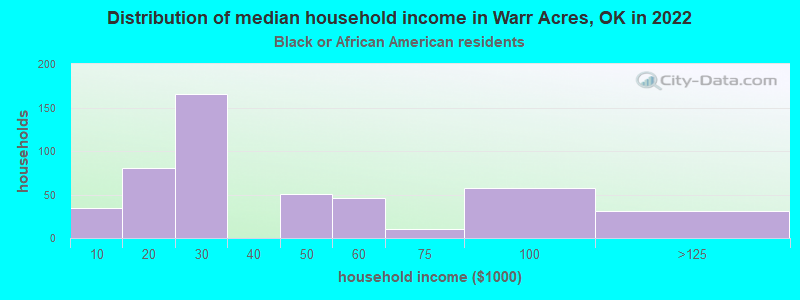
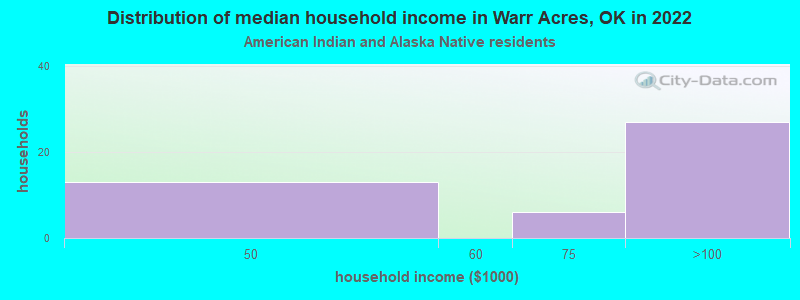
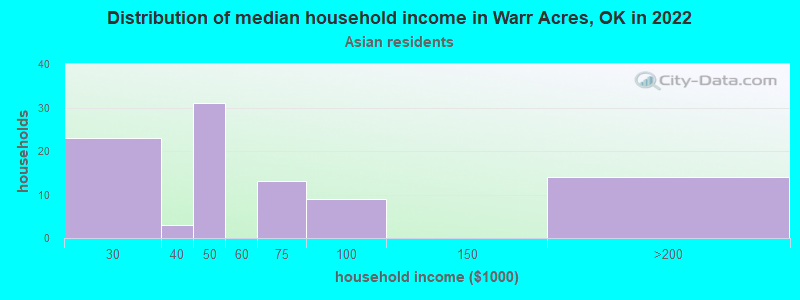
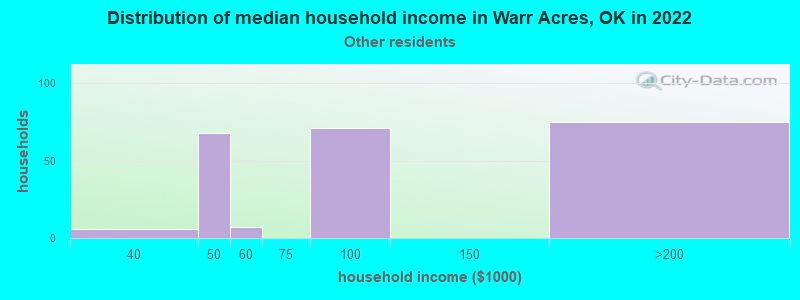
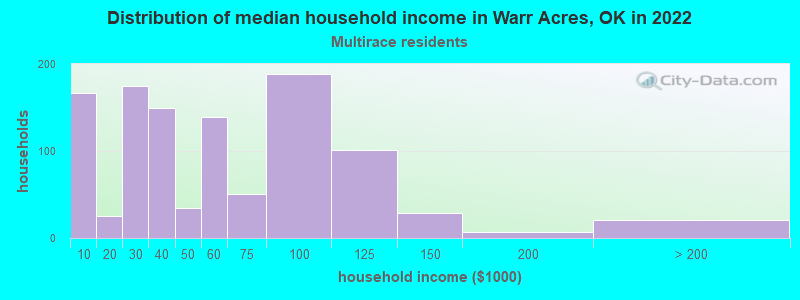
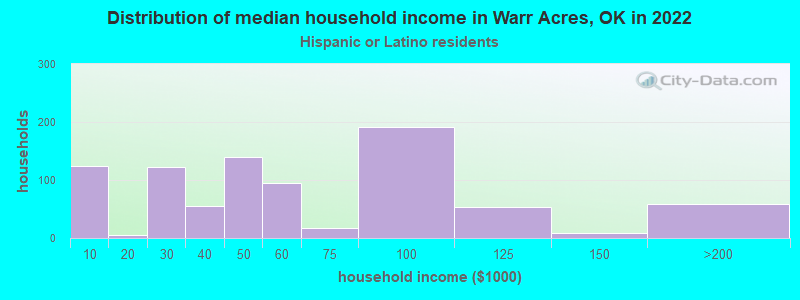
Income and house value in Warr Acres Median household income in 2022 $60,167 White non-Hispanic householders$26,058 Black householders$47,219 Asian householders$91,498 Some other race householders$49,303 Two or more races householders$49,239 Hispanic or Latino race householdersMedian 2022 house value $162,188 White Non-Hispanic householders$155,220 Black or African American householders$137,920 American Indian or Alaska Native householders $354,411 Asian householders$110,768 Some other race householders$142,245 Two or more races householders$124,464 Hispanic or Latino householders
Median age by race in Warr Acres
35.0 Median age for White residents36.7 33.0 41.5 Median age for Black or African American residents44.4 28.9 37.8 Median age for American Indian / Alaska Native residents35.4 19.6 32.3 Median age for Asian residents23.7 43.6 -725,225,224.5 Median age for Native Hawaiian / Pacific Islander residents-675,324,674.6 -767,251,461.2 21.5 Median age for Other race residents22.7 19.2 24.5 Median age for Two or more races residents21.6 30.6 46.1 Median age for White alone residents50.6 42.8 20.4 Median age for Hispanic or Latino residents21.1 19.3
Owner/renter occupied households by race in Warr Acres
House owners and renters - White residents 1,562 75.4% Owner occupied511 24.6% Renter occupiedHouse owners and renters - Black or African American residents 208 34.7% Owner occupied391 65.3% Renter occupiedHouse owners and renters - American Indian / Alaska Native residents 29 50.2% Owner occupied28 49.8% Renter occupiedHouse owners and renters - Asian residents 46 40.7% Owner occupied67 59.3% Renter occupiedHouse owners and renters - Other race residents 73 32.5% Owner occupied151 67.5% Renter occupiedHouse owners and renters - Two or more races residents 534 48.9% Owner occupied558 51.1% Renter occupiedHouse owners and renters - White alone residents 1,523 77.4% Owner occupied445 22.6% Renter occupiedHouse owners and renters - Hispanic or Latino residents 387 43.4% Owner occupied504 56.6% Renter occupied
Language usage in Warr Acres
English speakers - Total 66.9% of residents of Warr Acres speak English at home.
28.0% of residents speak Spanish at home 1,335 50.3% Speak English very well1,318 49.7% Speak English less than very well5.4% of residents speak other language at home 316 61.8% Speak English very well195 38.2% Speak English less than very well
English speakers - Born in the United States 90.6% of residents of Warr Acres speak English at home.
7.9% of residents speak Spanish at home 161 91.0% Speak English very well16 9.0% Speak English less than very well1.2% of residents speak other language at home 3 10.7% Speak English very well25 89.3% Speak English less than very well
English speakers - Native, born elsewhere 38.8% of residents of Warr Acres speak English at home.
64.7% of residents speak Spanish at home 88 52.7% Speak English very well79 47.3% Speak English less than very well
English speakers - Foreign-born 9.3% of residents of Warr Acres speak English at home.
71.8% of residents speak Spanish at home 451 27.9% Speak English very well1,164 72.1% Speak English less than very well19.0% of residents speak other language at home 287 67.1% Speak English very well141 32.9% Speak English less than very well
White (Caucasian) - Speak only English Native:
94.8% (3,830)Foreign-born:
50.5% (135)
White (Caucasian) - Speak another language Native:
4.5% (183)Foreign-born:
80.8% (216)
Black or African American - Speak only English Native:
100.0% (1,067)Foreign-born:
19.9% (6)
Asian - Speak only English Native:
6.2% (5)Foreign-born:
7.9% (24)
Asian - Speak another language Native:
85.3% (68)Foreign-born:
93.6% (287)
Other race - Speak only English Native:
24.6% (86)Foreign-born:
4.1% (27)
Other race - Speak another language Native:
77.2% (270)Foreign-born:
96.4% (636)
Two or more races - Speak only English Native:
63.0% (1,064)Foreign-born:
0.9% (14)
Two or more races - Speak another language Native:
42.5% (717)Foreign-born:
100.0% (1,510)
White alone - Speak only English Native:
98.5% (3,705)Foreign-born:
77.4% (149)
White alone - Speak another language Native:
1.4% (52)Foreign-born:
24.3% (47)
Hispanic or Latino - Speak only English Native:
35.1% (535)Foreign-born:
2.9% (49)
Hispanic or Latino - Speak another language Native:
64.8% (988)Foreign-born:
96.3% (1,642)
Foreign-born residents in Warr Acres 2,336 residents are foreign born (17.3% Latin America , 4.1% Asia ).
This city:
22.2%Oklahoma:
6.1%
Marital status for residents in Warr Acres Marital status - White (Caucasian) population 15 years and over
Males 23.4% Never married55.8% Now married1.1% Separated1.5% Widowed18.1% DivorcedFemales 28.2% Never married47.2% Now married1.2% Separated8.6% Widowed14.8% DivorcedWomen who gave birth in the past 12 months Now married:
100.0% (38)Unmarried:
0.0% (0)
Women who did not give birth in the past 12 months Now married:
43.6% (425)Unmarried:
56.4% (551)
Marital status - Black or African American population 15 years and over
Males 41.9% Never married31.5% Now married6.5% Separated2.0% Widowed18.1% DivorcedFemales 31.2% Never married40.9% Now married8.9% Separated6.3% Widowed12.8% DivorcedWomen who gave birth in the past 12 months Now married:
23.3% (6)Unmarried:
76.7% (21)
Women who did not give birth in the past 12 months Now married:
38.8% (58)Unmarried:
61.2% (91)
Marital status - American Indian / Alaska Native population 15 years and over
Males 51.2% Never married20.2% Now married0.0% Separated0.0% Widowed28.6% DivorcedFemales 39.0% Never married39.0% Now married0.0% Separated22.0% Widowed0.0% DivorcedWomen who gave birth in the past 12 months Now married:
100.0% (12)Unmarried:
0.0% (0)
Women who did not give birth in the past 12 months Now married:
0.0% (0)Unmarried:
100.0% (36)
Marital status - Asian population 15 years and over
Males 64.8% Never married35.2% Now married0.0% Separated0.0% Widowed0.0% DivorcedFemales 25.5% Never married64.6% Now married0.0% Separated7.5% Widowed2.5% DivorcedWomen who gave birth in the past 12 months Now married:
100.0% (6)Unmarried:
0.0% (0)
Women who did not give birth in the past 12 months Now married:
62.0% (59)Unmarried:
38.0% (36)
Marital status - Other race population 15 years and over
Males 50.6% Never married48.2% Now married0.0% Separated0.0% Widowed1.2% DivorcedFemales 27.5% Never married71.0% Now married0.0% Separated1.5% Widowed0.0% DivorcedWomen who did not give birth in the past 12 months Now married:
70.5% (253)Unmarried:
29.5% (106)
Marital status - Two or more races population 15 years and over
Males 48.7% Never married49.2% Now married0.8% Separated0.0% Widowed1.4% DivorcedFemales 34.8% Never married42.8% Now married10.4% Separated2.7% Widowed9.3% DivorcedWomen who did not give birth in the past 12 months Now married:
49.5% (490)Unmarried:
50.5% (501)
Marital status - White alone, not Hispanic / Latino population 15 years and over
Males 20.1% Never married55.0% Now married1.4% Separated1.8% Widowed21.7% DivorcedFemales 26.8% Never married44.9% Now married1.4% Separated9.9% Widowed17.0% DivorcedWomen who gave birth in the past 12 months Now married:
100.0% (41)Unmarried:
0.0% (0)
Women who did not give birth in the past 12 months Now married:
38.3% (307)Unmarried:
61.7% (494)
Marital status - Hispanic or Latino population 15 years and over
Males 43.5% Never married56.1% Now married0.0% Separated0.0% Widowed0.4% DivorcedFemales 35.9% Never married56.9% Now married3.8% Separated1.4% Widowed2.1% DivorcedWomen who gave birth in the past 12 months Now married:
100.0% (12)Unmarried:
0.0% (0)
Women who did not give birth in the past 12 months Now married:
56.7% (581)Unmarried:
43.3% (443)
Ancestries in Warr Acres
337 6.1% English294 5.3% German173 3.1% American151 2.7% Iranian138 2.5% Italian57 1.0% Brazilian51 0.9% Irish45 0.8% European43 0.8% Finnish34 0.6% Dutch30 0.5% Scottish24 0.4% French12 0.2% Norwegian12 0.2% Swedish8 0.1% Belgian8 0.1% British8 0.1% Hungarian7 0.1% Jamaican5 0.09% Welsh3 0.05% Greek2 0.04% Pennsylvania German
Children Nativity (place of birth) in Warr Acres
Children under 6 years - Living with two parents Both parents native 240 100.0% NativeBoth parents foreign-born 437 100.0% NativeOne native, one foreign-born parent 95 69.3% Native42 30.7% Foreign-bornChildren under 6 years - Living with one parent Native parent 152 100.0% NativeForeign-born parent 107 42.9% Native142 57.1% Foreign-bornChildren 6 to 17 years - Living with two parents Both parents native 431 99.0% Native4 1.0% Foreign-bornBoth parents foreign-born 310 69.0% Native139 31.0% Foreign-bornOne native, one foreign-born parent 49 100.0% NativeChildren 6 to 17 years - Living with one parent Native parent 566 100.0% NativeForeign-born parent 36 50.3% Native36 49.7% Foreign-born
Grandparents responsible for own grandchildren in Warr Acres
Grandparents (30 to 59 years) White / Caucasian 18 47.6% Responsible for grandchildren20 52.4% Not responsible for grandchildrenAsian 11 100.0% Not responsible for grandchildrenOther race 19 100.0% Responsible for grandchildrenTwo or more races 25 100.0% Responsible for grandchildrenWhite alone, not Hispanic / Latino 22 50.7% Responsible for grandchildren21 49.3% Not responsible for grandchildrenHispanic or Latino 24 87.7% Responsible for grandchildren3 12.3% Not responsible for grandchildrenGrandparents (60 years and over) White / Caucasian 63 77.6% Responsible for grandchildren18 22.4% Not responsible for grandchildrenTwo or more races 29 100.0% Not responsible for grandchildrenWhite alone, not Hispanic / Latino 60 75.5% Responsible for grandchildren20 24.5% Not responsible for grandchildrenHispanic or Latino 22 100.0% Not responsible for grandchildren