Races in Warner Robins, Georgia (GA) Detailed Stats
Data:
Races - White alone (%)
Races - White alone (% change since 2000)
Races - Black alone (%)
Races - Black alone (% change since 2000)
Races - American Indian alone (%)
Races - American Indian alone (% change since 2000)
Races - Asian alone (%)
Races - Asian alone (% change since 2000)
Races - Hispanic (%)
Races - Hispanic (% change since 2000)
Races - Native Hawaiian and Other Pacific Islander alone (%)
Races - Native Hawaiian and Other Pacific Islander alone (% change since 2000)
Races - Two or more races(%)
Races - Two or more races(% change since 2000)
Races - Other race alone (%)
Races - Other race alone (% change since 2000)
Racial diversity
Place of birth - Born in state of residence (%)
Place of birth - Born in state of residence (%) - White
Place of birth - Born in state of residence (%) - Black or African American
Place of birth - Born in state of residence (%) - Asian
Place of birth - Born in state of residence (%) - Hispanic or Latino
Place of birth - Born in state of residence (%) - American Indian and Alaska Native
Place of birth - Born in state of residence (%) - Multirace
Place of birth - Born in state of residence (%) - Other Race
Place of birth - Born in other state (%)
Place of birth - Born in other state (%) - White
Place of birth - Born in other state (%) - Black or African American
Place of birth - Born in other state (%) - Asian
Place of birth - Born in other state (%) - Hispanic or Latino
Place of birth - Born in other state (%) - American Indian and Alaska Native
Place of birth - Born in other state (%) - Multirace
Place of birth - Born in other state (%) - Other Race
Place of birth - Native, outside of US (%)
Place of birth - Native, outside of US (%) - White
Place of birth - Native, outside of US (%) - Black or African American
Place of birth - Native, outside of US (%) - Asian
Place of birth - Native, outside of US (%) - Hispanic or Latino
Place of birth - Native, outside of US (%) - American Indian and Alaska Native
Place of birth - Native, outside of US (%) - Multirace
Place of birth - Native, outside of US (%) - Other Race
Place of birth - Foreign born (%)
Place of birth - Foreign born (%) - White
Place of birth - Foreign born (%) - Black or African American
Place of birth - Foreign born (%) - Asian
Place of birth - Foreign born (%) - Hispanic or Latino
Place of birth - Foreign born (%) - American Indian and Alaska Native
Place of birth - Foreign born (%) - Multirace
Place of birth - Foreign born (%) - Other Race
Residents speaking English at home (%)
Residents speaking English at home - Born in the United States (%)
Residents speaking English at home - Native, born elsewhere (%)
Residents speaking English at home - Foreign born (%)
Residents speaking Spanish at home (%)
Residents speaking Spanish at home - Born in the United States (%)
Residents speaking Spanish at home - Native, born elsewhere (%)
Residents speaking Spanish at home - Foreign born (%)
Residents speaking other language at home (%)
Residents speaking other language at home - Born in the United States (%)
Residents speaking other language at home - Native, born elsewhere (%)
Residents speaking other language at home - Foreign born (%)
Marital status - Never married (%)
Marital status - Now married (%)
Marital status - Separated (%)
Marital status - Widowed (%)
Marital status - Divorced (%)
Ancestries Reported - Arab (%)
Ancestries Reported - Czech (%)
Ancestries Reported - Danish (%)
Ancestries Reported - Dutch (%)
Ancestries Reported - English (%)
Ancestries Reported - French (%)
Ancestries Reported - French Canadian (%)
Ancestries Reported - German (%)
Ancestries Reported - Greek (%)
Ancestries Reported - Hungarian (%)
Ancestries Reported - Irish (%)
Ancestries Reported - Italian (%)
Ancestries Reported - Lithuanian (%)
Ancestries Reported - Norwegian (%)
Ancestries Reported - Polish (%)
Ancestries Reported - Portuguese (%)
Ancestries Reported - Russian (%)
Ancestries Reported - Scotch-Irish (%)
Ancestries Reported - Scottish (%)
Ancestries Reported - Slovak (%)
Ancestries Reported - Subsaharan African (%)
Ancestries Reported - Swedish (%)
Ancestries Reported - Swiss (%)
Ancestries Reported - Ukrainian (%)
Ancestries Reported - United States (%)
Ancestries Reported - Welsh (%)
Ancestries Reported - West Indian (%)
Ancestries Reported - Other (%)
Geographical mobility - Same house 1 year ago (%)
Geographical mobility - Same house 1 year ago (%) - White
Geographical mobility - Same house 1 year ago (%) - Black or African American
Geographical mobility - Same house 1 year ago (%) - Asian
Geographical mobility - Same house 1 year ago (%) - Hispanic or Latino
Geographical mobility - Same house 1 year ago (%) - American Indian and Alaska Native
Geographical mobility - Same house 1 year ago (%) - Multirace
Geographical mobility - Same house 1 year ago (%) - Other Race
Geographical mobility - Moved within same county (%)
Geographical mobility - Moved within same county (%) - White
Geographical mobility - Moved within same county (%) - Black or African American
Geographical mobility - Moved within same county (%) - Asian
Geographical mobility - Moved within same county (%) - Hispanic or Latino
Geographical mobility - Moved within same county (%) - American Indian and Alaska Native
Geographical mobility - Moved within same county (%) - Multirace
Geographical mobility - Moved within same county (%) - Other Race
Geographical mobility - Moved from different county within same state (%)
Geographical mobility - Moved from different county within same state (%) - White
Geographical mobility - Moved from different county within same state (%) - Black or African American
Geographical mobility - Moved from different county within same state (%) - Asian
Geographical mobility - Moved from different county within same state (%) - Hispanic or Latino
Geographical mobility - Moved from different county within same state (%) - American Indian and Alaska Native
Geographical mobility - Moved from different county within same state (%) - Multirace
Geographical mobility - Moved from different county within same state (%) - Other Race
Geographical mobility - Moved from different state (%)
Geographical mobility - Moved from different state (%) - White
Geographical mobility - Moved from different state (%) - Black or African American
Geographical mobility - Moved from different state (%) - Asian
Geographical mobility - Moved from different state (%) - Hispanic or Latino
Geographical mobility - Moved from different state (%) - American Indian and Alaska Native
Geographical mobility - Moved from different state (%) - Multirace
Geographical mobility - Moved from different state (%) - Other Race
Geographical mobility - Moved from abroad (%)
Geographical mobility - Moved from abroad (%) - White
Geographical mobility - Moved from abroad (%) - Black or African American
Geographical mobility - Moved from abroad (%) - Asian
Geographical mobility - Moved from abroad (%) - Hispanic or Latino
Geographical mobility - Moved from abroad (%) - American Indian and Alaska Native
Geographical mobility - Moved from abroad (%) - Multirace
Geographical mobility - Moved from abroad (%) - Other Race
Place of birth for the foreign-born population - Ireland (%)
Place of birth for the foreign-born population - Denmark (%)
Place of birth for the foreign-born population - Norway (%)
Place of birth for the foreign-born population - Sweden (%)
Place of birth for the foreign-born population - United Kingdom (%)
Place of birth for the foreign-born population - England (%)
Place of birth for the foreign-born population - Scotland (%)
Place of birth for the foreign-born population - Other Northern Europe (%)
Place of birth for the foreign-born population - Austria (%)
Place of birth for the foreign-born population - Belgium (%)
Place of birth for the foreign-born population - France (%)
Place of birth for the foreign-born population - Germany (%)
Place of birth for the foreign-born population - Netherlands (%)
Place of birth for the foreign-born population - Switzerland (%)
Place of birth for the foreign-born population - Other Western Europe (%)
Place of birth for the foreign-born population - Greece (%)
Place of birth for the foreign-born population - Italy (%)
Place of birth for the foreign-born population - Portugal (%)
Place of birth for the foreign-born population - Spain (%)
Place of birth for the foreign-born population - Other Southern Europe (%)
Place of birth for the foreign-born population - Albania (%)
Place of birth for the foreign-born population - Belarus (%)
Place of birth for the foreign-born population - Bosnia and Herzegovina (%)
Place of birth for the foreign-born population - Bulgaria (%)
Place of birth for the foreign-born population - Croatia (%)
Place of birth for the foreign-born population - Czechoslovakia (%)
Place of birth for the foreign-born population - Hungary (%)
Place of birth for the foreign-born population - Latvia (%)
Place of birth for the foreign-born population - Lithuania (%)
Place of birth for the foreign-born population - North Macedonia (Macedonia) (%)
Place of birth for the foreign-born population - Moldova (%)
Place of birth for the foreign-born population - Poland (%)
Place of birth for the foreign-born population - Romania (%)
Place of birth for the foreign-born population - Russia (%)
Place of birth for the foreign-born population - Serbia (%)
Place of birth for the foreign-born population - Ukraine (%)
Place of birth for the foreign-born population - Other Eastern Europe (%)
Place of birth for the foreign-born population - China (%)
Place of birth for the foreign-born population - Hong Kong (%)
Place of birth for the foreign-born population - Taiwan (%)
Place of birth for the foreign-born population - Japan (%)
Place of birth for the foreign-born population - Korea (%)
Place of birth for the foreign-born population - Other Eastern Asia (%)
Place of birth for the foreign-born population - Afghanistan (%)
Place of birth for the foreign-born population - Bangladesh (%)
Place of birth for the foreign-born population - India (%)
Place of birth for the foreign-born population - Iran (%)
Place of birth for the foreign-born population - Kazakhstan (%)
Place of birth for the foreign-born population - Nepal (%)
Place of birth for the foreign-born population - Pakistan (%)
Place of birth for the foreign-born population - Sri Lanka (%)
Place of birth for the foreign-born population - Uzbekistan (%)
Place of birth for the foreign-born population - Other South Central Asia (%)
Place of birth for the foreign-born population - Burma (%)
Place of birth for the foreign-born population - Cambodia (%)
Place of birth for the foreign-born population - Indonesia (%)
Place of birth for the foreign-born population - Laos (%)
Place of birth for the foreign-born population - Malaysia (%)
Place of birth for the foreign-born population - Philippines (%)
Place of birth for the foreign-born population - Singapore (%)
Place of birth for the foreign-born population - Thailand (%)
Place of birth for the foreign-born population - Vietnam (%)
Place of birth for the foreign-born population - Other South Eastern Asia (%)
Place of birth for the foreign-born population - Armenia (%)
Place of birth for the foreign-born population - Iraq (%)
Place of birth for the foreign-born population - Israel (%)
Place of birth for the foreign-born population - Jordan (%)
Place of birth for the foreign-born population - Kuwait (%)
Place of birth for the foreign-born population - Lebanon (%)
Place of birth for the foreign-born population - Saudi Arabia (%)
Place of birth for the foreign-born population - Syria (%)
Place of birth for the foreign-born population - Turkey (%)
Place of birth for the foreign-born population - Yemen (%)
Place of birth for the foreign-born population - Other Western Asia (%)
Place of birth for the foreign-born population - Eritrea (%)
Place of birth for the foreign-born population - Ethiopia (%)
Place of birth for the foreign-born population - Kenya (%)
Place of birth for the foreign-born population - Somalia (%)
Place of birth for the foreign-born population - Uganda (%)
Place of birth for the foreign-born population - Zimbabwe (%)
Place of birth for the foreign-born population - Other Eastern Africa (%)
Place of birth for the foreign-born population - Cameroon (%)
Place of birth for the foreign-born population - Congo (%)
Place of birth for the foreign-born population - Democratic Republic of Congo (Zaire) (%)
Place of birth for the foreign-born population - Other Middle Africa (%)
Place of birth for the foreign-born population - Egypt (%)
Place of birth for the foreign-born population - Morocco (%)
Place of birth for the foreign-born population - Sudan (%)
Place of birth for the foreign-born population - Other Northern Africa (%)
Place of birth for the foreign-born population - South Africa (%)
Place of birth for the foreign-born population - Other Southern Africa (%)
Place of birth for the foreign-born population - Cabo Verde (%)
Place of birth for the foreign-born population - Ghana (%)
Place of birth for the foreign-born population - Liberia (%)
Place of birth for the foreign-born population - Nigeria (%)
Place of birth for the foreign-born population - Senegal (%)
Place of birth for the foreign-born population - Sierra Leone (%)
Place of birth for the foreign-born population - Other Western Africa (%)
Place of birth for the foreign-born population - Australia (%)
Place of birth for the foreign-born population - New Zealand (%)
Place of birth for the foreign-born population - Fiji (%)
Place of birth for the foreign-born population - Micronesia (%)
Place of birth for the foreign-born population - Bahamas (%)
Place of birth for the foreign-born population - Barbados (%)
Place of birth for the foreign-born population - Cuba (%)
Place of birth for the foreign-born population - Dominica (%)
Place of birth for the foreign-born population - Dominican Republic (%)
Place of birth for the foreign-born population - Grenada (%)
Place of birth for the foreign-born population - Haiti (%)
Place of birth for the foreign-born population - Jamaica (%)
Place of birth for the foreign-born population - St. Vincent and the Grenadines (%)
Place of birth for the foreign-born population - Trinidad and Tobago (%)
Place of birth for the foreign-born population - West Indies (%)
Place of birth for the foreign-born population - Other Caribbean (%)
Place of birth for the foreign-born population - Belize (%)
Place of birth for the foreign-born population - Costa Rica (%)
Place of birth for the foreign-born population - El Salvador (%)
Place of birth for the foreign-born population - Guatemala (%)
Place of birth for the foreign-born population - Honduras (%)
Place of birth for the foreign-born population - Mexico (%)
Place of birth for the foreign-born population - Nicaragua (%)
Place of birth for the foreign-born population - Panama (%)
Place of birth for the foreign-born population - Other Central America (%)
Place of birth for the foreign-born population - Argentina (%)
Place of birth for the foreign-born population - Bolivia (%)
Place of birth for the foreign-born population - Brazil (%)
Place of birth for the foreign-born population - Chile (%)
Place of birth for the foreign-born population - Colombia (%)
Place of birth for the foreign-born population - Ecuador (%)
Place of birth for the foreign-born population - Guyana (%)
Place of birth for the foreign-born population - Peru (%)
Place of birth for the foreign-born population - Uruguay (%)
Place of birth for the foreign-born population - Venezuela (%)
Place of birth for the foreign-born population - Other South America (%)
Place of birth for the foreign-born population - Canada (%)
Place of birth for the foreign-born population - Other Northern America (%)
Place of birth for the foreign-born population - Other (%)
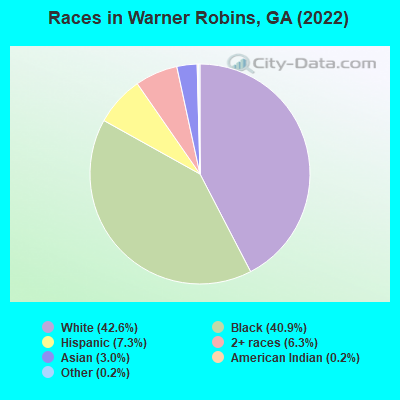
According to 2022 data, the most numerous races in Warner Robins, GA are White alone (35,368 residents), Black alone (34,001 residents), and Hispanic (6,025 residents). 91.9% of Warner Robins residents speak English at home. 8.0% of Warner Robins, GA residents are foreign-born (3.2% born in Latin America, 2.5% born in Asia, 1.2% born in Africa), which is 25.4% less than the foreign-born rate of 10.0% across the entire state of Georgia.
Race distribution in Warner Robins
2000 2022
5,128,661 62.6% White alone 2,331,465 28.5% Black alone 435,227 5.3% Hispanic 171,513 2.1% Asian alone 87,364 1.1% Two or more races 17,670 0.2% American Indian alone 11,275 0.1% Other race alone 3,278 0.04% Native Hawaiian and Other
5,415,657 49.6% White alone 3,349,240 30.7% Black alone 1,132,604 10.4% Hispanic 479,156 4.4% Asian alone 462,923 4.2% Two or more races 54,416 0.5% Other race alone 11,923 0.1% American Indian alone 6,957 0.06% Native Hawaiian and Other
Income and house value in Warner Robins Median household income in 2022 $74,986 White non-Hispanic householders$39,173 Black householders$48,014 Asian householders$19,177 Some other race householders$65,278 Two or more races householders$61,325 Hispanic or Latino race householdersMedian 2022 house value $175,156 White Non-Hispanic householders$172,365 Black or African American householders$183,530 American Indian or Alaska Native householders $217,491 Asian householders$23,258 Native Hawaiian and other Pacific Islander householders$201,209 Some other race householders$173,295 Two or more races householders$207,024 Hispanic or Latino householders
Median age by race in Warner Robins
36.5 Median age for White residents32.2 40.5 30.8 Median age for Black or African American residents27.4 31.8 -666,666,666.0 Median age for American Indian / Alaska Native residents-666,666,666.0 -666,666,666.0 29.9 Median age for Asian residents31.5 27.5 -666,666,666.0 Median age for Native Hawaiian / Pacific Islander residents-666,666,666.0 -666,666,666.0 28.8 Median age for Other race residents30.7 19.1 24.2 Median age for Two or more races residents19.7 25.7 36.2 Median age for White alone residents31.8 40.5 31.7 Median age for Hispanic or Latino residents25.4 35.8
Owner/renter occupied households by race in Warner Robins
House owners and renters - White residents 10,678 64.7% Owner occupied5,817 35.3% Renter occupiedHouse owners and renters - Black or African American residents 4,292 33.0% Owner occupied8,703 67.0% Renter occupiedHouse owners and renters - American Indian / Alaska Native residents 91 75.3% Owner occupied30 24.7% Renter occupiedHouse owners and renters - Asian residents 923 77.2% Owner occupied272 22.8% Renter occupiedHouse owners and renters - Other race residents 68 38.0% Owner occupied111 62.0% Renter occupiedHouse owners and renters - Two or more races residents 948 47.2% Owner occupied1,060 52.8% Renter occupiedHouse owners and renters - White alone residents 10,300 65.7% Owner occupied5,383 34.3% Renter occupiedHouse owners and renters - Hispanic or Latino residents 863 52.1% Owner occupied793 47.9% Renter occupied
Language usage in Warner Robins
English speakers - Total 91.9% of residents of Warner Robins speak English at home.
2.8% of residents speak Spanish at home 1,377 65.1% Speak English very well737 34.9% Speak English less than very well5.4% of residents speak other language at home 2,967 70.9% Speak English very well1,217 29.1% Speak English less than very well
English speakers - Born in the United States 97.3% of residents of Warner Robins speak English at home.
1.7% of residents speak Spanish at home 482 98.4% Speak English very well8 1.6% Speak English less than very well1.3% of residents speak other language at home 327 87.7% Speak English very well46 12.3% Speak English less than very well
English speakers - Native, born elsewhere 79.6% of residents of Warner Robins speak English at home.
4.4% of residents speak Spanish at home 41 38.3% Speak English very well66 61.7% Speak English less than very well3.1% of residents speak other language at home 74 100.0% Speak English very well
English speakers - Foreign-born 29.3% of residents of Warner Robins speak English at home.
27.9% of residents speak Spanish at home 852 54.9% Speak English very well699 45.1% Speak English less than very well49.6% of residents speak other language at home 1,695 61.5% Speak English very well1,063 38.5% Speak English less than very well
White (Caucasian) - Speak only English Native:
98.2% (34,822)Foreign-born:
76.3% (1,252)
White (Caucasian) - Speak another language Native:
1.8% (650)Foreign-born:
23.7% (388)
Black or African American - Speak only English Native:
98.0% (28,174)Foreign-born:
68.6% (1,111)
Black or African American - Speak another language Native:
1.9% (559)Foreign-born:
30.4% (493)
Asian - Speak only English Native:
92.6% (307)Foreign-born:
16.9% (348)
Asian - Speak another language Native:
91.3% (303)Foreign-born:
83.2% (1,708)
Other race - Speak another language Native:
47.8% (158)Foreign-born:
99.0% (386)
Two or more races - Speak only English Native:
90.9% (5,235)Foreign-born:
7.6% (80)
Two or more races - Speak another language Native:
9.5% (550)Foreign-born:
92.1% (972)
White alone - Speak only English Native:
99.7% (32,442)Foreign-born:
77.7% (527)
White alone - Speak another language Native:
0.5% (157)Foreign-born:
18.9% (128)
Hispanic or Latino - Speak only English Native:
63.6% (2,068)Foreign-born:
43.5% (713)
Hispanic or Latino - Speak another language Native:
36.4% (1,183)Foreign-born:
56.5% (925)
Foreign-born residents in Warner Robins 6,626 residents are foreign born (3.2% Latin America , 2.5% Asia , 1.2% Africa ).
This city:
8.0%Georgia:
10.4%
Marital status for residents in Warner Robins Marital status - White (Caucasian) population 15 years and over
Males 38.3% Never married50.9% Now married0.0% Separated2.0% Widowed8.8% DivorcedFemales 24.9% Never married44.5% Now married1.5% Separated12.0% Widowed17.1% DivorcedWomen who gave birth in the past 12 months Now married:
100.0% (624)Unmarried:
0.0% (0)
Women who did not give birth in the past 12 months Now married:
42.6% (4,333)Unmarried:
57.4% (5,837)
Marital status - Black or African American population 15 years and over
Males 52.9% Never married36.2% Now married0.0% Separated0.0% Widowed10.9% DivorcedFemales 49.3% Never married32.7% Now married1.3% Separated4.4% Widowed12.2% DivorcedWomen who gave birth in the past 12 months Now married:
39.1% (198)Unmarried:
60.9% (308)
Women who did not give birth in the past 12 months Now married:
29.7% (2,794)Unmarried:
70.3% (6,610)
Marital status - American Indian / Alaska Native population 15 years and over
Males 0.0% Never married100.0% Now married0.0% Separated0.0% Widowed0.0% DivorcedFemales 71.1% Never married25.7% Now married0.0% Separated3.2% Widowed0.0% DivorcedWomen who gave birth in the past 12 months Now married:
0.0% (0)Unmarried:
100.0% (11)
Women who did not give birth in the past 12 months Now married:
25.5% (84)Unmarried:
74.5% (246)
Marital status - Asian population 15 years and over
Males 22.4% Never married64.4% Now married13.2% Separated0.0% Widowed0.0% DivorcedFemales 16.7% Never married49.7% Now married6.6% Separated18.0% Widowed9.1% DivorcedWomen who did not give birth in the past 12 months Now married:
69.3% (582)Unmarried:
30.7% (258)
Marital status - Other race population 15 years and over
Males 36.8% Never married53.8% Now married9.4% Separated0.0% Widowed0.0% DivorcedFemales 38.4% Never married30.6% Now married13.4% Separated0.0% Widowed17.6% DivorcedWomen who gave birth in the past 12 months Now married:
100.0% (112)Unmarried:
0.0% (0)
Women who did not give birth in the past 12 months Now married:
13.0% (25)Unmarried:
87.0% (165)
Marital status - Two or more races population 15 years and over
Males 39.2% Never married45.1% Now married0.0% Separated0.0% Widowed15.7% DivorcedFemales 55.2% Never married37.6% Now married0.0% Separated5.0% Widowed2.2% DivorcedWomen who gave birth in the past 12 months Now married:
100.0% (1)Unmarried:
0.0% (0)
Women who did not give birth in the past 12 months Now married:
26.7% (500)Unmarried:
73.3% (1,372)
Marital status - White alone, not Hispanic / Latino population 15 years and over
Males 38.1% Never married50.5% Now married0.0% Separated2.1% Widowed9.2% DivorcedFemales 23.1% Never married45.0% Now married1.5% Separated12.5% Widowed17.8% DivorcedWomen who gave birth in the past 12 months Now married:
100.0% (624)Unmarried:
0.0% (0)
Women who did not give birth in the past 12 months Now married:
43.8% (4,185)Unmarried:
56.2% (5,374)
Marital status - Hispanic or Latino population 15 years and over
Males 48.8% Never married48.6% Now married1.1% Separated0.0% Widowed1.5% DivorcedFemales 41.8% Never married46.7% Now married2.7% Separated1.3% Widowed7.5% DivorcedWomen who gave birth in the past 12 months Now married:
79.1% (130)Unmarried:
20.9% (35)
Women who did not give birth in the past 12 months Now married:
39.3% (654)Unmarried:
60.7% (1,009)
Ancestries in Warner Robins
6,009 14.7% American4,374 10.7% English1,752 4.3% German1,744 4.3% Irish848 2.1% Italian816 2.0% Jamaican721 1.8% Ethiopian687 1.7% European645 1.6% African322 0.8% Senegalese299 0.7% Scottish245 0.6% Scotch-Irish236 0.6% West Indian199 0.5% French187 0.5% Eastern European149 0.4% Dutch128 0.3% Polish121 0.3% French Canadian109 0.3% British West Indian104 0.3% British102 0.2% Norwegian84 0.2% Northern European58 0.1% Greek46 0.1% Albanian35 0.09% Canadian27 0.07% Arab27 0.07% Czech21 0.05% Lebanese21 0.05% Cajun21 0.05% Hungarian19 0.05% Trinidadian and Tobagonian18 0.04% Armenian17 0.04% Czechoslovakian16 0.04% Swedish14 0.03% Slovak13 0.03% Welsh11 0.03% Swiss11 0.03% Haitian11 0.03% Iranian11 0.03% Ghanaian6 0.01% Egyptian4 0.01% Romanian
Geographical mobility in Warner Robins Same house 1 year ago 33,875 87.1% White (Caucasian)25,851 80.6% Black or African American475 78.5% American Indian / Alaska Native2,182 76.9% Asian817 98.4% Other race6,531 81.0% Two or more races32,465 87.2% White alone, not Hispanic / Latino5,432 90.4% Hispanic or LatinoMoved within same county 2,015 5.2% White / Caucasian2,526 7.9% Black or African American363 12.8% Asian11 1.4% Other race513 6.4% Two or more races2,015 5.4% White alone, not Hispanic / Latino90 1.5% Hispanic or LatinoMoved within same state 1,819 4.7% White / Caucasian2,870 9.0% Black or African American147 24.3% American Indian / Alaska Native151 5.3% Asian525 6.5% Two or more races1,566 4.2% White alone, not Hispanic / Latino406 6.8% Hispanic or LatinoMoved from different state 1,112 2.9% White / Caucasian11 1.8% American Indian / Alaska Native77 2.7% Asian165 2.0% Two or more races1,112 3.0% White alone, not Hispanic / Latino210 3.5% Hispanic or LatinoMoved from abroad 93 0.2% White814 2.5% Black or African American5 0.1% Two or more races93 0.2% White alone, not Hispanic / Latino
Children Nativity (place of birth) in Warner Robins
Children under 6 years - Living with two parents Both parents native 3,158 100.0% NativeBoth parents foreign-born 195 87.0% Native29 13.0% Foreign-bornOne native, one foreign-born parent 659 100.0% NativeChildren under 6 years - Living with one parent Native parent 2,692 100.0% NativeForeign-born parent 249 100.0% NativeChildren 6 to 17 years - Living with two parents Both parents native 5,579 91.3% Native529 8.7% Foreign-bornBoth parents foreign-born 438 81.3% Native100 18.7% Foreign-bornOne native, one foreign-born parent 730 100.0% NativeChildren 6 to 17 years - Living with one parent Native parent 5,141 100.0% NativeForeign-born parent 845 56.8% Native644 43.2% Foreign-born
Grandparents responsible for own grandchildren in Warner Robins
Grandparents (30 to 59 years) White / Caucasian 145 38.7% Responsible for grandchildren231 61.3% Not responsible for grandchildrenBlack or African American 208 42.5% Responsible for grandchildren281 57.5% Not responsible for grandchildrenTwo or more races 9 100.0% Not responsible for grandchildrenWhite alone, not Hispanic / Latino 94 34.1% Responsible for grandchildren182 65.9% Not responsible for grandchildrenHispanic or Latino 47 42.2% Responsible for grandchildren64 57.8% Not responsible for grandchildrenGrandparents (60 years and over) White / Caucasian 98 31.8% Responsible for grandchildren211 68.2% Not responsible for grandchildrenBlack or African American 151 38.9% Responsible for grandchildren238 61.1% Not responsible for grandchildrenTwo or more races 12 100.0% Responsible for grandchildrenWhite alone, not Hispanic / Latino 99 30.8% Responsible for grandchildren222 69.2% Not responsible for grandchildren