Races in Wantagh, New York (NY) Detailed Stats
Data:
Races - White alone (%)
Races - White alone (% change since 2000)
Races - Black alone (%)
Races - Black alone (% change since 2000)
Races - American Indian alone (%)
Races - American Indian alone (% change since 2000)
Races - Asian alone (%)
Races - Asian alone (% change since 2000)
Races - Hispanic (%)
Races - Hispanic (% change since 2000)
Races - Native Hawaiian and Other Pacific Islander alone (%)
Races - Native Hawaiian and Other Pacific Islander alone (% change since 2000)
Races - Two or more races(%)
Races - Two or more races(% change since 2000)
Races - Other race alone (%)
Races - Other race alone (% change since 2000)
Racial diversity
Place of birth - Born in state of residence (%)
Place of birth - Born in state of residence (%) - White
Place of birth - Born in state of residence (%) - Black or African American
Place of birth - Born in state of residence (%) - Asian
Place of birth - Born in state of residence (%) - Hispanic or Latino
Place of birth - Born in state of residence (%) - American Indian and Alaska Native
Place of birth - Born in state of residence (%) - Multirace
Place of birth - Born in state of residence (%) - Other Race
Place of birth - Born in other state (%)
Place of birth - Born in other state (%) - White
Place of birth - Born in other state (%) - Black or African American
Place of birth - Born in other state (%) - Asian
Place of birth - Born in other state (%) - Hispanic or Latino
Place of birth - Born in other state (%) - American Indian and Alaska Native
Place of birth - Born in other state (%) - Multirace
Place of birth - Born in other state (%) - Other Race
Place of birth - Native, outside of US (%)
Place of birth - Native, outside of US (%) - White
Place of birth - Native, outside of US (%) - Black or African American
Place of birth - Native, outside of US (%) - Asian
Place of birth - Native, outside of US (%) - Hispanic or Latino
Place of birth - Native, outside of US (%) - American Indian and Alaska Native
Place of birth - Native, outside of US (%) - Multirace
Place of birth - Native, outside of US (%) - Other Race
Place of birth - Foreign born (%)
Place of birth - Foreign born (%) - White
Place of birth - Foreign born (%) - Black or African American
Place of birth - Foreign born (%) - Asian
Place of birth - Foreign born (%) - Hispanic or Latino
Place of birth - Foreign born (%) - American Indian and Alaska Native
Place of birth - Foreign born (%) - Multirace
Place of birth - Foreign born (%) - Other Race
Residents speaking English at home (%)
Residents speaking English at home - Born in the United States (%)
Residents speaking English at home - Native, born elsewhere (%)
Residents speaking English at home - Foreign born (%)
Residents speaking Spanish at home (%)
Residents speaking Spanish at home - Born in the United States (%)
Residents speaking Spanish at home - Native, born elsewhere (%)
Residents speaking Spanish at home - Foreign born (%)
Residents speaking other language at home (%)
Residents speaking other language at home - Born in the United States (%)
Residents speaking other language at home - Native, born elsewhere (%)
Residents speaking other language at home - Foreign born (%)
Marital status - Never married (%)
Marital status - Now married (%)
Marital status - Separated (%)
Marital status - Widowed (%)
Marital status - Divorced (%)
Ancestries Reported - Arab (%)
Ancestries Reported - Czech (%)
Ancestries Reported - Danish (%)
Ancestries Reported - Dutch (%)
Ancestries Reported - English (%)
Ancestries Reported - French (%)
Ancestries Reported - French Canadian (%)
Ancestries Reported - German (%)
Ancestries Reported - Greek (%)
Ancestries Reported - Hungarian (%)
Ancestries Reported - Irish (%)
Ancestries Reported - Italian (%)
Ancestries Reported - Lithuanian (%)
Ancestries Reported - Norwegian (%)
Ancestries Reported - Polish (%)
Ancestries Reported - Portuguese (%)
Ancestries Reported - Russian (%)
Ancestries Reported - Scotch-Irish (%)
Ancestries Reported - Scottish (%)
Ancestries Reported - Slovak (%)
Ancestries Reported - Subsaharan African (%)
Ancestries Reported - Swedish (%)
Ancestries Reported - Swiss (%)
Ancestries Reported - Ukrainian (%)
Ancestries Reported - United States (%)
Ancestries Reported - Welsh (%)
Ancestries Reported - West Indian (%)
Ancestries Reported - Other (%)
Geographical mobility - Same house 1 year ago (%)
Geographical mobility - Same house 1 year ago (%) - White
Geographical mobility - Same house 1 year ago (%) - Black or African American
Geographical mobility - Same house 1 year ago (%) - Asian
Geographical mobility - Same house 1 year ago (%) - Hispanic or Latino
Geographical mobility - Same house 1 year ago (%) - American Indian and Alaska Native
Geographical mobility - Same house 1 year ago (%) - Multirace
Geographical mobility - Same house 1 year ago (%) - Other Race
Geographical mobility - Moved within same county (%)
Geographical mobility - Moved within same county (%) - White
Geographical mobility - Moved within same county (%) - Black or African American
Geographical mobility - Moved within same county (%) - Asian
Geographical mobility - Moved within same county (%) - Hispanic or Latino
Geographical mobility - Moved within same county (%) - American Indian and Alaska Native
Geographical mobility - Moved within same county (%) - Multirace
Geographical mobility - Moved within same county (%) - Other Race
Geographical mobility - Moved from different county within same state (%)
Geographical mobility - Moved from different county within same state (%) - White
Geographical mobility - Moved from different county within same state (%) - Black or African American
Geographical mobility - Moved from different county within same state (%) - Asian
Geographical mobility - Moved from different county within same state (%) - Hispanic or Latino
Geographical mobility - Moved from different county within same state (%) - American Indian and Alaska Native
Geographical mobility - Moved from different county within same state (%) - Multirace
Geographical mobility - Moved from different county within same state (%) - Other Race
Geographical mobility - Moved from different state (%)
Geographical mobility - Moved from different state (%) - White
Geographical mobility - Moved from different state (%) - Black or African American
Geographical mobility - Moved from different state (%) - Asian
Geographical mobility - Moved from different state (%) - Hispanic or Latino
Geographical mobility - Moved from different state (%) - American Indian and Alaska Native
Geographical mobility - Moved from different state (%) - Multirace
Geographical mobility - Moved from different state (%) - Other Race
Geographical mobility - Moved from abroad (%)
Geographical mobility - Moved from abroad (%) - White
Geographical mobility - Moved from abroad (%) - Black or African American
Geographical mobility - Moved from abroad (%) - Asian
Geographical mobility - Moved from abroad (%) - Hispanic or Latino
Geographical mobility - Moved from abroad (%) - American Indian and Alaska Native
Geographical mobility - Moved from abroad (%) - Multirace
Geographical mobility - Moved from abroad (%) - Other Race
Place of birth for the foreign-born population - Ireland (%)
Place of birth for the foreign-born population - Denmark (%)
Place of birth for the foreign-born population - Norway (%)
Place of birth for the foreign-born population - Sweden (%)
Place of birth for the foreign-born population - United Kingdom (%)
Place of birth for the foreign-born population - England (%)
Place of birth for the foreign-born population - Scotland (%)
Place of birth for the foreign-born population - Other Northern Europe (%)
Place of birth for the foreign-born population - Austria (%)
Place of birth for the foreign-born population - Belgium (%)
Place of birth for the foreign-born population - France (%)
Place of birth for the foreign-born population - Germany (%)
Place of birth for the foreign-born population - Netherlands (%)
Place of birth for the foreign-born population - Switzerland (%)
Place of birth for the foreign-born population - Other Western Europe (%)
Place of birth for the foreign-born population - Greece (%)
Place of birth for the foreign-born population - Italy (%)
Place of birth for the foreign-born population - Portugal (%)
Place of birth for the foreign-born population - Spain (%)
Place of birth for the foreign-born population - Other Southern Europe (%)
Place of birth for the foreign-born population - Albania (%)
Place of birth for the foreign-born population - Belarus (%)
Place of birth for the foreign-born population - Bosnia and Herzegovina (%)
Place of birth for the foreign-born population - Bulgaria (%)
Place of birth for the foreign-born population - Croatia (%)
Place of birth for the foreign-born population - Czechoslovakia (%)
Place of birth for the foreign-born population - Hungary (%)
Place of birth for the foreign-born population - Latvia (%)
Place of birth for the foreign-born population - Lithuania (%)
Place of birth for the foreign-born population - North Macedonia (Macedonia) (%)
Place of birth for the foreign-born population - Moldova (%)
Place of birth for the foreign-born population - Poland (%)
Place of birth for the foreign-born population - Romania (%)
Place of birth for the foreign-born population - Russia (%)
Place of birth for the foreign-born population - Serbia (%)
Place of birth for the foreign-born population - Ukraine (%)
Place of birth for the foreign-born population - Other Eastern Europe (%)
Place of birth for the foreign-born population - China (%)
Place of birth for the foreign-born population - Hong Kong (%)
Place of birth for the foreign-born population - Taiwan (%)
Place of birth for the foreign-born population - Japan (%)
Place of birth for the foreign-born population - Korea (%)
Place of birth for the foreign-born population - Other Eastern Asia (%)
Place of birth for the foreign-born population - Afghanistan (%)
Place of birth for the foreign-born population - Bangladesh (%)
Place of birth for the foreign-born population - India (%)
Place of birth for the foreign-born population - Iran (%)
Place of birth for the foreign-born population - Kazakhstan (%)
Place of birth for the foreign-born population - Nepal (%)
Place of birth for the foreign-born population - Pakistan (%)
Place of birth for the foreign-born population - Sri Lanka (%)
Place of birth for the foreign-born population - Uzbekistan (%)
Place of birth for the foreign-born population - Other South Central Asia (%)
Place of birth for the foreign-born population - Burma (%)
Place of birth for the foreign-born population - Cambodia (%)
Place of birth for the foreign-born population - Indonesia (%)
Place of birth for the foreign-born population - Laos (%)
Place of birth for the foreign-born population - Malaysia (%)
Place of birth for the foreign-born population - Philippines (%)
Place of birth for the foreign-born population - Singapore (%)
Place of birth for the foreign-born population - Thailand (%)
Place of birth for the foreign-born population - Vietnam (%)
Place of birth for the foreign-born population - Other South Eastern Asia (%)
Place of birth for the foreign-born population - Armenia (%)
Place of birth for the foreign-born population - Iraq (%)
Place of birth for the foreign-born population - Israel (%)
Place of birth for the foreign-born population - Jordan (%)
Place of birth for the foreign-born population - Kuwait (%)
Place of birth for the foreign-born population - Lebanon (%)
Place of birth for the foreign-born population - Saudi Arabia (%)
Place of birth for the foreign-born population - Syria (%)
Place of birth for the foreign-born population - Turkey (%)
Place of birth for the foreign-born population - Yemen (%)
Place of birth for the foreign-born population - Other Western Asia (%)
Place of birth for the foreign-born population - Eritrea (%)
Place of birth for the foreign-born population - Ethiopia (%)
Place of birth for the foreign-born population - Kenya (%)
Place of birth for the foreign-born population - Somalia (%)
Place of birth for the foreign-born population - Uganda (%)
Place of birth for the foreign-born population - Zimbabwe (%)
Place of birth for the foreign-born population - Other Eastern Africa (%)
Place of birth for the foreign-born population - Cameroon (%)
Place of birth for the foreign-born population - Congo (%)
Place of birth for the foreign-born population - Democratic Republic of Congo (Zaire) (%)
Place of birth for the foreign-born population - Other Middle Africa (%)
Place of birth for the foreign-born population - Egypt (%)
Place of birth for the foreign-born population - Morocco (%)
Place of birth for the foreign-born population - Sudan (%)
Place of birth for the foreign-born population - Other Northern Africa (%)
Place of birth for the foreign-born population - South Africa (%)
Place of birth for the foreign-born population - Other Southern Africa (%)
Place of birth for the foreign-born population - Cabo Verde (%)
Place of birth for the foreign-born population - Ghana (%)
Place of birth for the foreign-born population - Liberia (%)
Place of birth for the foreign-born population - Nigeria (%)
Place of birth for the foreign-born population - Senegal (%)
Place of birth for the foreign-born population - Sierra Leone (%)
Place of birth for the foreign-born population - Other Western Africa (%)
Place of birth for the foreign-born population - Australia (%)
Place of birth for the foreign-born population - New Zealand (%)
Place of birth for the foreign-born population - Fiji (%)
Place of birth for the foreign-born population - Micronesia (%)
Place of birth for the foreign-born population - Bahamas (%)
Place of birth for the foreign-born population - Barbados (%)
Place of birth for the foreign-born population - Cuba (%)
Place of birth for the foreign-born population - Dominica (%)
Place of birth for the foreign-born population - Dominican Republic (%)
Place of birth for the foreign-born population - Grenada (%)
Place of birth for the foreign-born population - Haiti (%)
Place of birth for the foreign-born population - Jamaica (%)
Place of birth for the foreign-born population - St. Vincent and the Grenadines (%)
Place of birth for the foreign-born population - Trinidad and Tobago (%)
Place of birth for the foreign-born population - West Indies (%)
Place of birth for the foreign-born population - Other Caribbean (%)
Place of birth for the foreign-born population - Belize (%)
Place of birth for the foreign-born population - Costa Rica (%)
Place of birth for the foreign-born population - El Salvador (%)
Place of birth for the foreign-born population - Guatemala (%)
Place of birth for the foreign-born population - Honduras (%)
Place of birth for the foreign-born population - Mexico (%)
Place of birth for the foreign-born population - Nicaragua (%)
Place of birth for the foreign-born population - Panama (%)
Place of birth for the foreign-born population - Other Central America (%)
Place of birth for the foreign-born population - Argentina (%)
Place of birth for the foreign-born population - Bolivia (%)
Place of birth for the foreign-born population - Brazil (%)
Place of birth for the foreign-born population - Chile (%)
Place of birth for the foreign-born population - Colombia (%)
Place of birth for the foreign-born population - Ecuador (%)
Place of birth for the foreign-born population - Guyana (%)
Place of birth for the foreign-born population - Peru (%)
Place of birth for the foreign-born population - Uruguay (%)
Place of birth for the foreign-born population - Venezuela (%)
Place of birth for the foreign-born population - Other South America (%)
Place of birth for the foreign-born population - Canada (%)
Place of birth for the foreign-born population - Other Northern America (%)
Place of birth for the foreign-born population - Other (%)
Latest news about races in Wantagh, NY collected exclusively by city-data.com from local newspapers, TV, and radio stations
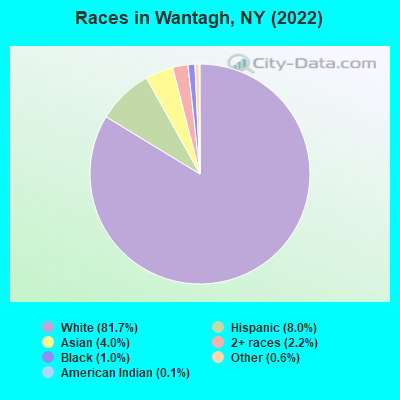
According to 2022 data, the most numerous races in Wantagh, NY are White alone (14,647 residents), Hispanic (1,430 residents), and Black alone (183 residents). 89.5% of Wantagh residents speak English at home. 8.2% of Wantagh, NY residents are foreign-born (3.1% born in Europe, 2.2% born in Asia, 2.0% born in Latin America), which is 169.5% less than the foreign-born rate of 22.0% across the entire state of New York.
Race distribution in Wantagh
2000 2022
11,760,981 62.0% White alone 2,867,583 15.1% Hispanic 2,812,623 14.8% Black alone 1,035,926 5.5% Asian alone 366,116 1.9% Two or more races 75,499 0.4% Other race alone 52,499 0.3% American Indian alone 5,230 0.03% Native Hawaiian and Other
10,408,933 52.9% White alone 3,867,299 19.7% Hispanic 2,633,840 13.4% Black alone 1,776,286 9.0% Asian alone 732,670 3.7% Two or more races 216,110 1.1% Other race alone 35,082 0.2% American Indian alone 6,931 0.04% Native Hawaiian and Other
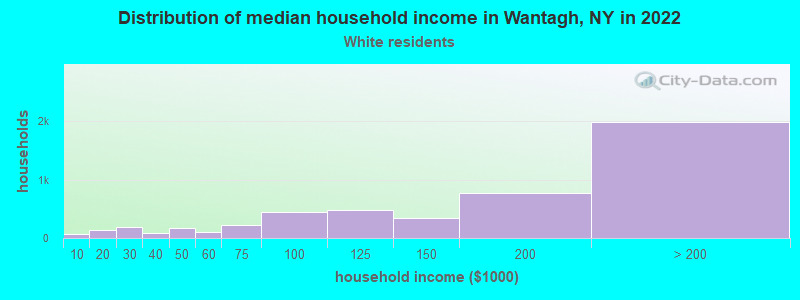
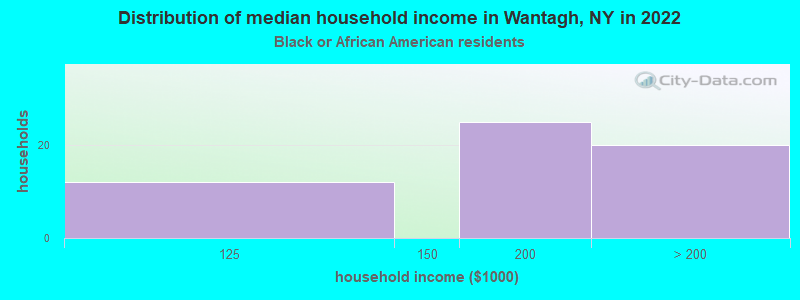
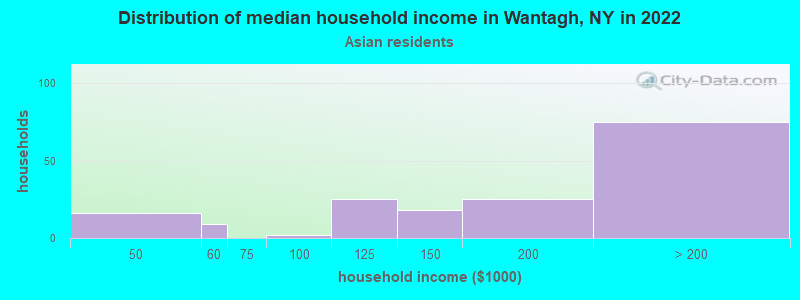
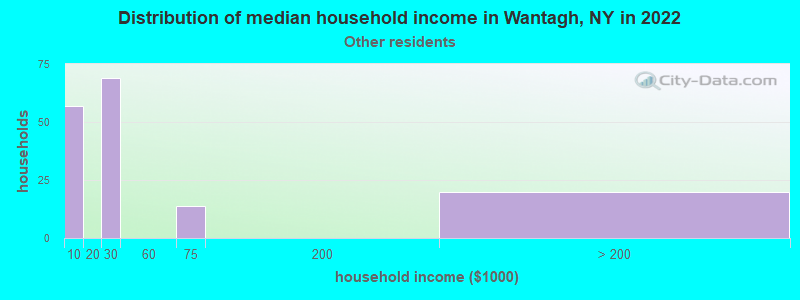
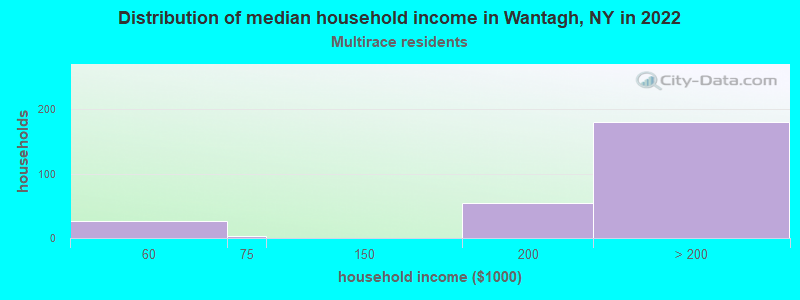
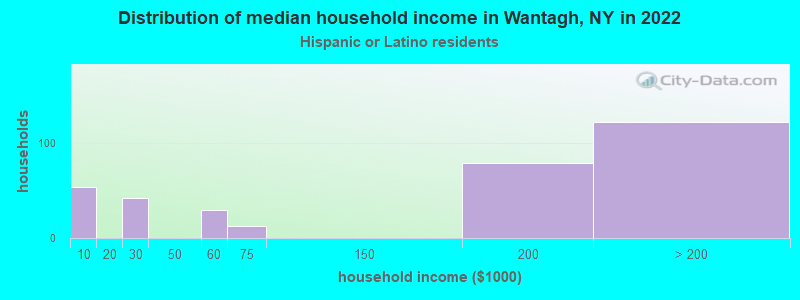
Income and house value in Wantagh Median household income in 2022 $170,658 White non-Hispanic householdersover $200,000 Black householders$178,318 Asian householdersover $200,000 Two or more races householders$195,612 Hispanic or Latino race householdersMedian 2022 house value $672,300 White Non-Hispanic householders$434,043 Black or African American householders $549,165 Asian householders$638,111 Some other race householdersover $1,000,000 Two or more races householders$645,857 Hispanic or Latino householders
Median age by race in Wantagh
43.2 Median age for White residents38.8 47.5 41.8 Median age for Black or African American residents41.6 36.1 76.5 Median age for American Indian / Alaska Native residents-607,543,322.5 -837,121,211.3 40.0 Median age for Asian residents44.1 38.3 -487,992,314.6 Median age for Native Hawaiian / Pacific Islander residents-477,502,295.2 -497,387,669.3 33.2 Median age for Other race residents38.3 31.9 18.9 Median age for Two or more races residents18.4 41.5 43.1 Median age for White alone residents39.4 47.9 22.3 Median age for Hispanic or Latino residents17.2 36.7
Owner/renter occupied households by race in Wantagh
House owners and renters - White residents 4,727 95.5% Owner occupied224 4.5% Renter occupiedHouse owners and renters - Black or African American residents 55 100.0% Owner occupiedHouse owners and renters - American Indian / Alaska Native residents 14 100.0% Owner occupiedHouse owners and renters - Asian residents 172 100.0% Owner occupiedHouse owners and renters - Other race residents 33 27.0% Owner occupied90 73.0% Renter occupiedHouse owners and renters - Two or more races residents 268 100.0% Owner occupiedHouse owners and renters - White alone residents 4,806 95.2% Owner occupied241 4.8% Renter occupiedHouse owners and renters - Hispanic or Latino residents 263 76.0% Owner occupied83 24.0% Renter occupied
Language usage in Wantagh
English speakers - Total 89.5% of residents of Wantagh speak English at home.
3.5% of residents speak Spanish at home 304 51.3% Speak English very well289 48.7% Speak English less than very well6.2% of residents speak other language at home 764 71.4% Speak English very well306 28.6% Speak English less than very well
English speakers - Born in the United States 84.4% of residents of Wantagh speak English at home.
9.6% of residents speak Spanish at home 84 100.0% Speak English less than very well1.1% of residents speak other language at home 10 100.0% Speak English very well
English speakers - Native, born elsewhere 14.8% of residents of Wantagh speak English at home.
81.1% of residents speak Spanish at home 80 80.8% Speak English very well19 19.2% Speak English less than very well
English speakers - Foreign-born 39.8% of residents of Wantagh speak English at home.
15.3% of residents speak Spanish at home 107 46.1% Speak English very well125 53.9% Speak English less than very well43.5% of residents speak other language at home 379 57.6% Speak English very well279 42.4% Speak English less than very well
White (Caucasian) - Speak only English Native:
98.2% (13,332)Foreign-born:
62.8% (392)
White (Caucasian) - Speak another language Native:
2.8% (383)Foreign-born:
44.5% (278)
Black or African American - Speak only English Native:
88.6% (161)Foreign-born:
99.0% (21)
Asian - Speak only English Native:
51.3% (151)Foreign-born:
7.2% (28)
Asian - Speak another language Native:
48.8% (144)Foreign-born:
94.0% (357)
Other race - Speak only English Native:
96.2% (203)Foreign-born:
11.5% (5)
Other race - Speak another language Native:
12.5% (26)Foreign-born:
87.3% (38)
Two or more races - Speak only English Native:
83.8% (677)Foreign-born:
47.3% (173)
Two or more races - Speak another language Native:
11.8% (95)Foreign-born:
48.2% (177)
White alone - Speak only English Native:
98.1% (13,293)Foreign-born:
55.8% (380)
White alone - Speak another language Native:
2.2% (297)Foreign-born:
43.5% (296)
Hispanic or Latino - Speak only English Native:
63.3% (567)Foreign-born:
39.6% (150)
Hispanic or Latino - Speak another language Native:
36.3% (325)Foreign-born:
60.4% (228)
Foreign-born residents in Wantagh 1,463 residents are foreign born (3.1% Europe , 2.2% Asia , 2.0% Latin America ).
This city:
8.2%New York:
22.6%
Marital status for residents in Wantagh Marital status - White (Caucasian) population 15 years and over
Males 36.1% Never married58.3% Now married0.8% Separated1.5% Widowed3.3% DivorcedFemales 23.6% Never married54.6% Now married2.8% Separated10.5% Widowed8.5% DivorcedWomen who gave birth in the past 12 months Now married:
89.7% (116)Unmarried:
10.3% (13)
Women who did not give birth in the past 12 months Now married:
49.3% (1,362)Unmarried:
50.7% (1,401)
Marital status - Black or African American population 15 years and over
Males 40.5% Never married25.9% Now married3.2% Separated0.0% Widowed30.4% DivorcedFemales 30.2% Never married69.8% Now married0.0% Separated0.0% Widowed0.0% DivorcedWomen who gave birth in the past 12 months Now married:
100.0% (11)Unmarried:
0.0% (0)
Women who did not give birth in the past 12 months Now married:
64.3% (17)Unmarried:
35.7% (9)
Marital status - American Indian / Alaska Native population 15 years and over
Males 100.0% Never married0.0% Now married0.0% Separated0.0% Widowed0.0% DivorcedFemales 0.0% Never married58.8% Now married41.2% Separated0.0% Widowed0.0% DivorcedMarital status - Asian population 15 years and over
Males 6.8% Never married85.8% Now married0.0% Separated0.0% Widowed7.4% DivorcedFemales 9.4% Never married86.5% Now married0.0% Separated1.9% Widowed2.2% DivorcedWomen who did not give birth in the past 12 months Now married:
84.5% (221)Unmarried:
15.5% (41)
Marital status - Other race population 15 years and over
Males 23.1% Never married76.9% Now married0.0% Separated0.0% Widowed0.0% DivorcedFemales 67.1% Never married9.1% Now married0.0% Separated0.0% Widowed23.8% DivorcedWomen who did not give birth in the past 12 months Now married:
9.7% (15)Unmarried:
90.3% (138)
Marital status - Two or more races population 15 years and over
Males 70.3% Never married29.7% Now married0.0% Separated0.0% Widowed0.0% DivorcedFemales 21.2% Never married60.8% Now married0.0% Separated6.3% Widowed11.8% DivorcedWomen who gave birth in the past 12 months Now married:
0.0% (0)Unmarried:
100.0% (23)
Women who did not give birth in the past 12 months Now married:
61.4% (53)Unmarried:
38.6% (33)
Marital status - White alone, not Hispanic / Latino population 15 years and over
Males 35.9% Never married58.4% Now married0.8% Separated1.6% Widowed3.3% DivorcedFemales 24.2% Never married53.6% Now married2.8% Separated10.7% Widowed8.7% DivorcedWomen who gave birth in the past 12 months Now married:
89.7% (124)Unmarried:
10.3% (14)
Women who did not give birth in the past 12 months Now married:
47.5% (1,351)Unmarried:
52.5% (1,496)
Marital status - Hispanic or Latino population 15 years and over
Males 59.7% Never married40.3% Now married0.0% Separated0.0% Widowed0.0% DivorcedFemales 24.6% Never married58.9% Now married0.0% Separated3.3% Widowed13.1% DivorcedWomen who gave birth in the past 12 months Now married:
0.0% (0)Unmarried:
100.0% (15)
Women who did not give birth in the past 12 months Now married:
54.1% (139)Unmarried:
45.9% (118)
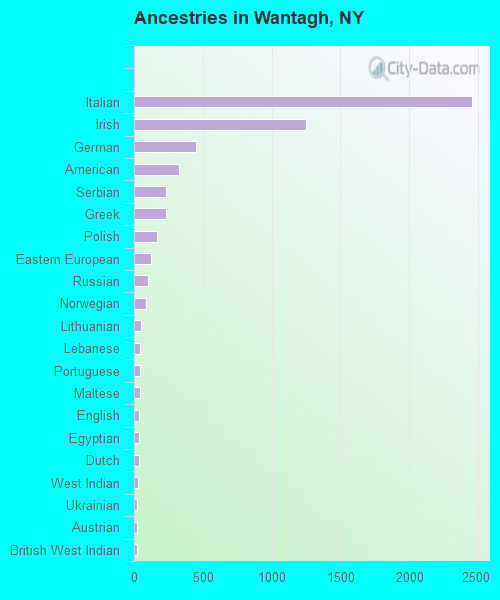
Ancestries in Wantagh
2,456 34.1% Italian1,250 17.3% Irish448 6.2% German330 4.6% American236 3.3% Serbian231 3.2% Greek170 2.4% Polish127 1.8% Eastern European104 1.4% Russian87 1.2% Norwegian52 0.7% Lithuanian46 0.6% Lebanese46 0.6% Portuguese45 0.6% Maltese39 0.5% English36 0.5% Egyptian33 0.5% Dutch31 0.4% West Indian24 0.3% Ukrainian23 0.3% Austrian23 0.3% British West Indian17 0.2% Czechoslovakian17 0.2% Latvian14 0.2% Hungarian13 0.2% Brazilian13 0.2% Croatian12 0.2% Scottish10 0.1% Armenian10 0.1% Macedonian9 0.1% French Canadian7 0.10% Swedish5 0.07% Scandinavian4 0.06% Guyanese
Children Nativity (place of birth) in Wantagh
Children under 6 years - Living with two parents Both parents native 637 100.0% NativeBoth parents foreign-born 56 100.0% NativeOne native, one foreign-born parent 143 100.0% NativeChildren under 6 years - Living with one parent Native parent 51 100.0% NativeChildren 6 to 17 years - Living with two parents Both parents native 1,981 100.0% NativeBoth parents foreign-born 93 96.3% Native4 3.7% Foreign-bornOne native, one foreign-born parent 444 100.0% NativeChildren 6 to 17 years - Living with one parent Native parent 496 100.0% NativeForeign-born parent 288 47.2% Native322 52.8% Foreign-born
Grandparents responsible for own grandchildren in Wantagh
Grandparents (30 to 59 years) White / Caucasian 14 52.7% Responsible for grandchildren12 47.3% Not responsible for grandchildrenWhite alone, not Hispanic / Latino 15 65.3% Responsible for grandchildren8 34.7% Not responsible for grandchildrenGrandparents (60 years and over) White / Caucasian 45 23.0% Responsible for grandchildren151 77.0% Not responsible for grandchildrenWhite alone, not Hispanic / Latino 43 21.1% Responsible for grandchildren159 78.9% Not responsible for grandchildren