Races in Walla Walla, Washington (WA) Detailed Stats
Data:
Races - White alone (%)
Races - White alone (% change since 2000)
Races - Black alone (%)
Races - Black alone (% change since 2000)
Races - American Indian alone (%)
Races - American Indian alone (% change since 2000)
Races - Asian alone (%)
Races - Asian alone (% change since 2000)
Races - Hispanic (%)
Races - Hispanic (% change since 2000)
Races - Native Hawaiian and Other Pacific Islander alone (%)
Races - Native Hawaiian and Other Pacific Islander alone (% change since 2000)
Races - Two or more races(%)
Races - Two or more races(% change since 2000)
Races - Other race alone (%)
Races - Other race alone (% change since 2000)
Racial diversity
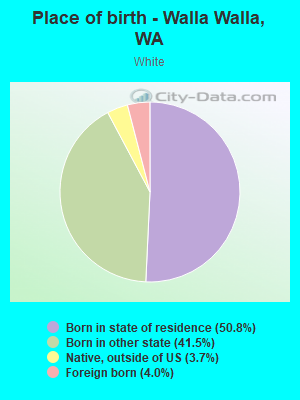
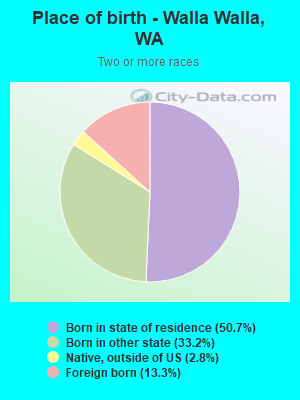
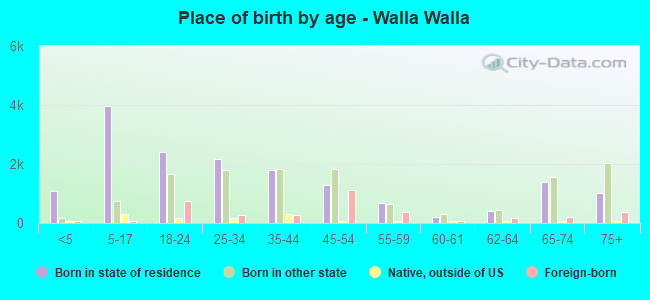
Place of birth - Born in state of residence (%)
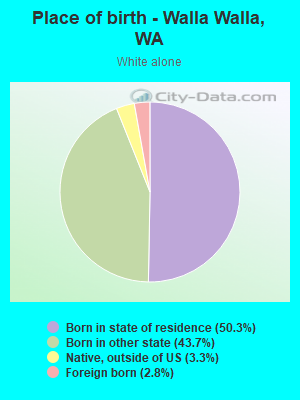
Place of birth - Born in state of residence (%) - White
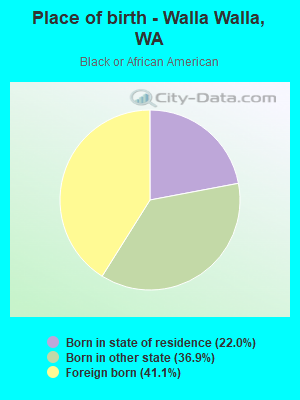
Place of birth - Born in state of residence (%) - Black or African American
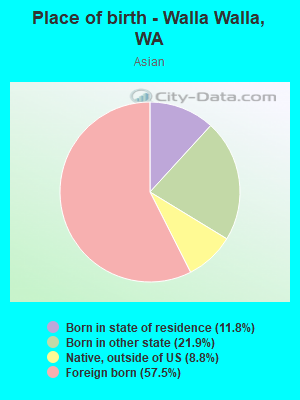
Place of birth - Born in state of residence (%) - Asian
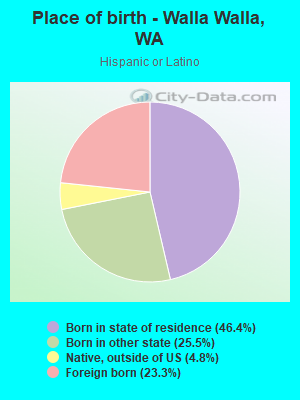
Place of birth - Born in state of residence (%) - Hispanic or Latino
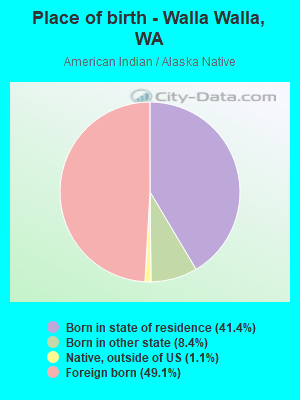
Place of birth - Born in state of residence (%) - American Indian and Alaska Native
Place of birth - Born in state of residence (%) - Multirace
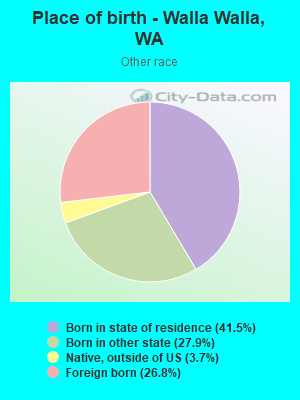
Place of birth - Born in state of residence (%) - Other Race
Place of birth - Born in other state (%)
Place of birth - Born in other state (%) - White
Place of birth - Born in other state (%) - Black or African American
Place of birth - Born in other state (%) - Asian
Place of birth - Born in other state (%) - Hispanic or Latino
Place of birth - Born in other state (%) - American Indian and Alaska Native
Place of birth - Born in other state (%) - Multirace
Place of birth - Born in other state (%) - Other Race
Place of birth - Native, outside of US (%)
Place of birth - Native, outside of US (%) - White
Place of birth - Native, outside of US (%) - Black or African American
Place of birth - Native, outside of US (%) - Asian
Place of birth - Native, outside of US (%) - Hispanic or Latino
Place of birth - Native, outside of US (%) - American Indian and Alaska Native
Place of birth - Native, outside of US (%) - Multirace
Place of birth - Native, outside of US (%) - Other Race
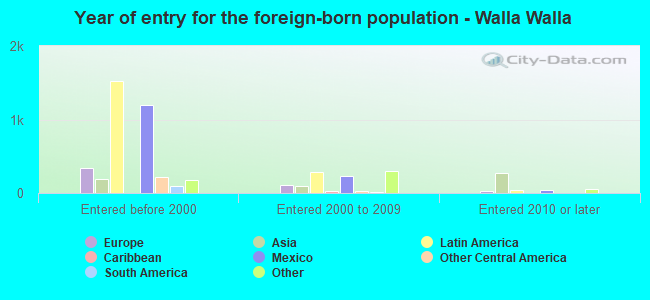
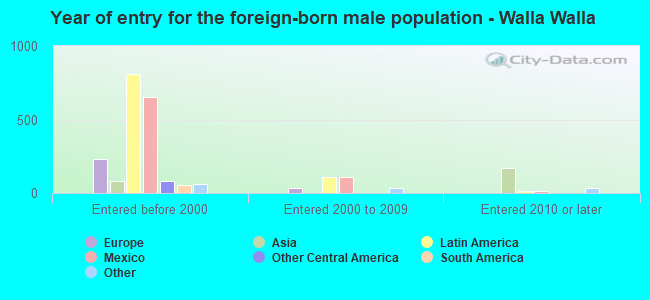
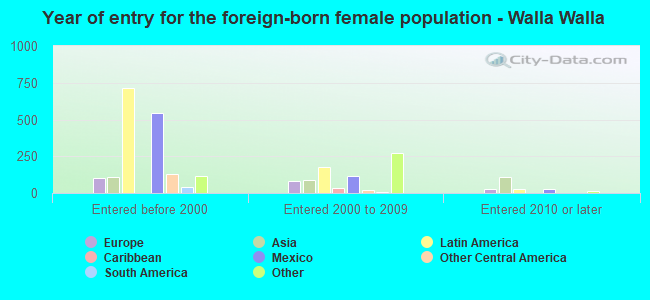
Place of birth - Foreign born (%)
Place of birth - Foreign born (%) - White
Place of birth - Foreign born (%) - Black or African American
Place of birth - Foreign born (%) - Asian
Place of birth - Foreign born (%) - Hispanic or Latino
Place of birth - Foreign born (%) - American Indian and Alaska Native
Place of birth - Foreign born (%) - Multirace
Place of birth - Foreign born (%) - Other Race
Residents speaking English at home (%)
Residents speaking English at home - Born in the United States (%)
Residents speaking English at home - Native, born elsewhere (%)
Residents speaking English at home - Foreign born (%)
Residents speaking Spanish at home (%)
Residents speaking Spanish at home - Born in the United States (%)
Residents speaking Spanish at home - Native, born elsewhere (%)
Residents speaking Spanish at home - Foreign born (%)
Residents speaking other language at home (%)
Residents speaking other language at home - Born in the United States (%)
Residents speaking other language at home - Native, born elsewhere (%)
Residents speaking other language at home - Foreign born (%)
Marital status - Never married (%)
Marital status - Now married (%)
Marital status - Separated (%)
Marital status - Widowed (%)
Marital status - Divorced (%)
Ancestries Reported - Arab (%)
Ancestries Reported - Czech (%)
Ancestries Reported - Danish (%)
Ancestries Reported - Dutch (%)
Ancestries Reported - English (%)
Ancestries Reported - French (%)
Ancestries Reported - French Canadian (%)
Ancestries Reported - German (%)
Ancestries Reported - Greek (%)
Ancestries Reported - Hungarian (%)
Ancestries Reported - Irish (%)
Ancestries Reported - Italian (%)
Ancestries Reported - Lithuanian (%)
Ancestries Reported - Norwegian (%)
Ancestries Reported - Polish (%)
Ancestries Reported - Portuguese (%)
Ancestries Reported - Russian (%)
Ancestries Reported - Scotch-Irish (%)
Ancestries Reported - Scottish (%)
Ancestries Reported - Slovak (%)
Ancestries Reported - Subsaharan African (%)
Ancestries Reported - Swedish (%)
Ancestries Reported - Swiss (%)
Ancestries Reported - Ukrainian (%)
Ancestries Reported - United States (%)
Ancestries Reported - Welsh (%)
Ancestries Reported - West Indian (%)
Ancestries Reported - Other (%)
Geographical mobility - Same house 1 year ago (%)
Geographical mobility - Same house 1 year ago (%) - White
Geographical mobility - Same house 1 year ago (%) - Black or African American
Geographical mobility - Same house 1 year ago (%) - Asian
Geographical mobility - Same house 1 year ago (%) - Hispanic or Latino
Geographical mobility - Same house 1 year ago (%) - American Indian and Alaska Native
Geographical mobility - Same house 1 year ago (%) - Multirace
Geographical mobility - Same house 1 year ago (%) - Other Race
Geographical mobility - Moved within same county (%)
Geographical mobility - Moved within same county (%) - White
Geographical mobility - Moved within same county (%) - Black or African American
Geographical mobility - Moved within same county (%) - Asian
Geographical mobility - Moved within same county (%) - Hispanic or Latino
Geographical mobility - Moved within same county (%) - American Indian and Alaska Native
Geographical mobility - Moved within same county (%) - Multirace
Geographical mobility - Moved within same county (%) - Other Race
Geographical mobility - Moved from different county within same state (%)
Geographical mobility - Moved from different county within same state (%) - White
Geographical mobility - Moved from different county within same state (%) - Black or African American
Geographical mobility - Moved from different county within same state (%) - Asian
Geographical mobility - Moved from different county within same state (%) - Hispanic or Latino
Geographical mobility - Moved from different county within same state (%) - American Indian and Alaska Native
Geographical mobility - Moved from different county within same state (%) - Multirace
Geographical mobility - Moved from different county within same state (%) - Other Race
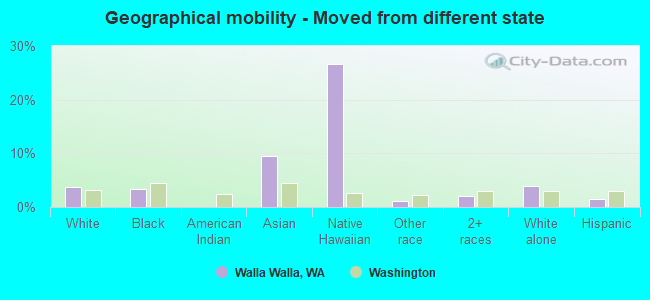
Geographical mobility - Moved from different state (%)
Geographical mobility - Moved from different state (%) - White
Geographical mobility - Moved from different state (%) - Black or African American
Geographical mobility - Moved from different state (%) - Asian
Geographical mobility - Moved from different state (%) - Hispanic or Latino
Geographical mobility - Moved from different state (%) - American Indian and Alaska Native
Geographical mobility - Moved from different state (%) - Multirace
Geographical mobility - Moved from different state (%) - Other Race
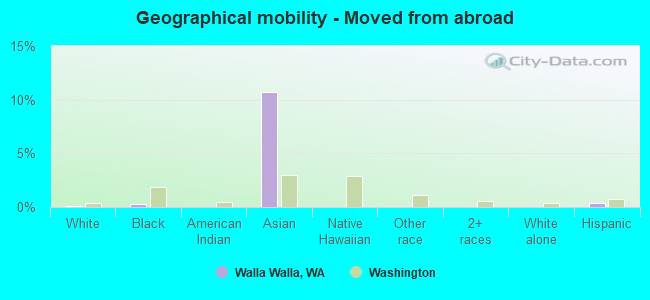
Geographical mobility - Moved from abroad (%)
Geographical mobility - Moved from abroad (%) - White
Geographical mobility - Moved from abroad (%) - Black or African American
Geographical mobility - Moved from abroad (%) - Asian
Geographical mobility - Moved from abroad (%) - Hispanic or Latino
Geographical mobility - Moved from abroad (%) - American Indian and Alaska Native
Geographical mobility - Moved from abroad (%) - Multirace
Geographical mobility - Moved from abroad (%) - Other Race
Place of birth for the foreign-born population - Ireland (%)
Place of birth for the foreign-born population - Denmark (%)
Place of birth for the foreign-born population - Norway (%)
Place of birth for the foreign-born population - Sweden (%)
Place of birth for the foreign-born population - United Kingdom (%)
Place of birth for the foreign-born population - England (%)
Place of birth for the foreign-born population - Scotland (%)
Place of birth for the foreign-born population - Other Northern Europe (%)
Place of birth for the foreign-born population - Austria (%)
Place of birth for the foreign-born population - Belgium (%)
Place of birth for the foreign-born population - France (%)
Place of birth for the foreign-born population - Germany (%)
Place of birth for the foreign-born population - Netherlands (%)
Place of birth for the foreign-born population - Switzerland (%)
Place of birth for the foreign-born population - Other Western Europe (%)
Place of birth for the foreign-born population - Greece (%)
Place of birth for the foreign-born population - Italy (%)
Place of birth for the foreign-born population - Portugal (%)
Place of birth for the foreign-born population - Spain (%)
Place of birth for the foreign-born population - Other Southern Europe (%)
Place of birth for the foreign-born population - Albania (%)
Place of birth for the foreign-born population - Belarus (%)
Place of birth for the foreign-born population - Bosnia and Herzegovina (%)
Place of birth for the foreign-born population - Bulgaria (%)
Place of birth for the foreign-born population - Croatia (%)
Place of birth for the foreign-born population - Czechoslovakia (%)
Place of birth for the foreign-born population - Hungary (%)
Place of birth for the foreign-born population - Latvia (%)
Place of birth for the foreign-born population - Lithuania (%)
Place of birth for the foreign-born population - North Macedonia (Macedonia) (%)
Place of birth for the foreign-born population - Moldova (%)
Place of birth for the foreign-born population - Poland (%)
Place of birth for the foreign-born population - Romania (%)
Place of birth for the foreign-born population - Russia (%)
Place of birth for the foreign-born population - Serbia (%)
Place of birth for the foreign-born population - Ukraine (%)
Place of birth for the foreign-born population - Other Eastern Europe (%)
Place of birth for the foreign-born population - China (%)
Place of birth for the foreign-born population - Hong Kong (%)
Place of birth for the foreign-born population - Taiwan (%)
Place of birth for the foreign-born population - Japan (%)
Place of birth for the foreign-born population - Korea (%)
Place of birth for the foreign-born population - Other Eastern Asia (%)
Place of birth for the foreign-born population - Afghanistan (%)
Place of birth for the foreign-born population - Bangladesh (%)
Place of birth for the foreign-born population - India (%)
Place of birth for the foreign-born population - Iran (%)
Place of birth for the foreign-born population - Kazakhstan (%)
Place of birth for the foreign-born population - Nepal (%)
Place of birth for the foreign-born population - Pakistan (%)
Place of birth for the foreign-born population - Sri Lanka (%)
Place of birth for the foreign-born population - Uzbekistan (%)
Place of birth for the foreign-born population - Other South Central Asia (%)
Place of birth for the foreign-born population - Burma (%)
Place of birth for the foreign-born population - Cambodia (%)
Place of birth for the foreign-born population - Indonesia (%)
Place of birth for the foreign-born population - Laos (%)
Place of birth for the foreign-born population - Malaysia (%)
Place of birth for the foreign-born population - Philippines (%)
Place of birth for the foreign-born population - Singapore (%)
Place of birth for the foreign-born population - Thailand (%)
Place of birth for the foreign-born population - Vietnam (%)
Place of birth for the foreign-born population - Other South Eastern Asia (%)
Place of birth for the foreign-born population - Armenia (%)
Place of birth for the foreign-born population - Iraq (%)
Place of birth for the foreign-born population - Israel (%)
Place of birth for the foreign-born population - Jordan (%)
Place of birth for the foreign-born population - Kuwait (%)
Place of birth for the foreign-born population - Lebanon (%)
Place of birth for the foreign-born population - Saudi Arabia (%)
Place of birth for the foreign-born population - Syria (%)
Place of birth for the foreign-born population - Turkey (%)
Place of birth for the foreign-born population - Yemen (%)
Place of birth for the foreign-born population - Other Western Asia (%)
Place of birth for the foreign-born population - Eritrea (%)
Place of birth for the foreign-born population - Ethiopia (%)
Place of birth for the foreign-born population - Kenya (%)
Place of birth for the foreign-born population - Somalia (%)
Place of birth for the foreign-born population - Uganda (%)
Place of birth for the foreign-born population - Zimbabwe (%)
Place of birth for the foreign-born population - Other Eastern Africa (%)
Place of birth for the foreign-born population - Cameroon (%)
Place of birth for the foreign-born population - Congo (%)
Place of birth for the foreign-born population - Democratic Republic of Congo (Zaire) (%)
Place of birth for the foreign-born population - Other Middle Africa (%)
Place of birth for the foreign-born population - Egypt (%)
Place of birth for the foreign-born population - Morocco (%)
Place of birth for the foreign-born population - Sudan (%)
Place of birth for the foreign-born population - Other Northern Africa (%)
Place of birth for the foreign-born population - South Africa (%)
Place of birth for the foreign-born population - Other Southern Africa (%)
Place of birth for the foreign-born population - Cabo Verde (%)
Place of birth for the foreign-born population - Ghana (%)
Place of birth for the foreign-born population - Liberia (%)
Place of birth for the foreign-born population - Nigeria (%)
Place of birth for the foreign-born population - Senegal (%)
Place of birth for the foreign-born population - Sierra Leone (%)
Place of birth for the foreign-born population - Other Western Africa (%)
Place of birth for the foreign-born population - Australia (%)
Place of birth for the foreign-born population - New Zealand (%)
Place of birth for the foreign-born population - Fiji (%)
Place of birth for the foreign-born population - Micronesia (%)
Place of birth for the foreign-born population - Bahamas (%)
Place of birth for the foreign-born population - Barbados (%)
Place of birth for the foreign-born population - Cuba (%)
Place of birth for the foreign-born population - Dominica (%)
Place of birth for the foreign-born population - Dominican Republic (%)
Place of birth for the foreign-born population - Grenada (%)
Place of birth for the foreign-born population - Haiti (%)
Place of birth for the foreign-born population - Jamaica (%)
Place of birth for the foreign-born population - St. Vincent and the Grenadines (%)
Place of birth for the foreign-born population - Trinidad and Tobago (%)
Place of birth for the foreign-born population - West Indies (%)
Place of birth for the foreign-born population - Other Caribbean (%)
Place of birth for the foreign-born population - Belize (%)
Place of birth for the foreign-born population - Costa Rica (%)
Place of birth for the foreign-born population - El Salvador (%)
Place of birth for the foreign-born population - Guatemala (%)
Place of birth for the foreign-born population - Honduras (%)
Place of birth for the foreign-born population - Mexico (%)
Place of birth for the foreign-born population - Nicaragua (%)
Place of birth for the foreign-born population - Panama (%)
Place of birth for the foreign-born population - Other Central America (%)
Place of birth for the foreign-born population - Argentina (%)
Place of birth for the foreign-born population - Bolivia (%)
Place of birth for the foreign-born population - Brazil (%)
Place of birth for the foreign-born population - Chile (%)
Place of birth for the foreign-born population - Colombia (%)
Place of birth for the foreign-born population - Ecuador (%)
Place of birth for the foreign-born population - Guyana (%)
Place of birth for the foreign-born population - Peru (%)
Place of birth for the foreign-born population - Uruguay (%)
Place of birth for the foreign-born population - Venezuela (%)
Place of birth for the foreign-born population - Other South America (%)
Place of birth for the foreign-born population - Canada (%)
Place of birth for the foreign-born population - Other Northern America (%)
Place of birth for the foreign-born population - Other (%)
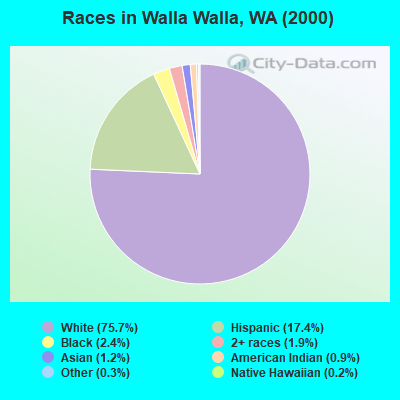
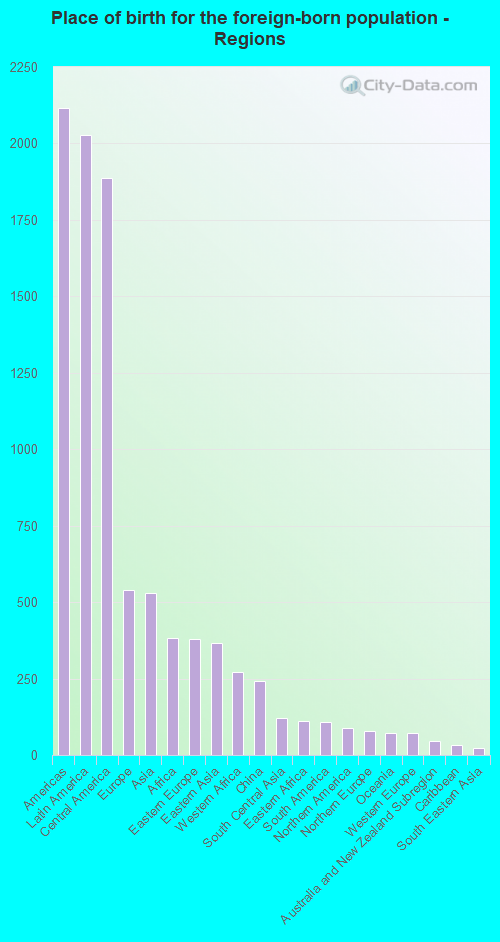
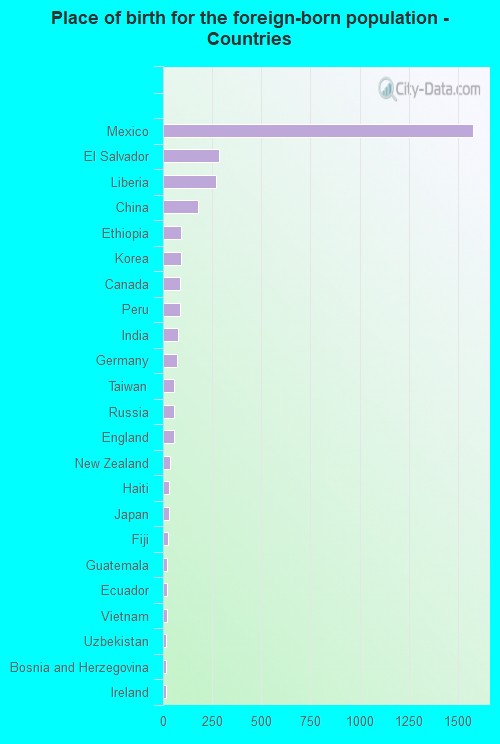
According to 2022 data, the most numerous races in Walla Walla, WA are White alone (22,118 residents), Hispanic (8,426 residents), and Asian alone (859 residents). 78.6% of Walla Walla residents speak English at home. 10.6% of Walla Walla, WA residents are foreign-born (5.8% born in Latin America, 1.5% born in Europe, 1.5% born in Asia, 1.1% born in Africa), which is 41.1% less than the foreign-born rate of 15.0% across the entire state of Washington.
Race distribution in Walla Walla
2000 2022
4,652,490 78.9% White alone 441,509 7.5% Hispanic 319,401 5.4% Asian alone 184,631 3.1% Black alone 175,926 3.0% Two or more races 85,396 1.4% American Indian alone 22,779 0.4% Native Hawaiian and Other 11,989 0.2% Other race alone
4,941,456 63.5% White alone 1,093,313 14.0% Hispanic 755,832 9.7% Asian alone 523,448 6.7% Two or more races 299,537 3.8% Black alone 69,024 0.9% American Indian alone 52,231 0.7% Native Hawaiian and Other 50,945 0.7% Other race alone
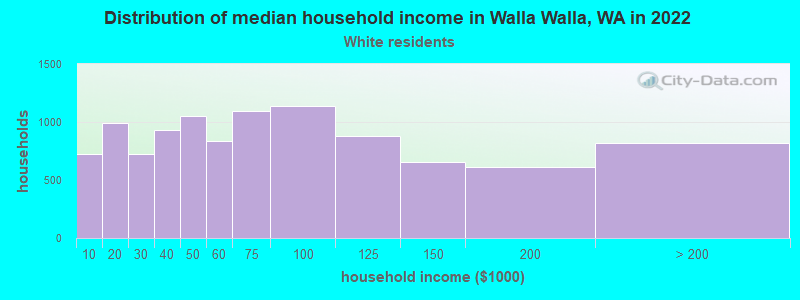
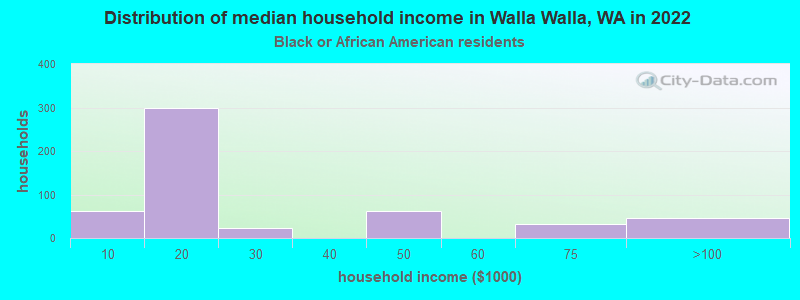
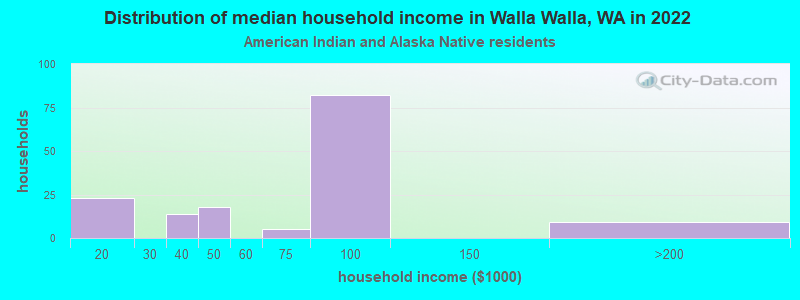
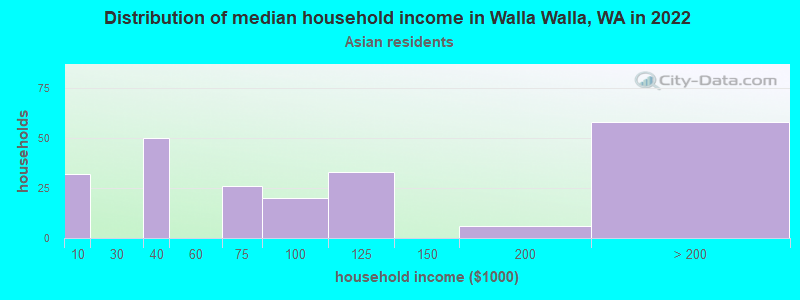
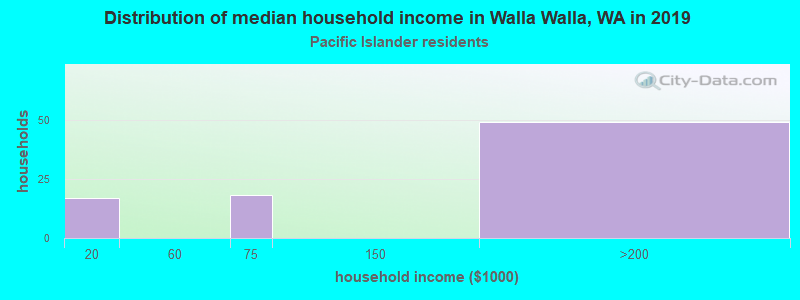
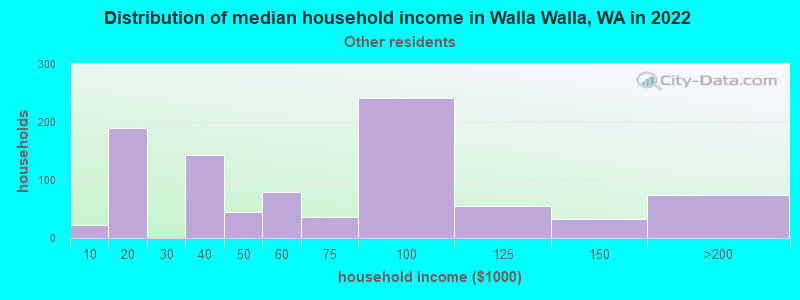
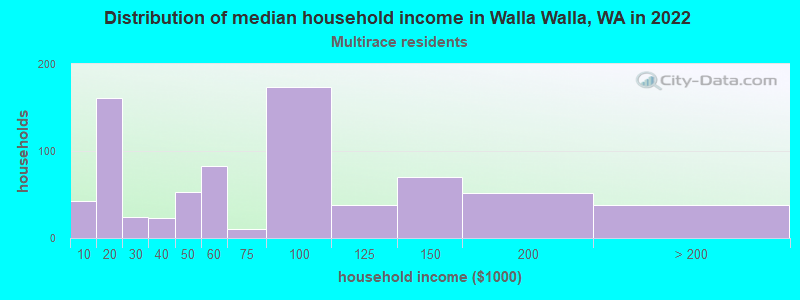
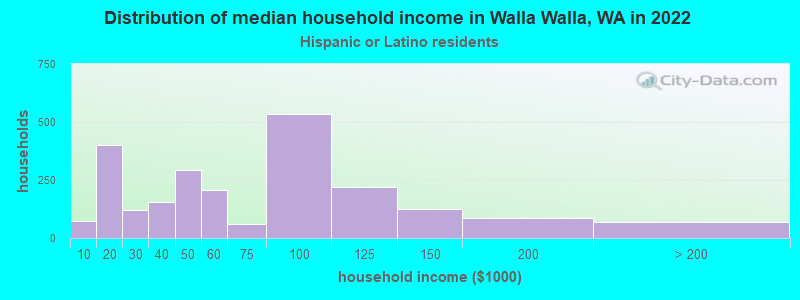
Income and house value in Walla Walla Median household income in 2022 $61,534 White non-Hispanic householders$14,549 Black householders$89,574 American Indian and Alaska Native householders$91,347 Asian householders$116,470 Native Hawaiian and other Pacific Islander householders$62,622 Some other race householders$56,712 Two or more races householders$57,712 Hispanic or Latino race householdersMedian 2022 house value $409,904 White Non-Hispanic householders$411,852 Black or African American householders$662,393 American Indian or Alaska Native householders $311,714 Asian householders$258,722 Some other race householders$314,441 Two or more races householders$261,840 Hispanic or Latino householders
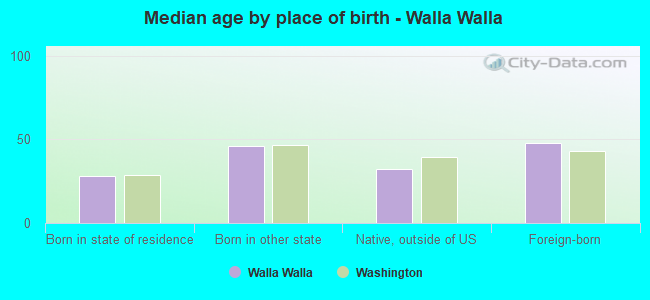
Median age by race in Walla Walla
41.2 Median age for White residents39.5 44.0 32.7 Median age for Black or African American residents41.7 21.7 32.5 Median age for American Indian / Alaska Native residents32.3 32.7 29.0 Median age for Asian residents25.5 40.8 29.2 Median age for Native Hawaiian / Pacific Islander residents31.5 19.7 27.1 Median age for Other race residents27.1 26.2 24.9 Median age for Two or more races residents36.0 21.9 43.5 Median age for White alone residents40.5 45.9 27.2 Median age for Hispanic or Latino residents27.0 27.2
Owner/renter occupied households by race in Walla Walla
House owners and renters - White residents 6,537 62.3% Owner occupied3,949 37.7% Renter occupiedHouse owners and renters - Black or African American residents 295 55.6% Owner occupied235 44.4% Renter occupiedHouse owners and renters - American Indian / Alaska Native residents 108 71.6% Owner occupied43 28.4% Renter occupiedHouse owners and renters - Asian residents 142 66.0% Owner occupied73 34.0% Renter occupiedHouse owners and renters - Native Hawaiian / Pacific Islander residents 19 58.3% Owner occupied14 41.7% Renter occupiedHouse owners and renters - Other race residents 544 59.8% Owner occupied365 40.2% Renter occupiedHouse owners and renters - Two or more races residents 329 43.1% Owner occupied435 56.9% Renter occupiedHouse owners and renters - White alone residents 6,179 63.9% Owner occupied3,496 36.1% Renter occupiedHouse owners and renters - Hispanic or Latino residents 1,202 50.4% Owner occupied1,181 49.6% Renter occupied
Language usage in Walla Walla
English speakers - Total 78.6% of residents of Walla Walla speak English at home.
16.6% of residents speak Spanish at home 3,313 60.3% Speak English very well2,185 39.7% Speak English less than very well4.5% of residents speak other language at home 1,097 73.4% Speak English very well397 26.6% Speak English less than very well
English speakers - Born in the United States 87.8% of residents of Walla Walla speak English at home.
11.2% of residents speak Spanish at home 1,141 79.8% Speak English very well288 20.2% Speak English less than very well1.5% of residents speak other language at home 194 100.0% Speak English very well
English speakers - Native, born elsewhere 65.0% of residents of Walla Walla speak English at home.
28.5% of residents speak Spanish at home 118 32.0% Speak English very well251 68.0% Speak English less than very well6.3% of residents speak other language at home 82 100.0% Speak English very well
English speakers - Foreign-born 24.1% of residents of Walla Walla speak English at home.
49.8% of residents speak Spanish at home 436 24.1% Speak English very well1,371 75.9% Speak English less than very well25.0% of residents speak other language at home 525 57.8% Speak English very well384 42.2% Speak English less than very well
White (Caucasian) - Speak only English Native:
93.0% (21,034)Foreign-born:
28.4% (279)
White (Caucasian) - Speak another language Native:
6.3% (1,423)Foreign-born:
70.9% (698)
Black or African American - Speak only English Native:
96.7% (595)Foreign-born:
81.8% (341)
Black or African American - Speak another language Native:
4.2% (26)Foreign-born:
26.1% (109)
American Indian / Alaska Native - Speak only English Native:
41.8% (175)Foreign-born:
1.4% (6)
American Indian / Alaska Native - Speak another language Native:
66.1% (277)Foreign-born:
100.0% (408)
Asian - Speak only English Native:
48.7% (177)Foreign-born:
42.2% (214)
Asian - Speak another language Native:
51.7% (188)Foreign-born:
59.4% (301)
Native Hawaiian / Pacific Islander - Speak only English Native:
72.3% (74)Foreign-born:
87.3% (21)
Native Hawaiian / Pacific Islander - Speak another language Native:
24.9% (26)Foreign-born:
23.0% (6)
Other race - Speak only English Native:
43.7% (967)Foreign-born:
1.8% (15)
Other race - Speak another language Native:
56.6% (1,251)Foreign-born:
98.2% (840)
Two or more races - Speak only English Native:
67.4% (1,997)Foreign-born:
6.2% (31)
Two or more races - Speak another language Native:
36.0% (1,068)Foreign-born:
94.8% (477)
White alone - Speak only English Native:
96.6% (20,247)Foreign-born:
28.9% (180)
White alone - Speak another language Native:
3.4% (710)Foreign-born:
72.0% (447)
Hispanic or Latino - Speak only English Native:
44.3% (2,633)Foreign-born:
8.4% (165)
Hispanic or Latino - Speak another language Native:
54.9% (3,261)Foreign-born:
91.5% (1,799)
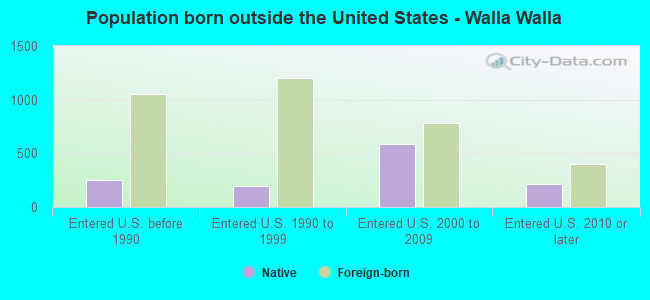
Foreign-born residents in Walla Walla 3,644 residents are foreign born (5.8% Latin America , 1.5% Europe , 1.5% Asia , 1.1% Africa ).
This city:
10.6%Washington:
14.9%
Marital status for residents in Walla Walla Marital status - White (Caucasian) population 15 years and over
Males 39.3% Never married42.8% Now married2.2% Separated3.9% Widowed11.9% DivorcedFemales 26.5% Never married43.3% Now married4.1% Separated11.6% Widowed14.5% DivorcedWomen who gave birth in the past 12 months Now married:
58.2% (50)Unmarried:
41.8% (36)
Women who did not give birth in the past 12 months Now married:
44.8% (2,381)Unmarried:
55.2% (2,930)
Marital status - Black or African American population 15 years and over
Males 52.6% Never married18.7% Now married13.8% Separated0.0% Widowed14.9% DivorcedFemales 82.0% Never married9.6% Now married0.0% Separated0.0% Widowed8.3% DivorcedWomen who did not give birth in the past 12 months Now married:
11.6% (52)Unmarried:
88.4% (396)
Marital status - American Indian / Alaska Native population 15 years and over
Males 60.6% Never married31.3% Now married0.0% Separated0.0% Widowed8.1% DivorcedFemales 38.4% Never married32.6% Now married13.4% Separated3.3% Widowed12.4% DivorcedWomen who did not give birth in the past 12 months Now married:
8.9% (17)Unmarried:
91.1% (170)
Marital status - Asian population 15 years and over
Males 64.7% Never married27.6% Now married0.0% Separated0.0% Widowed7.7% DivorcedFemales 34.3% Never married53.8% Now married0.0% Separated8.1% Widowed3.9% DivorcedWomen who gave birth in the past 12 months Now married:
100.0% (25)Unmarried:
0.0% (0)
Women who did not give birth in the past 12 months Now married:
50.2% (145)Unmarried:
49.8% (144)
Marital status - Native Hawaiian / Pacific Islander population 15 years and over
Males 81.8% Never married18.2% Now married0.0% Separated0.0% Widowed0.0% DivorcedFemales 82.9% Never married17.1% Now married0.0% Separated0.0% Widowed0.0% DivorcedWomen who did not give birth in the past 12 months Now married:
17.1% (6)Unmarried:
82.9% (31)
Marital status - Other race population 15 years and over
Males 54.7% Never married36.6% Now married0.4% Separated0.0% Widowed8.3% DivorcedFemales 37.9% Never married41.0% Now married6.9% Separated1.3% Widowed12.9% DivorcedWomen who gave birth in the past 12 months Now married:
23.8% (6)Unmarried:
76.2% (19)
Women who did not give birth in the past 12 months Now married:
48.3% (376)Unmarried:
51.7% (401)
Marital status - Two or more races population 15 years and over
Males 50.3% Never married24.6% Now married7.4% Separated1.2% Widowed16.5% DivorcedFemales 68.3% Never married21.4% Now married0.1% Separated3.4% Widowed6.8% DivorcedWomen who did not give birth in the past 12 months Now married:
7.3% (63)Unmarried:
92.7% (791)
Marital status - White alone, not Hispanic / Latino population 15 years and over
Males 38.0% Never married43.1% Now married2.4% Separated4.2% Widowed12.3% DivorcedFemales 25.1% Never married43.0% Now married4.2% Separated12.7% Widowed15.0% DivorcedWomen who gave birth in the past 12 months Now married:
100.0% (52)Unmarried:
0.0% (0)
Women who did not give birth in the past 12 months Now married:
45.1% (2,097)Unmarried:
54.9% (2,553)
Marital status - Hispanic or Latino population 15 years and over
Males 51.5% Never married35.3% Now married3.0% Separated0.1% Widowed10.1% DivorcedFemales 43.3% Never married40.4% Now married4.8% Separated1.6% Widowed9.9% DivorcedWomen who gave birth in the past 12 months Now married:
8.5% (5)Unmarried:
91.5% (57)
Women who did not give birth in the past 12 months Now married:
36.3% (763)Unmarried:
63.7% (1,339)
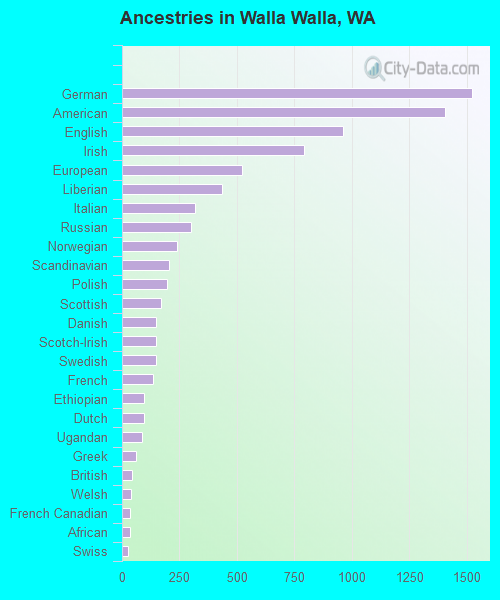
Ancestries in Walla Walla
1,520 9.5% German1,406 8.7% American961 6.0% English793 4.9% Irish524 3.3% European437 2.7% Liberian319 2.0% Italian300 1.9% Russian240 1.5% Norwegian204 1.3% Scandinavian197 1.2% Polish168 1.0% Scottish149 0.9% Danish147 0.9% Scotch-Irish147 0.9% Swedish134 0.8% French95 0.6% Ethiopian94 0.6% Dutch86 0.5% Ugandan61 0.4% Greek43 0.3% British40 0.2% Welsh34 0.2% French Canadian33 0.2% African27 0.2% Swiss25 0.2% Eastern European24 0.1% Yugoslavian22 0.1% Canadian21 0.1% Finnish14 0.09% Northern European14 0.09% Ukrainian14 0.09% Czech12 0.07% Estonian12 0.07% Czechoslovakian11 0.07% Portuguese11 0.07% Turkish10 0.06% Lithuanian9 0.06% New Zealander2 0.01% Kenyan
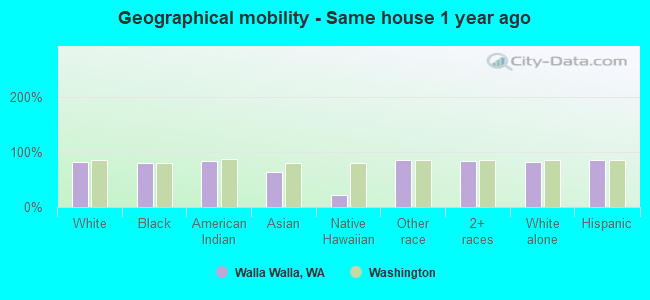
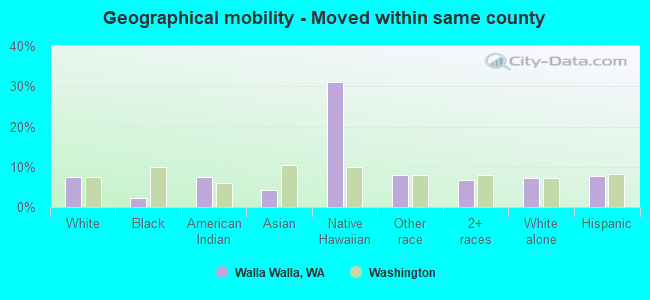
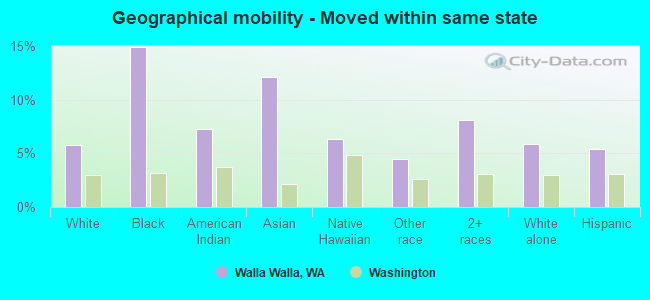
Geographical mobility in Walla Walla Same house 1 year ago 19,968 82.8% White (Caucasian)828 80.7% Black or African American631 84.0% American Indian / Alaska Native560 63.6% Asian28 22.6% Native Hawaiian / Pacific Islander2,727 86.1% Other race3,151 83.0% Two or more races18,309 82.9% White alone, not Hispanic / Latino7,049 85.2% Hispanic or LatinoMoved within same county 1,813 7.5% White / Caucasian22 2.2% Black or African American56 7.5% American Indian / Alaska Native37 4.2% Asian39 31.1% Native Hawaiian / Pacific Islander252 8.0% Other race257 6.8% Two or more races1,595 7.2% White alone, not Hispanic / Latino637 7.7% Hispanic or LatinoMoved within same state 1,396 5.8% White / Caucasian153 14.9% Black or African American55 7.3% American Indian / Alaska Native107 12.1% Asian8 6.3% Native Hawaiian / Pacific Islander141 4.4% Other race306 8.1% Two or more races1,302 5.9% White alone, not Hispanic / Latino451 5.4% Hispanic or LatinoMoved from different state 910 3.8% White / Caucasian34 3.4% Black or African American83 9.4% Asian34 26.6% Native Hawaiian / Pacific Islander33 1.0% Other race80 2.1% Two or more races878 4.0% White alone, not Hispanic / Latino127 1.5% Hispanic or LatinoMoved from abroad 30 0.1% White3 0.3% Black or African American94 10.7% Asian5 0.0% White alone, not Hispanic / Latino31 0.4% Hispanic or Latino
Children Nativity (place of birth) in Walla Walla
Children under 6 years - Living with two parents Both parents native 717 98.5% Native11 1.5% Foreign-bornBoth parents foreign-born 40 100.0% NativeOne native, one foreign-born parent 59 100.0% NativeChildren under 6 years - Living with one parent Native parent 362 100.0% NativeForeign-born parent 184 100.0% NativeChildren 6 to 17 years - Living with two parents Both parents native 2,249 99.7% Native7 0.3% Foreign-bornBoth parents foreign-born 309 100.0% NativeOne native, one foreign-born parent 156 100.0% NativeChildren 6 to 17 years - Living with one parent Native parent 1,696 100.0% NativeForeign-born parent 394 50.6% Native384 49.4% Foreign-born
Grandparents responsible for own grandchildren in Walla Walla
Grandparents (30 to 59 years) White / Caucasian 23 46.1% Responsible for grandchildren27 53.9% Not responsible for grandchildrenOther race 15 100.0% Not responsible for grandchildrenWhite alone, not Hispanic / Latino 22 43.4% Responsible for grandchildren29 56.6% Not responsible for grandchildrenHispanic or Latino 12 100.0% Not responsible for grandchildrenGrandparents (60 years and over) White / Caucasian 29 11.1% Responsible for grandchildren232 88.9% Not responsible for grandchildrenOther race 78 100.0% Not responsible for grandchildrenWhite alone, not Hispanic / Latino 30 16.0% Responsible for grandchildren156 84.0% Not responsible for grandchildrenHispanic or Latino 165 100.0% Not responsible for grandchildren