Races in Walker, Michigan (MI) Detailed Stats
Data:
Races - White alone (%)
Races - White alone (% change since 2000)
Races - Black alone (%)
Races - Black alone (% change since 2000)
Races - American Indian alone (%)
Races - American Indian alone (% change since 2000)
Races - Asian alone (%)
Races - Asian alone (% change since 2000)
Races - Hispanic (%)
Races - Hispanic (% change since 2000)
Races - Native Hawaiian and Other Pacific Islander alone (%)
Races - Native Hawaiian and Other Pacific Islander alone (% change since 2000)
Races - Two or more races(%)
Races - Two or more races(% change since 2000)
Races - Other race alone (%)
Races - Other race alone (% change since 2000)
Racial diversity
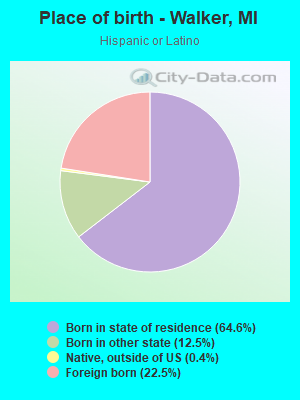
Place of birth - Born in state of residence (%)
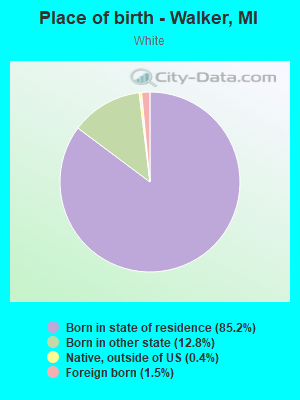
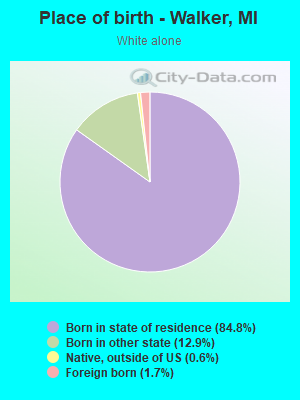
Place of birth - Born in state of residence (%) - White
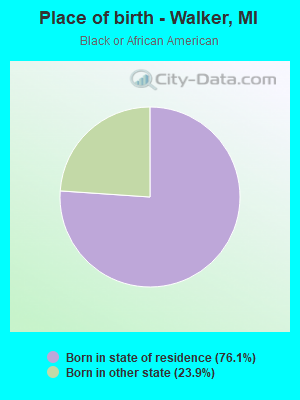
Place of birth - Born in state of residence (%) - Black or African American
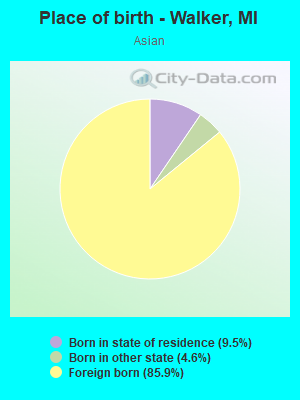
Place of birth - Born in state of residence (%) - Asian
Place of birth - Born in state of residence (%) - Hispanic or Latino
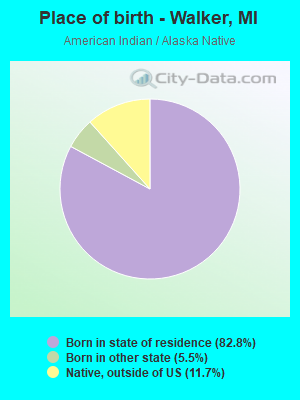
Place of birth - Born in state of residence (%) - American Indian and Alaska Native
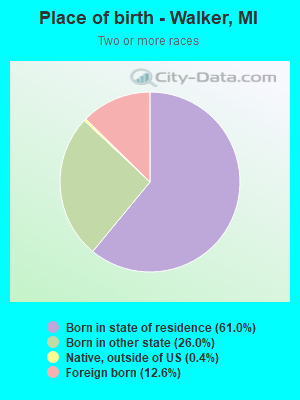
Place of birth - Born in state of residence (%) - Multirace
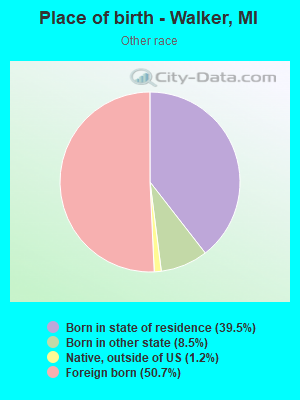
Place of birth - Born in state of residence (%) - Other Race
Place of birth - Born in other state (%)
Place of birth - Born in other state (%) - White
Place of birth - Born in other state (%) - Black or African American
Place of birth - Born in other state (%) - Asian
Place of birth - Born in other state (%) - Hispanic or Latino
Place of birth - Born in other state (%) - American Indian and Alaska Native
Place of birth - Born in other state (%) - Multirace
Place of birth - Born in other state (%) - Other Race
Place of birth - Native, outside of US (%)
Place of birth - Native, outside of US (%) - White
Place of birth - Native, outside of US (%) - Black or African American
Place of birth - Native, outside of US (%) - Asian
Place of birth - Native, outside of US (%) - Hispanic or Latino
Place of birth - Native, outside of US (%) - American Indian and Alaska Native
Place of birth - Native, outside of US (%) - Multirace
Place of birth - Native, outside of US (%) - Other Race
Place of birth - Foreign born (%)
Place of birth - Foreign born (%) - White
Place of birth - Foreign born (%) - Black or African American
Place of birth - Foreign born (%) - Asian
Place of birth - Foreign born (%) - Hispanic or Latino
Place of birth - Foreign born (%) - American Indian and Alaska Native
Place of birth - Foreign born (%) - Multirace
Place of birth - Foreign born (%) - Other Race
Residents speaking English at home (%)
Residents speaking English at home - Born in the United States (%)
Residents speaking English at home - Native, born elsewhere (%)
Residents speaking English at home - Foreign born (%)
Residents speaking Spanish at home (%)
Residents speaking Spanish at home - Born in the United States (%)
Residents speaking Spanish at home - Native, born elsewhere (%)
Residents speaking Spanish at home - Foreign born (%)
Residents speaking other language at home (%)
Residents speaking other language at home - Born in the United States (%)
Residents speaking other language at home - Native, born elsewhere (%)
Residents speaking other language at home - Foreign born (%)
Marital status - Never married (%)
Marital status - Now married (%)
Marital status - Separated (%)
Marital status - Widowed (%)
Marital status - Divorced (%)
Ancestries Reported - Arab (%)
Ancestries Reported - Czech (%)
Ancestries Reported - Danish (%)
Ancestries Reported - Dutch (%)
Ancestries Reported - English (%)
Ancestries Reported - French (%)
Ancestries Reported - French Canadian (%)
Ancestries Reported - German (%)
Ancestries Reported - Greek (%)
Ancestries Reported - Hungarian (%)
Ancestries Reported - Irish (%)
Ancestries Reported - Italian (%)
Ancestries Reported - Lithuanian (%)
Ancestries Reported - Norwegian (%)
Ancestries Reported - Polish (%)
Ancestries Reported - Portuguese (%)
Ancestries Reported - Russian (%)
Ancestries Reported - Scotch-Irish (%)
Ancestries Reported - Scottish (%)
Ancestries Reported - Slovak (%)
Ancestries Reported - Subsaharan African (%)
Ancestries Reported - Swedish (%)
Ancestries Reported - Swiss (%)
Ancestries Reported - Ukrainian (%)
Ancestries Reported - United States (%)
Ancestries Reported - Welsh (%)
Ancestries Reported - West Indian (%)
Ancestries Reported - Other (%)
Geographical mobility - Same house 1 year ago (%)
Geographical mobility - Same house 1 year ago (%) - White
Geographical mobility - Same house 1 year ago (%) - Black or African American
Geographical mobility - Same house 1 year ago (%) - Asian
Geographical mobility - Same house 1 year ago (%) - Hispanic or Latino
Geographical mobility - Same house 1 year ago (%) - American Indian and Alaska Native
Geographical mobility - Same house 1 year ago (%) - Multirace
Geographical mobility - Same house 1 year ago (%) - Other Race
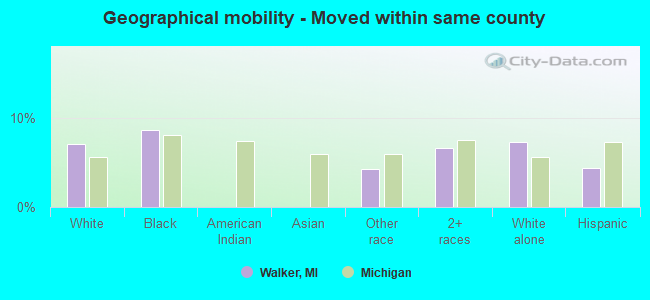
Geographical mobility - Moved within same county (%)
Geographical mobility - Moved within same county (%) - White
Geographical mobility - Moved within same county (%) - Black or African American
Geographical mobility - Moved within same county (%) - Asian
Geographical mobility - Moved within same county (%) - Hispanic or Latino
Geographical mobility - Moved within same county (%) - American Indian and Alaska Native
Geographical mobility - Moved within same county (%) - Multirace
Geographical mobility - Moved within same county (%) - Other Race
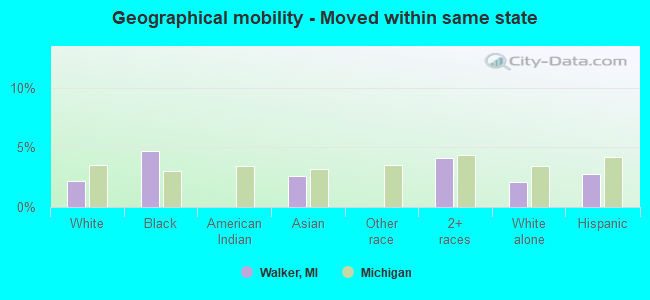
Geographical mobility - Moved from different county within same state (%)
Geographical mobility - Moved from different county within same state (%) - White
Geographical mobility - Moved from different county within same state (%) - Black or African American
Geographical mobility - Moved from different county within same state (%) - Asian
Geographical mobility - Moved from different county within same state (%) - Hispanic or Latino
Geographical mobility - Moved from different county within same state (%) - American Indian and Alaska Native
Geographical mobility - Moved from different county within same state (%) - Multirace
Geographical mobility - Moved from different county within same state (%) - Other Race
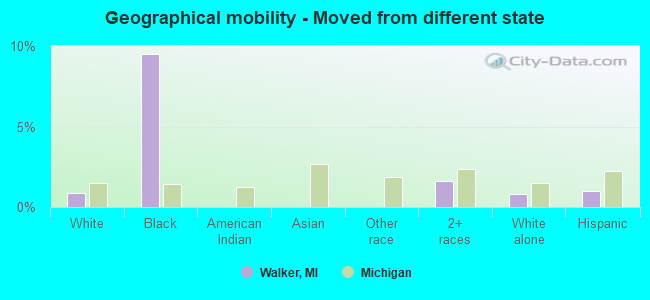
Geographical mobility - Moved from different state (%)
Geographical mobility - Moved from different state (%) - White
Geographical mobility - Moved from different state (%) - Black or African American
Geographical mobility - Moved from different state (%) - Asian
Geographical mobility - Moved from different state (%) - Hispanic or Latino
Geographical mobility - Moved from different state (%) - American Indian and Alaska Native
Geographical mobility - Moved from different state (%) - Multirace
Geographical mobility - Moved from different state (%) - Other Race
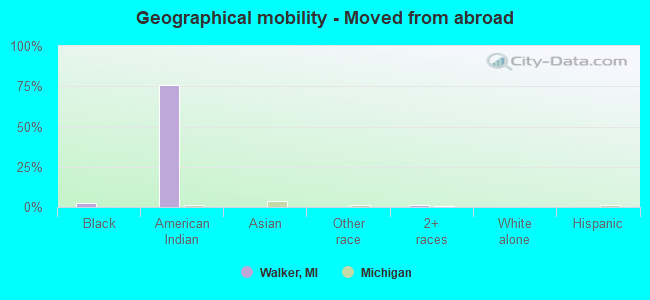
Geographical mobility - Moved from abroad (%)
Geographical mobility - Moved from abroad (%) - White
Geographical mobility - Moved from abroad (%) - Black or African American
Geographical mobility - Moved from abroad (%) - Asian
Geographical mobility - Moved from abroad (%) - Hispanic or Latino
Geographical mobility - Moved from abroad (%) - American Indian and Alaska Native
Geographical mobility - Moved from abroad (%) - Multirace
Geographical mobility - Moved from abroad (%) - Other Race
Place of birth for the foreign-born population - Ireland (%)
Place of birth for the foreign-born population - Denmark (%)
Place of birth for the foreign-born population - Norway (%)
Place of birth for the foreign-born population - Sweden (%)
Place of birth for the foreign-born population - United Kingdom (%)
Place of birth for the foreign-born population - England (%)
Place of birth for the foreign-born population - Scotland (%)
Place of birth for the foreign-born population - Other Northern Europe (%)
Place of birth for the foreign-born population - Austria (%)
Place of birth for the foreign-born population - Belgium (%)
Place of birth for the foreign-born population - France (%)
Place of birth for the foreign-born population - Germany (%)
Place of birth for the foreign-born population - Netherlands (%)
Place of birth for the foreign-born population - Switzerland (%)
Place of birth for the foreign-born population - Other Western Europe (%)
Place of birth for the foreign-born population - Greece (%)
Place of birth for the foreign-born population - Italy (%)
Place of birth for the foreign-born population - Portugal (%)
Place of birth for the foreign-born population - Spain (%)
Place of birth for the foreign-born population - Other Southern Europe (%)
Place of birth for the foreign-born population - Albania (%)
Place of birth for the foreign-born population - Belarus (%)
Place of birth for the foreign-born population - Bosnia and Herzegovina (%)
Place of birth for the foreign-born population - Bulgaria (%)
Place of birth for the foreign-born population - Croatia (%)
Place of birth for the foreign-born population - Czechoslovakia (%)
Place of birth for the foreign-born population - Hungary (%)
Place of birth for the foreign-born population - Latvia (%)
Place of birth for the foreign-born population - Lithuania (%)
Place of birth for the foreign-born population - North Macedonia (Macedonia) (%)
Place of birth for the foreign-born population - Moldova (%)
Place of birth for the foreign-born population - Poland (%)
Place of birth for the foreign-born population - Romania (%)
Place of birth for the foreign-born population - Russia (%)
Place of birth for the foreign-born population - Serbia (%)
Place of birth for the foreign-born population - Ukraine (%)
Place of birth for the foreign-born population - Other Eastern Europe (%)
Place of birth for the foreign-born population - China (%)
Place of birth for the foreign-born population - Hong Kong (%)
Place of birth for the foreign-born population - Taiwan (%)
Place of birth for the foreign-born population - Japan (%)
Place of birth for the foreign-born population - Korea (%)
Place of birth for the foreign-born population - Other Eastern Asia (%)
Place of birth for the foreign-born population - Afghanistan (%)
Place of birth for the foreign-born population - Bangladesh (%)
Place of birth for the foreign-born population - India (%)
Place of birth for the foreign-born population - Iran (%)
Place of birth for the foreign-born population - Kazakhstan (%)
Place of birth for the foreign-born population - Nepal (%)
Place of birth for the foreign-born population - Pakistan (%)
Place of birth for the foreign-born population - Sri Lanka (%)
Place of birth for the foreign-born population - Uzbekistan (%)
Place of birth for the foreign-born population - Other South Central Asia (%)
Place of birth for the foreign-born population - Burma (%)
Place of birth for the foreign-born population - Cambodia (%)
Place of birth for the foreign-born population - Indonesia (%)
Place of birth for the foreign-born population - Laos (%)
Place of birth for the foreign-born population - Malaysia (%)
Place of birth for the foreign-born population - Philippines (%)
Place of birth for the foreign-born population - Singapore (%)
Place of birth for the foreign-born population - Thailand (%)
Place of birth for the foreign-born population - Vietnam (%)
Place of birth for the foreign-born population - Other South Eastern Asia (%)
Place of birth for the foreign-born population - Armenia (%)
Place of birth for the foreign-born population - Iraq (%)
Place of birth for the foreign-born population - Israel (%)
Place of birth for the foreign-born population - Jordan (%)
Place of birth for the foreign-born population - Kuwait (%)
Place of birth for the foreign-born population - Lebanon (%)
Place of birth for the foreign-born population - Saudi Arabia (%)
Place of birth for the foreign-born population - Syria (%)
Place of birth for the foreign-born population - Turkey (%)
Place of birth for the foreign-born population - Yemen (%)
Place of birth for the foreign-born population - Other Western Asia (%)
Place of birth for the foreign-born population - Eritrea (%)
Place of birth for the foreign-born population - Ethiopia (%)
Place of birth for the foreign-born population - Kenya (%)
Place of birth for the foreign-born population - Somalia (%)
Place of birth for the foreign-born population - Uganda (%)
Place of birth for the foreign-born population - Zimbabwe (%)
Place of birth for the foreign-born population - Other Eastern Africa (%)
Place of birth for the foreign-born population - Cameroon (%)
Place of birth for the foreign-born population - Congo (%)
Place of birth for the foreign-born population - Democratic Republic of Congo (Zaire) (%)
Place of birth for the foreign-born population - Other Middle Africa (%)
Place of birth for the foreign-born population - Egypt (%)
Place of birth for the foreign-born population - Morocco (%)
Place of birth for the foreign-born population - Sudan (%)
Place of birth for the foreign-born population - Other Northern Africa (%)
Place of birth for the foreign-born population - South Africa (%)
Place of birth for the foreign-born population - Other Southern Africa (%)
Place of birth for the foreign-born population - Cabo Verde (%)
Place of birth for the foreign-born population - Ghana (%)
Place of birth for the foreign-born population - Liberia (%)
Place of birth for the foreign-born population - Nigeria (%)
Place of birth for the foreign-born population - Senegal (%)
Place of birth for the foreign-born population - Sierra Leone (%)
Place of birth for the foreign-born population - Other Western Africa (%)
Place of birth for the foreign-born population - Australia (%)
Place of birth for the foreign-born population - New Zealand (%)
Place of birth for the foreign-born population - Fiji (%)
Place of birth for the foreign-born population - Micronesia (%)
Place of birth for the foreign-born population - Bahamas (%)
Place of birth for the foreign-born population - Barbados (%)
Place of birth for the foreign-born population - Cuba (%)
Place of birth for the foreign-born population - Dominica (%)
Place of birth for the foreign-born population - Dominican Republic (%)
Place of birth for the foreign-born population - Grenada (%)
Place of birth for the foreign-born population - Haiti (%)
Place of birth for the foreign-born population - Jamaica (%)
Place of birth for the foreign-born population - St. Vincent and the Grenadines (%)
Place of birth for the foreign-born population - Trinidad and Tobago (%)
Place of birth for the foreign-born population - West Indies (%)
Place of birth for the foreign-born population - Other Caribbean (%)
Place of birth for the foreign-born population - Belize (%)
Place of birth for the foreign-born population - Costa Rica (%)
Place of birth for the foreign-born population - El Salvador (%)
Place of birth for the foreign-born population - Guatemala (%)
Place of birth for the foreign-born population - Honduras (%)
Place of birth for the foreign-born population - Mexico (%)
Place of birth for the foreign-born population - Nicaragua (%)
Place of birth for the foreign-born population - Panama (%)
Place of birth for the foreign-born population - Other Central America (%)
Place of birth for the foreign-born population - Argentina (%)
Place of birth for the foreign-born population - Bolivia (%)
Place of birth for the foreign-born population - Brazil (%)
Place of birth for the foreign-born population - Chile (%)
Place of birth for the foreign-born population - Colombia (%)
Place of birth for the foreign-born population - Ecuador (%)
Place of birth for the foreign-born population - Guyana (%)
Place of birth for the foreign-born population - Peru (%)
Place of birth for the foreign-born population - Uruguay (%)
Place of birth for the foreign-born population - Venezuela (%)
Place of birth for the foreign-born population - Other South America (%)
Place of birth for the foreign-born population - Canada (%)
Place of birth for the foreign-born population - Other Northern America (%)
Place of birth for the foreign-born population - Other (%)
Latest news about races in Walker, MI collected exclusively by city-data.com from local newspapers, TV, and radio stations
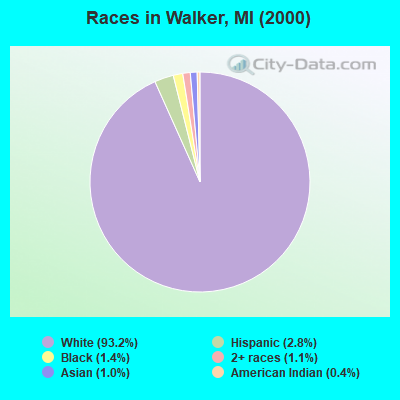
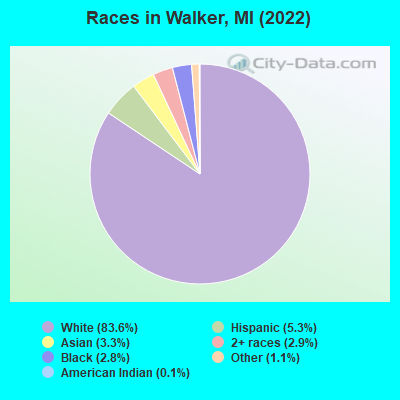
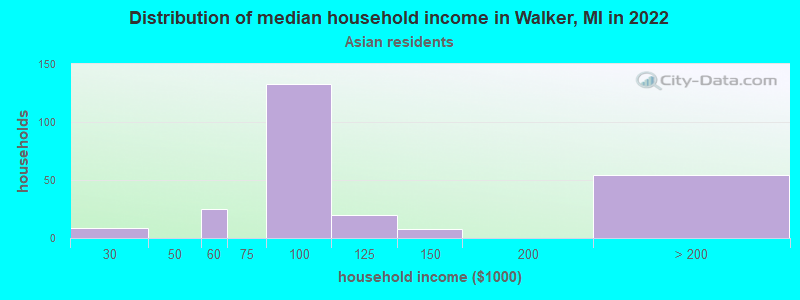
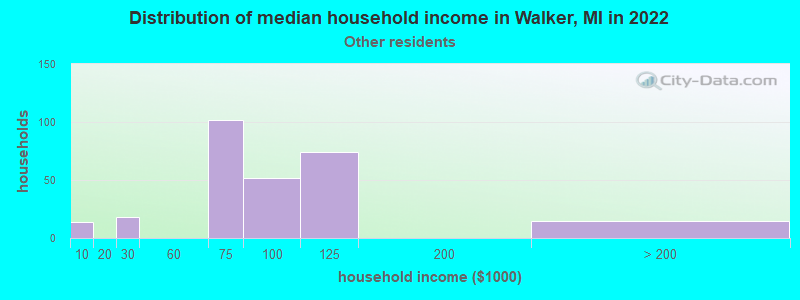
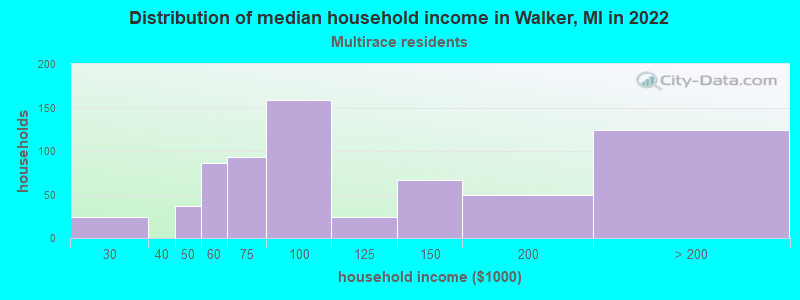
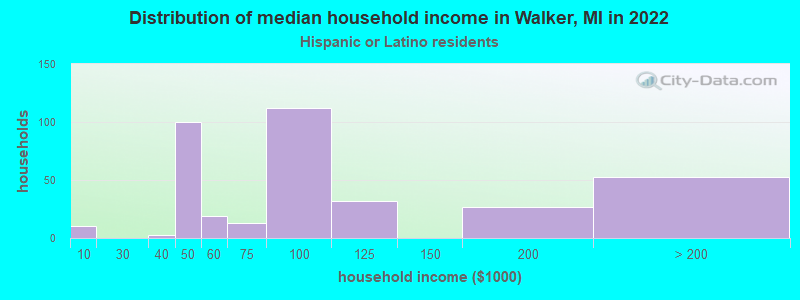
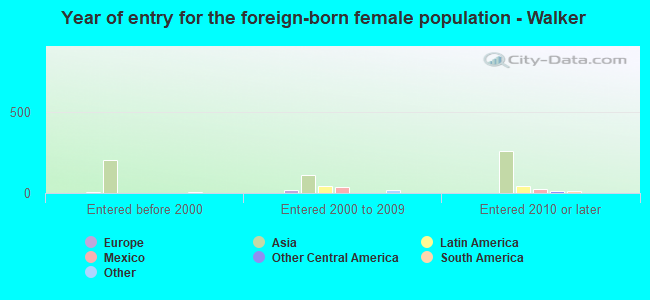
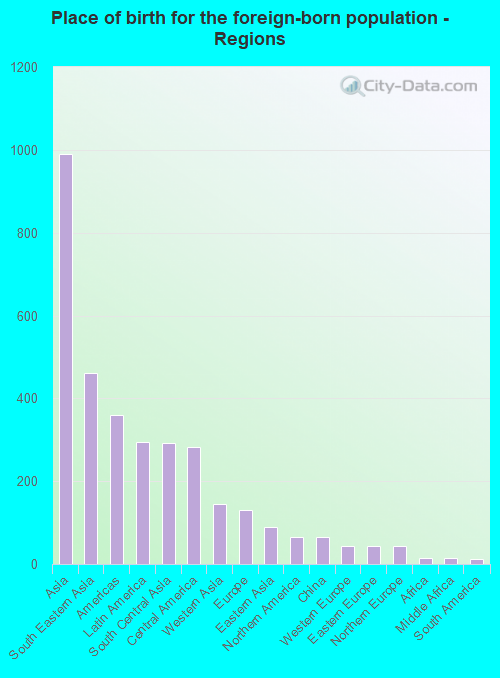
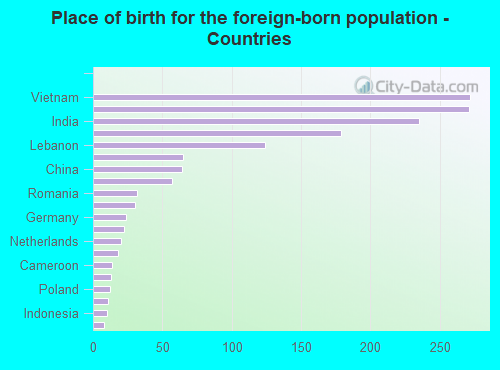
According to 2022 data, the most numerous races in Walker, MI are White alone (21,114 residents), Black alone (718 residents), and Hispanic (1,347 residents). 92.7% of Walker residents speak English at home. 5.9% of Walker, MI residents are foreign-born (3.9% born in Asia, 1.2% born in Latin America), which is about the same as the foreign-born rate of 6.0% across the entire state of Michigan.
Race distribution in Walker
2000 2022
7,806,691 78.6% White alone 1,402,047 14.1% Black alone 323,877 3.3% Hispanic 175,311 1.8% Asian alone 163,487 1.6% Two or more races 53,421 0.5% American Indian alone 11,465 0.1% Other race alone 2,145 0.02% Native Hawaiian and Other
7,289,051 72.6% White alone 1,310,464 13.1% Black alone 572,405 5.7% Hispanic 450,031 4.5% Two or more races 335,732 3.3% Asian alone 45,217 0.5% Other race alone 29,011 0.3% American Indian alone 2,207 0.02% Native Hawaiian and Other
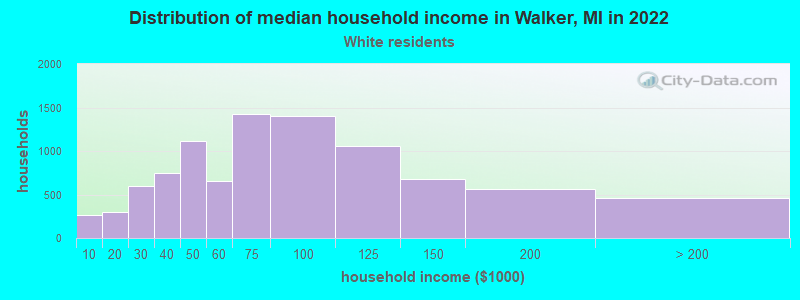
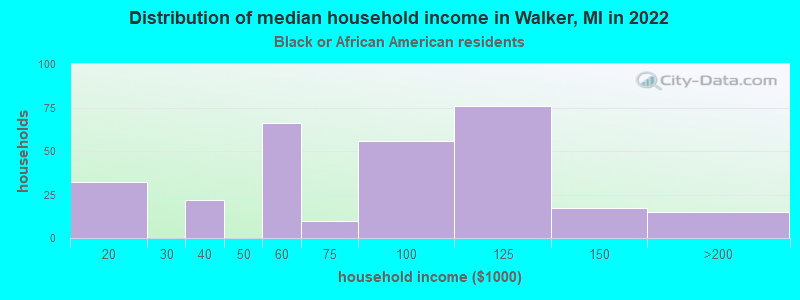
Income and house value in Walker Median household income in 2022 $70,642 White non-Hispanic householders$85,749 Black householders$100,622 Asian householders$100,233 Some other race householders$95,216 Two or more races householders$85,788 Hispanic or Latino race householdersMedian 2022 house value $293,619 White Non-Hispanic householders$394,323 Black or African American householders$206,261 American Indian or Alaska Native householders $230,527 Asian householders$232,954 Two or more races householders$228,586 Hispanic or Latino householders
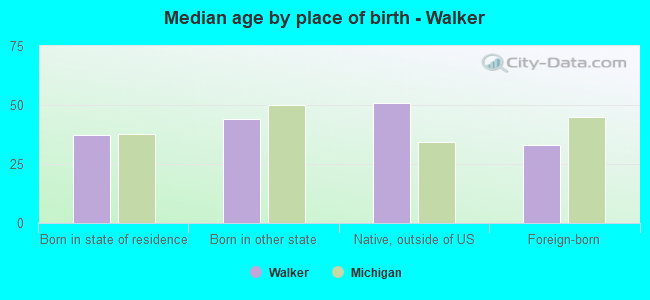
Median age by race in Walker
40.1 Median age for White residents39.5 40.5 38.9 Median age for Black or African American residents39.6 40.6 34.2 Median age for American Indian / Alaska Native residents34.0 -677,018,632.9 29.9 Median age for Asian residents33.1 30.1 -670,531,400.3 Median age for Native Hawaiian / Pacific Islander residents-674,772,035.8 -699,588,476.7 30.1 Median age for Other race residents28.5 28.7 27.4 Median age for Two or more races residents18.9 32.0 40.3 Median age for White alone residents39.6 40.5 25.4 Median age for Hispanic or Latino residents23.8 26.5
Owner/renter occupied households by race in Walker
House owners and renters - White residents 5,881 63.0% Owner occupied3,453 37.0% Renter occupiedHouse owners and renters - Black or African American residents 53 19.5% Owner occupied219 80.5% Renter occupiedHouse owners and renters - American Indian / Alaska Native residents 24 100.0% Renter occupiedHouse owners and renters - Asian residents 75 26.9% Owner occupied204 73.1% Renter occupiedHouse owners and renters - Other race residents 54 33.2% Owner occupied108 66.8% Renter occupiedHouse owners and renters - Two or more races residents 353 61.2% Owner occupied223 38.8% Renter occupiedHouse owners and renters - White alone residents 5,911 63.8% Owner occupied3,350 36.2% Renter occupiedHouse owners and renters - Hispanic or Latino residents 160 44.3% Owner occupied202 55.7% Renter occupied
Language usage in Walker
English speakers - Total 92.7% of residents of Walker speak English at home.
2.0% of residents speak Spanish at home 258 53.5% Speak English very well224 46.5% Speak English less than very well5.0% of residents speak other language at home 867 72.7% Speak English very well325 27.3% Speak English less than very well
English speakers - Born in the United States 95.7% of residents of Walker speak English at home.
2.8% of residents speak Spanish at home 58 64.4% Speak English very well32 35.6% Speak English less than very well1.8% of residents speak other language at home 25 44.6% Speak English very well31 55.4% Speak English less than very well
All residents speak only English at home
English speakers - Foreign-born 33.6% of residents of Walker speak English at home.
11.2% of residents speak Spanish at home 86 49.1% Speak English very well89 50.9% Speak English less than very well50.5% of residents speak other language at home 518 65.9% Speak English very well268 34.1% Speak English less than very well
White (Caucasian) - Speak only English Native:
98.4% (19,400)Foreign-born:
52.5% (163)
White (Caucasian) - Speak another language Native:
1.7% (341)Foreign-born:
48.8% (151)
Asian - Speak only English Native:
68.7% (75)Foreign-born:
35.5% (261)
Asian - Speak another language Native:
31.1% (34)Foreign-born:
64.6% (475)
Other race - Speak only English Native:
100.0% (214)Foreign-born:
37.1% (86)
Other race - Speak another language Native:
15.0% (32)Foreign-born:
64.4% (149)
Two or more races - Speak only English Native:
84.2% (984)Foreign-born:
9.1% (19)
Two or more races - Speak another language Native:
14.1% (165)Foreign-born:
90.9% (191)
White alone - Speak only English Native:
98.2% (19,200)Foreign-born:
44.0% (154)
White alone - Speak another language Native:
1.8% (362)Foreign-born:
52.8% (185)
Hispanic or Latino - Speak only English Native:
79.7% (700)Foreign-born:
45.5% (140)
Hispanic or Latino - Speak another language Native:
23.2% (203)Foreign-born:
56.3% (174)
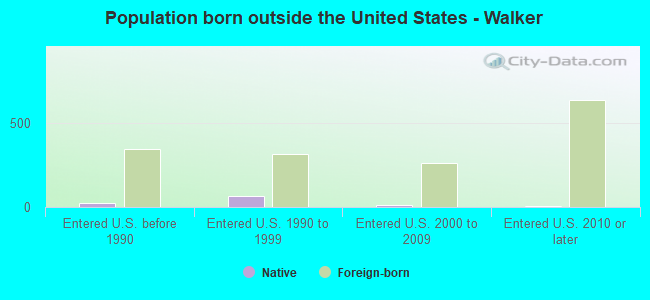
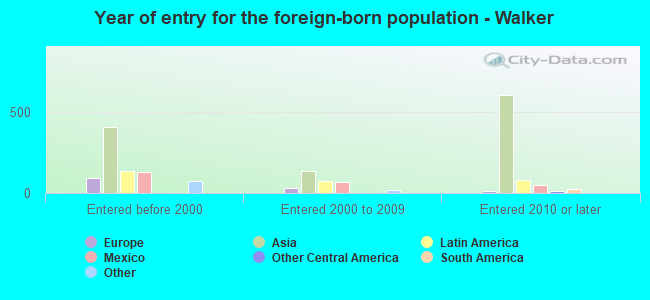
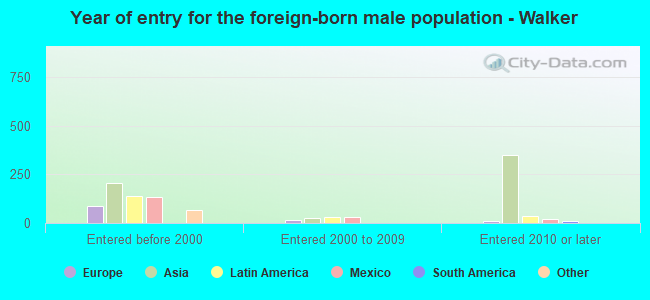
Foreign-born residents in Walker 1,494 residents are foreign born (3.9% Asia , 1.2% Latin America ).
This city:
5.9%Michigan:
6.9%
Marital status for residents in Walker Marital status - White (Caucasian) population 15 years and over
Males 33.9% Never married51.7% Now married0.2% Separated2.7% Widowed11.6% DivorcedFemales 30.9% Never married48.9% Now married0.0% Separated7.8% Widowed12.4% DivorcedWomen who gave birth in the past 12 months Now married:
100.0% (204)Unmarried:
0.0% (0)
Women who did not give birth in the past 12 months Now married:
38.6% (1,778)Unmarried:
61.4% (2,830)
Marital status - Black or African American population 15 years and over
Males 72.2% Never married25.4% Now married0.0% Separated0.0% Widowed2.4% DivorcedFemales 41.2% Never married11.6% Now married8.1% Separated0.0% Widowed39.1% DivorcedWomen who did not give birth in the past 12 months Now married:
10.2% (29)Unmarried:
89.8% (254)
Marital status - American Indian / Alaska Native population 15 years and over
Males 17.9% Never married82.1% Now married0.0% Separated0.0% Widowed0.0% DivorcedFemales 0.0% Never married100.0% Now married0.0% Separated0.0% Widowed0.0% DivorcedWomen who did not give birth in the past 12 months Now married:
100.0% (7)Unmarried:
0.0% (0)
Marital status - Asian population 15 years and over
Males 57.3% Never married39.9% Now married0.0% Separated0.0% Widowed2.8% DivorcedFemales 57.9% Never married33.7% Now married0.0% Separated8.3% Widowed0.0% DivorcedWomen who did not give birth in the past 12 months Now married:
21.5% (68)Unmarried:
78.5% (249)
Marital status - Other race population 15 years and over
Males 18.1% Never married81.9% Now married0.0% Separated0.0% Widowed0.0% DivorcedFemales 37.4% Never married62.6% Now married0.0% Separated0.0% Widowed0.0% DivorcedWomen who gave birth in the past 12 months Now married:
0.0% (0)Unmarried:
100.0% (22)
Women who did not give birth in the past 12 months Now married:
65.4% (83)Unmarried:
34.6% (44)
Marital status - Two or more races population 15 years and over
Males 27.5% Never married64.7% Now married0.0% Separated0.3% Widowed7.5% DivorcedFemales 31.5% Never married39.3% Now married7.2% Separated12.1% Widowed9.8% DivorcedWomen who gave birth in the past 12 months Now married:
76.9% (27)Unmarried:
23.1% (8)
Women who did not give birth in the past 12 months Now married:
50.0% (141)Unmarried:
50.0% (141)
Marital status - White alone, not Hispanic / Latino population 15 years and over
Males 32.7% Never married52.4% Now married0.2% Separated2.7% Widowed11.9% DivorcedFemales 30.7% Never married48.9% Now married0.0% Separated7.9% Widowed12.5% DivorcedWomen who gave birth in the past 12 months Now married:
100.0% (207)Unmarried:
0.0% (0)
Women who did not give birth in the past 12 months Now married:
38.5% (1,766)Unmarried:
61.5% (2,820)
Marital status - Hispanic or Latino population 15 years and over
Males 48.2% Never married51.7% Now married0.0% Separated0.2% Widowed0.0% DivorcedFemales 48.4% Never married37.0% Now married0.0% Separated8.2% Widowed6.3% DivorcedWomen who gave birth in the past 12 months Now married:
0.0% (0)Unmarried:
100.0% (28)
Women who did not give birth in the past 12 months Now married:
42.0% (105)Unmarried:
58.0% (145)
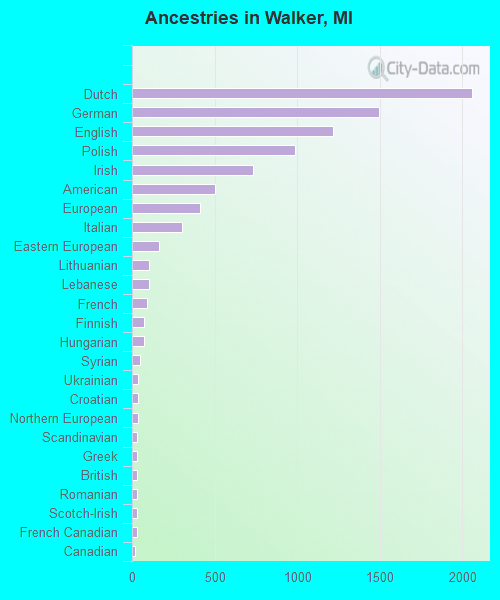
Ancestries in Walker
2,059 18.5% Dutch1,495 13.5% German1,217 11.0% English990 8.9% Polish733 6.6% Irish505 4.5% American414 3.7% European301 2.7% Italian163 1.5% Eastern European104 0.9% Lithuanian103 0.9% Lebanese90 0.8% French74 0.7% Finnish73 0.7% Hungarian47 0.4% Syrian37 0.3% Ukrainian35 0.3% Croatian35 0.3% Northern European33 0.3% Scandinavian31 0.3% Greek30 0.3% British29 0.3% Romanian29 0.3% Scotch-Irish28 0.3% French Canadian21 0.2% Canadian19 0.2% Scottish17 0.2% Arab14 0.1% Czechoslovakian14 0.1% Serbian14 0.1% Swedish12 0.1% Norwegian12 0.1% Swiss9 0.08% Belgian9 0.08% Czech8 0.07% Austrian8 0.07% Danish
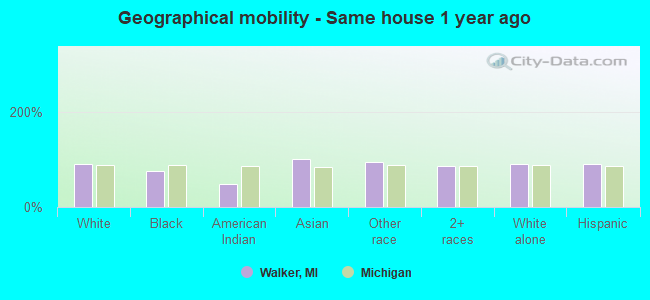
Geographical mobility in Walker Same house 1 year ago 18,859 89.9% White (Caucasian)540 75.9% Black or African American23 49.0% American Indian / Alaska Native821 100.0% Asian444 94.8% Other race1,398 86.3% Two or more races18,798 89.8% White alone, not Hispanic / Latino1,202 91.3% Hispanic or LatinoMoved within same county 1,471 7.0% White / Caucasian61 8.6% Black or African American20 4.3% Other race107 6.6% Two or more races1,519 7.3% White alone, not Hispanic / Latino57 4.4% Hispanic or LatinoMoved within same state 456 2.2% White / Caucasian33 4.7% Black or African American22 2.6% Asian66 4.1% Two or more races434 2.1% White alone, not Hispanic / Latino37 2.8% Hispanic or LatinoMoved from different state 185 0.9% White / Caucasian68 9.5% Black or African American26 1.6% Two or more races174 0.8% White alone, not Hispanic / Latino13 1.0% Hispanic or LatinoMoved from abroad 16 2.3% Black or African American35 75.7% American Indian / Alaska Native23 1.4% Two or more races
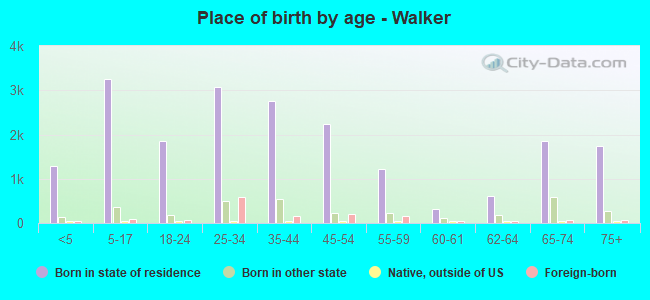
Children Nativity (place of birth) in Walker
Children under 6 years - Living with two parents Both parents native 1,044 100.0% NativeBoth parents foreign-born 8 100.0% NativeOne native, one foreign-born parent 72 100.0% NativeChildren under 6 years - Living with one parent Native parent 515 100.0% NativeForeign-born parent 35 100.0% Native
Children 6 to 17 years - Living with two parents Both parents native 2,121 100.0% NativeOne native, one foreign-born parent 103 100.0% NativeChildren 6 to 17 years - Living with one parent Native parent 962 100.0% Native
Grandparents responsible for own grandchildren in Walker
Grandparents (30 to 59 years) White / Caucasian 92 48.7% Responsible for grandchildren97 51.3% Not responsible for grandchildrenBlack or African American 23 100.0% Not responsible for grandchildrenAsian 47 100.0% Not responsible for grandchildrenWhite alone, not Hispanic / Latino 73 43.0% Responsible for grandchildren97 57.0% Not responsible for grandchildrenGrandparents (60 years and over) White / Caucasian 92 100.0% Not responsible for grandchildrenAsian 75 87.7% Responsible for grandchildren10 12.3% Not responsible for grandchildrenWhite alone, not Hispanic / Latino 102 100.0% Not responsible for grandchildren