Races in Waldorf, Maryland (MD) Detailed Stats
Data:
Races - White alone (%)
Races - White alone (% change since 2000)
Races - Black alone (%)
Races - Black alone (% change since 2000)
Races - American Indian alone (%)
Races - American Indian alone (% change since 2000)
Races - Asian alone (%)
Races - Asian alone (% change since 2000)
Races - Hispanic (%)
Races - Hispanic (% change since 2000)
Races - Native Hawaiian and Other Pacific Islander alone (%)
Races - Native Hawaiian and Other Pacific Islander alone (% change since 2000)
Races - Two or more races(%)
Races - Two or more races(% change since 2000)
Races - Other race alone (%)
Races - Other race alone (% change since 2000)
Racial diversity
Place of birth - Born in state of residence (%)
Place of birth - Born in state of residence (%) - White
Place of birth - Born in state of residence (%) - Black or African American
Place of birth - Born in state of residence (%) - Asian
Place of birth - Born in state of residence (%) - Hispanic or Latino
Place of birth - Born in state of residence (%) - American Indian and Alaska Native
Place of birth - Born in state of residence (%) - Multirace
Place of birth - Born in state of residence (%) - Other Race
Place of birth - Born in other state (%)
Place of birth - Born in other state (%) - White
Place of birth - Born in other state (%) - Black or African American
Place of birth - Born in other state (%) - Asian
Place of birth - Born in other state (%) - Hispanic or Latino
Place of birth - Born in other state (%) - American Indian and Alaska Native
Place of birth - Born in other state (%) - Multirace
Place of birth - Born in other state (%) - Other Race
Place of birth - Native, outside of US (%)
Place of birth - Native, outside of US (%) - White
Place of birth - Native, outside of US (%) - Black or African American
Place of birth - Native, outside of US (%) - Asian
Place of birth - Native, outside of US (%) - Hispanic or Latino
Place of birth - Native, outside of US (%) - American Indian and Alaska Native
Place of birth - Native, outside of US (%) - Multirace
Place of birth - Native, outside of US (%) - Other Race
Place of birth - Foreign born (%)
Place of birth - Foreign born (%) - White
Place of birth - Foreign born (%) - Black or African American
Place of birth - Foreign born (%) - Asian
Place of birth - Foreign born (%) - Hispanic or Latino
Place of birth - Foreign born (%) - American Indian and Alaska Native
Place of birth - Foreign born (%) - Multirace
Place of birth - Foreign born (%) - Other Race
Residents speaking English at home (%)
Residents speaking English at home - Born in the United States (%)
Residents speaking English at home - Native, born elsewhere (%)
Residents speaking English at home - Foreign born (%)
Residents speaking Spanish at home (%)
Residents speaking Spanish at home - Born in the United States (%)
Residents speaking Spanish at home - Native, born elsewhere (%)
Residents speaking Spanish at home - Foreign born (%)
Residents speaking other language at home (%)
Residents speaking other language at home - Born in the United States (%)
Residents speaking other language at home - Native, born elsewhere (%)
Residents speaking other language at home - Foreign born (%)
Marital status - Never married (%)
Marital status - Now married (%)
Marital status - Separated (%)
Marital status - Widowed (%)
Marital status - Divorced (%)
Ancestries Reported - Arab (%)
Ancestries Reported - Czech (%)
Ancestries Reported - Danish (%)
Ancestries Reported - Dutch (%)
Ancestries Reported - English (%)
Ancestries Reported - French (%)
Ancestries Reported - French Canadian (%)
Ancestries Reported - German (%)
Ancestries Reported - Greek (%)
Ancestries Reported - Hungarian (%)
Ancestries Reported - Irish (%)
Ancestries Reported - Italian (%)
Ancestries Reported - Lithuanian (%)
Ancestries Reported - Norwegian (%)
Ancestries Reported - Polish (%)
Ancestries Reported - Portuguese (%)
Ancestries Reported - Russian (%)
Ancestries Reported - Scotch-Irish (%)
Ancestries Reported - Scottish (%)
Ancestries Reported - Slovak (%)
Ancestries Reported - Subsaharan African (%)
Ancestries Reported - Swedish (%)
Ancestries Reported - Swiss (%)
Ancestries Reported - Ukrainian (%)
Ancestries Reported - United States (%)
Ancestries Reported - Welsh (%)
Ancestries Reported - West Indian (%)
Ancestries Reported - Other (%)
Geographical mobility - Same house 1 year ago (%)
Geographical mobility - Same house 1 year ago (%) - White
Geographical mobility - Same house 1 year ago (%) - Black or African American
Geographical mobility - Same house 1 year ago (%) - Asian
Geographical mobility - Same house 1 year ago (%) - Hispanic or Latino
Geographical mobility - Same house 1 year ago (%) - American Indian and Alaska Native
Geographical mobility - Same house 1 year ago (%) - Multirace
Geographical mobility - Same house 1 year ago (%) - Other Race
Geographical mobility - Moved within same county (%)
Geographical mobility - Moved within same county (%) - White
Geographical mobility - Moved within same county (%) - Black or African American
Geographical mobility - Moved within same county (%) - Asian
Geographical mobility - Moved within same county (%) - Hispanic or Latino
Geographical mobility - Moved within same county (%) - American Indian and Alaska Native
Geographical mobility - Moved within same county (%) - Multirace
Geographical mobility - Moved within same county (%) - Other Race
Geographical mobility - Moved from different county within same state (%)
Geographical mobility - Moved from different county within same state (%) - White
Geographical mobility - Moved from different county within same state (%) - Black or African American
Geographical mobility - Moved from different county within same state (%) - Asian
Geographical mobility - Moved from different county within same state (%) - Hispanic or Latino
Geographical mobility - Moved from different county within same state (%) - American Indian and Alaska Native
Geographical mobility - Moved from different county within same state (%) - Multirace
Geographical mobility - Moved from different county within same state (%) - Other Race
Geographical mobility - Moved from different state (%)
Geographical mobility - Moved from different state (%) - White
Geographical mobility - Moved from different state (%) - Black or African American
Geographical mobility - Moved from different state (%) - Asian
Geographical mobility - Moved from different state (%) - Hispanic or Latino
Geographical mobility - Moved from different state (%) - American Indian and Alaska Native
Geographical mobility - Moved from different state (%) - Multirace
Geographical mobility - Moved from different state (%) - Other Race
Geographical mobility - Moved from abroad (%)
Geographical mobility - Moved from abroad (%) - White
Geographical mobility - Moved from abroad (%) - Black or African American
Geographical mobility - Moved from abroad (%) - Asian
Geographical mobility - Moved from abroad (%) - Hispanic or Latino
Geographical mobility - Moved from abroad (%) - American Indian and Alaska Native
Geographical mobility - Moved from abroad (%) - Multirace
Geographical mobility - Moved from abroad (%) - Other Race
Place of birth for the foreign-born population - Ireland (%)
Place of birth for the foreign-born population - Denmark (%)
Place of birth for the foreign-born population - Norway (%)
Place of birth for the foreign-born population - Sweden (%)
Place of birth for the foreign-born population - United Kingdom (%)
Place of birth for the foreign-born population - England (%)
Place of birth for the foreign-born population - Scotland (%)
Place of birth for the foreign-born population - Other Northern Europe (%)
Place of birth for the foreign-born population - Austria (%)
Place of birth for the foreign-born population - Belgium (%)
Place of birth for the foreign-born population - France (%)
Place of birth for the foreign-born population - Germany (%)
Place of birth for the foreign-born population - Netherlands (%)
Place of birth for the foreign-born population - Switzerland (%)
Place of birth for the foreign-born population - Other Western Europe (%)
Place of birth for the foreign-born population - Greece (%)
Place of birth for the foreign-born population - Italy (%)
Place of birth for the foreign-born population - Portugal (%)
Place of birth for the foreign-born population - Spain (%)
Place of birth for the foreign-born population - Other Southern Europe (%)
Place of birth for the foreign-born population - Albania (%)
Place of birth for the foreign-born population - Belarus (%)
Place of birth for the foreign-born population - Bosnia and Herzegovina (%)
Place of birth for the foreign-born population - Bulgaria (%)
Place of birth for the foreign-born population - Croatia (%)
Place of birth for the foreign-born population - Czechoslovakia (%)
Place of birth for the foreign-born population - Hungary (%)
Place of birth for the foreign-born population - Latvia (%)
Place of birth for the foreign-born population - Lithuania (%)
Place of birth for the foreign-born population - North Macedonia (Macedonia) (%)
Place of birth for the foreign-born population - Moldova (%)
Place of birth for the foreign-born population - Poland (%)
Place of birth for the foreign-born population - Romania (%)
Place of birth for the foreign-born population - Russia (%)
Place of birth for the foreign-born population - Serbia (%)
Place of birth for the foreign-born population - Ukraine (%)
Place of birth for the foreign-born population - Other Eastern Europe (%)
Place of birth for the foreign-born population - China (%)
Place of birth for the foreign-born population - Hong Kong (%)
Place of birth for the foreign-born population - Taiwan (%)
Place of birth for the foreign-born population - Japan (%)
Place of birth for the foreign-born population - Korea (%)
Place of birth for the foreign-born population - Other Eastern Asia (%)
Place of birth for the foreign-born population - Afghanistan (%)
Place of birth for the foreign-born population - Bangladesh (%)
Place of birth for the foreign-born population - India (%)
Place of birth for the foreign-born population - Iran (%)
Place of birth for the foreign-born population - Kazakhstan (%)
Place of birth for the foreign-born population - Nepal (%)
Place of birth for the foreign-born population - Pakistan (%)
Place of birth for the foreign-born population - Sri Lanka (%)
Place of birth for the foreign-born population - Uzbekistan (%)
Place of birth for the foreign-born population - Other South Central Asia (%)
Place of birth for the foreign-born population - Burma (%)
Place of birth for the foreign-born population - Cambodia (%)
Place of birth for the foreign-born population - Indonesia (%)
Place of birth for the foreign-born population - Laos (%)
Place of birth for the foreign-born population - Malaysia (%)
Place of birth for the foreign-born population - Philippines (%)
Place of birth for the foreign-born population - Singapore (%)
Place of birth for the foreign-born population - Thailand (%)
Place of birth for the foreign-born population - Vietnam (%)
Place of birth for the foreign-born population - Other South Eastern Asia (%)
Place of birth for the foreign-born population - Armenia (%)
Place of birth for the foreign-born population - Iraq (%)
Place of birth for the foreign-born population - Israel (%)
Place of birth for the foreign-born population - Jordan (%)
Place of birth for the foreign-born population - Kuwait (%)
Place of birth for the foreign-born population - Lebanon (%)
Place of birth for the foreign-born population - Saudi Arabia (%)
Place of birth for the foreign-born population - Syria (%)
Place of birth for the foreign-born population - Turkey (%)
Place of birth for the foreign-born population - Yemen (%)
Place of birth for the foreign-born population - Other Western Asia (%)
Place of birth for the foreign-born population - Eritrea (%)
Place of birth for the foreign-born population - Ethiopia (%)
Place of birth for the foreign-born population - Kenya (%)
Place of birth for the foreign-born population - Somalia (%)
Place of birth for the foreign-born population - Uganda (%)
Place of birth for the foreign-born population - Zimbabwe (%)
Place of birth for the foreign-born population - Other Eastern Africa (%)
Place of birth for the foreign-born population - Cameroon (%)
Place of birth for the foreign-born population - Congo (%)
Place of birth for the foreign-born population - Democratic Republic of Congo (Zaire) (%)
Place of birth for the foreign-born population - Other Middle Africa (%)
Place of birth for the foreign-born population - Egypt (%)
Place of birth for the foreign-born population - Morocco (%)
Place of birth for the foreign-born population - Sudan (%)
Place of birth for the foreign-born population - Other Northern Africa (%)
Place of birth for the foreign-born population - South Africa (%)
Place of birth for the foreign-born population - Other Southern Africa (%)
Place of birth for the foreign-born population - Cabo Verde (%)
Place of birth for the foreign-born population - Ghana (%)
Place of birth for the foreign-born population - Liberia (%)
Place of birth for the foreign-born population - Nigeria (%)
Place of birth for the foreign-born population - Senegal (%)
Place of birth for the foreign-born population - Sierra Leone (%)
Place of birth for the foreign-born population - Other Western Africa (%)
Place of birth for the foreign-born population - Australia (%)
Place of birth for the foreign-born population - New Zealand (%)
Place of birth for the foreign-born population - Fiji (%)
Place of birth for the foreign-born population - Micronesia (%)
Place of birth for the foreign-born population - Bahamas (%)
Place of birth for the foreign-born population - Barbados (%)
Place of birth for the foreign-born population - Cuba (%)
Place of birth for the foreign-born population - Dominica (%)
Place of birth for the foreign-born population - Dominican Republic (%)
Place of birth for the foreign-born population - Grenada (%)
Place of birth for the foreign-born population - Haiti (%)
Place of birth for the foreign-born population - Jamaica (%)
Place of birth for the foreign-born population - St. Vincent and the Grenadines (%)
Place of birth for the foreign-born population - Trinidad and Tobago (%)
Place of birth for the foreign-born population - West Indies (%)
Place of birth for the foreign-born population - Other Caribbean (%)
Place of birth for the foreign-born population - Belize (%)
Place of birth for the foreign-born population - Costa Rica (%)
Place of birth for the foreign-born population - El Salvador (%)
Place of birth for the foreign-born population - Guatemala (%)
Place of birth for the foreign-born population - Honduras (%)
Place of birth for the foreign-born population - Mexico (%)
Place of birth for the foreign-born population - Nicaragua (%)
Place of birth for the foreign-born population - Panama (%)
Place of birth for the foreign-born population - Other Central America (%)
Place of birth for the foreign-born population - Argentina (%)
Place of birth for the foreign-born population - Bolivia (%)
Place of birth for the foreign-born population - Brazil (%)
Place of birth for the foreign-born population - Chile (%)
Place of birth for the foreign-born population - Colombia (%)
Place of birth for the foreign-born population - Ecuador (%)
Place of birth for the foreign-born population - Guyana (%)
Place of birth for the foreign-born population - Peru (%)
Place of birth for the foreign-born population - Uruguay (%)
Place of birth for the foreign-born population - Venezuela (%)
Place of birth for the foreign-born population - Other South America (%)
Place of birth for the foreign-born population - Canada (%)
Place of birth for the foreign-born population - Other Northern America (%)
Place of birth for the foreign-born population - Other (%)
Latest news about races in Waldorf, MD collected exclusively by city-data.com from local newspapers, TV, and radio stations
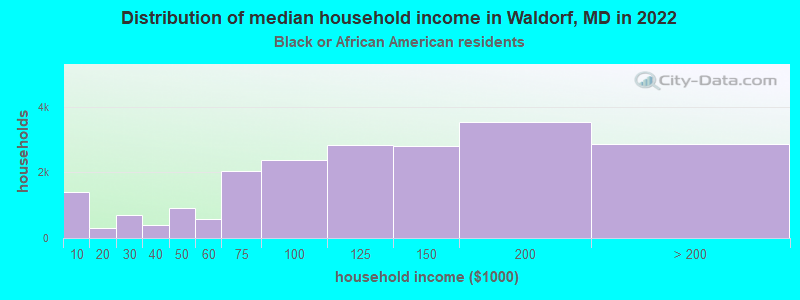
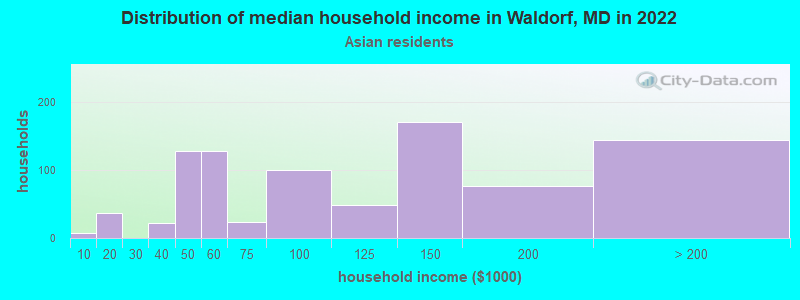
According to 2022 data, the most numerous races in Waldorf, MD are White alone (14,935 residents), Black alone (52,525 residents), and Hispanic (7,759 residents). 87.4% of Waldorf residents speak English at home. 10.2% of Waldorf, MD residents are foreign-born (3.9% born in Latin America, 2.8% born in Asia, 2.6% born in Africa), which is 56.3% less than the foreign-born rate of 16.0% across the entire state of Maryland.
Race distribution in Waldorf
2000 2022
3,286,547 62.1% White alone 1,464,735 27.7% Black alone 227,916 4.3% Hispanic 209,738 4.0% Asian alone 82,946 1.6% Two or more races 13,312 0.3% American Indian alone 9,379 0.2% Other race alone 1,913 0.04% Native Hawaiian and Other
2,906,492 47.1% White alone 1,800,914 29.2% Black alone 705,842 11.4% Hispanic 401,818 6.5% Asian alone 291,317 4.7% Two or more races 46,930 0.8% Other race alone 8,930 0.1% American Indian alone 2,417 0.04% Native Hawaiian and Other
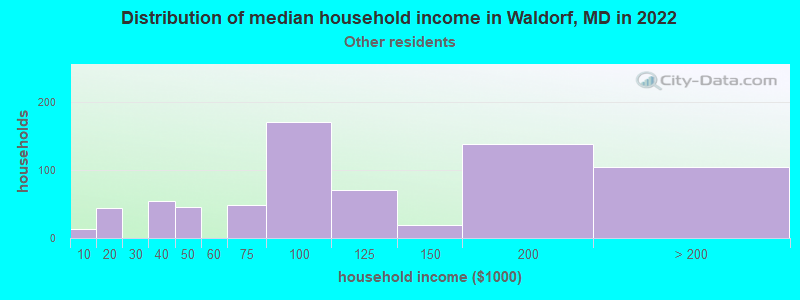
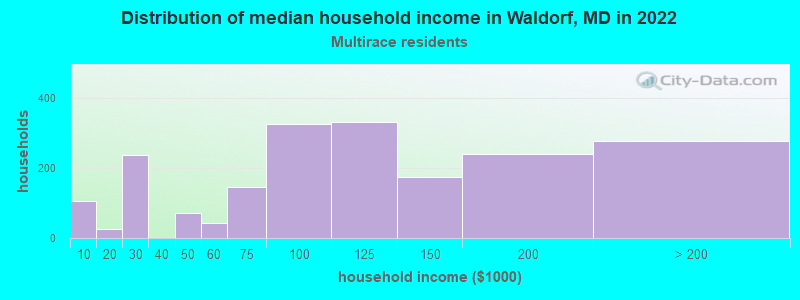
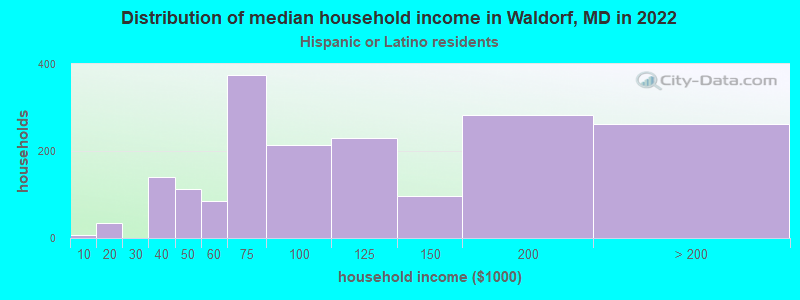
Income and house value in Waldorf Median household income in 2022 $103,011 White non-Hispanic householders$108,428 Black householders$58,896 American Indian and Alaska Native householders$190,556 Asian householders$103,320 Some other race householders$99,995 Two or more races householders$133,600 Hispanic or Latino race householdersMedian 2022 house value $383,710 White Non-Hispanic householders$374,644 Black or African American householders$373,174 American Indian or Alaska Native householders $455,258 Asian householders$389,101 Some other race householders$295,256 Two or more races householders$432,960 Hispanic or Latino householders
Median age by race in Waldorf
48.6 Median age for White residents46.0 50.3 35.2 Median age for Black or African American residents34.5 35.9 32.9 Median age for American Indian / Alaska Native residents39.1 42.2 47.4 Median age for Asian residents29.3 54.0 -666,666,666.0 Median age for Native Hawaiian / Pacific Islander residents-666,666,666.0 -666,666,666.0 32.4 Median age for Other race residents30.0 32.4 21.9 Median age for Two or more races residents31.1 15.5 48.7 Median age for White alone residents47.6 49.8 30.5 Median age for Hispanic or Latino residents30.5 30.0
Owner/renter occupied households by race in Waldorf
House owners and renters - White residents 5,067 81.3% Owner occupied1,167 18.7% Renter occupiedHouse owners and renters - Black or African American residents 14,410 69.4% Owner occupied6,351 30.6% Renter occupiedHouse owners and renters - American Indian / Alaska Native residents 211 78.8% Owner occupied57 21.2% Renter occupiedHouse owners and renters - Asian residents 549 65.0% Owner occupied295 35.0% Renter occupiedHouse owners and renters - Native Hawaiian / Pacific Islander residents 4 100.0% Owner occupiedHouse owners and renters - Other race residents 646 74.5% Owner occupied221 25.5% Renter occupiedHouse owners and renters - Two or more races residents 1,992 85.8% Owner occupied329 14.2% Renter occupiedHouse owners and renters - White alone residents 5,067 81.3% Owner occupied1,167 18.7% Renter occupiedHouse owners and renters - Hispanic or Latino residents 1,581 88.2% Owner occupied212 11.8% Renter occupied
Language usage in Waldorf
English speakers - Total 87.4% of residents of Waldorf speak English at home.
6.9% of residents speak Spanish at home 3,528 66.4% Speak English very well1,782 33.6% Speak English less than very well5.9% of residents speak other language at home 3,152 69.5% Speak English very well1,385 30.5% Speak English less than very well
English speakers - Born in the United States 96.1% of residents of Waldorf speak English at home.
3.0% of residents speak Spanish at home 1,191 93.0% Speak English very well90 7.0% Speak English less than very well0.9% of residents speak other language at home 261 70.0% Speak English very well112 30.0% Speak English less than very well
English speakers - Native, born elsewhere 63.9% of residents of Waldorf speak English at home.
22.1% of residents speak Spanish at home 226 69.8% Speak English very well98 30.2% Speak English less than very well15.5% of residents speak other language at home 195 85.5% Speak English very well33 14.5% Speak English less than very well
English speakers - Foreign-born 26.3% of residents of Waldorf speak English at home.
34.0% of residents speak Spanish at home 1,422 47.0% Speak English very well1,603 53.0% Speak English less than very well40.3% of residents speak other language at home 2,308 64.3% Speak English very well1,280 35.7% Speak English less than very well
White (Caucasian) - Speak only English Native:
93.3% (14,529)Foreign-born:
16.7% (95)
White (Caucasian) - Speak another language Native:
5.8% (900)Foreign-born:
78.8% (447)
Black or African American - Speak only English Native:
98.6% (46,236)Foreign-born:
41.0% (1,112)
Black or African American - Speak another language Native:
1.4% (642)Foreign-born:
59.0% (1,600)
American Indian / Alaska Native - Speak only English Native:
72.1% (247)Foreign-born:
42.1% (13)
Asian - Speak only English Native:
89.7% (531)Foreign-born:
11.6% (227)
Asian - Speak another language Native:
10.3% (61)Foreign-born:
88.4% (1,728)
Other race - Speak only English Native:
51.9% (745)Foreign-born:
7.0% (64)
Other race - Speak another language Native:
51.4% (738)Foreign-born:
92.7% (842)
Two or more races - Speak only English Native:
95.9% (5,811)Foreign-born:
4.2% (41)
Two or more races - Speak another language Native:
4.4% (267)Foreign-born:
100.0% (993)
White alone - Speak only English Native:
98.9% (14,074)Foreign-born:
25.5% (95)
White alone - Speak another language Native:
1.1% (156)Foreign-born:
77.6% (289)
Hispanic or Latino - Speak only English Native:
42.3% (1,283)Foreign-born:
3.6% (108)
Hispanic or Latino - Speak another language Native:
57.7% (1,747)Foreign-born:
96.4% (2,888)
Foreign-born residents in Waldorf 8,450 residents are foreign born (3.9% Latin America , 2.8% Asia , 2.6% Africa ).
This city:
10.2%Maryland:
15.7%
Marital status for residents in Waldorf Marital status - White (Caucasian) population 15 years and over
Males 42.5% Never married36.1% Now married1.1% Separated5.2% Widowed15.1% DivorcedFemales 28.6% Never married48.9% Now married0.0% Separated6.5% Widowed16.0% DivorcedWomen who gave birth in the past 12 months Now married:
19.6% (49)Unmarried:
80.4% (201)
Women who did not give birth in the past 12 months Now married:
38.1% (1,219)Unmarried:
61.9% (1,979)
Marital status - Black or African American population 15 years and over
Males 32.7% Never married53.4% Now married0.6% Separated0.9% Widowed12.5% DivorcedFemales 41.8% Never married33.5% Now married1.2% Separated6.4% Widowed17.2% DivorcedWomen who gave birth in the past 12 months Now married:
54.4% (615)Unmarried:
45.6% (516)
Women who did not give birth in the past 12 months Now married:
31.7% (4,257)Unmarried:
68.3% (9,153)
Marital status - American Indian / Alaska Native population 15 years and over
Males 7.7% Never married92.3% Now married0.0% Separated0.0% Widowed0.0% DivorcedFemales 7.1% Never married89.7% Now married0.0% Separated0.0% Widowed3.2% DivorcedWomen who did not give birth in the past 12 months Now married:
100.0% (79)Unmarried:
0.0% (0)
Marital status - Asian population 15 years and over
Males 55.0% Never married25.9% Now married0.0% Separated0.0% Widowed19.1% DivorcedFemales 27.4% Never married46.5% Now married0.0% Separated5.7% Widowed20.4% DivorcedWomen who gave birth in the past 12 months Now married:
100.0% (43)Unmarried:
0.0% (0)
Women who did not give birth in the past 12 months Now married:
41.5% (301)Unmarried:
58.5% (423)
Marital status - Native Hawaiian / Pacific Islander population 15 years and over
Males 100.0% Never married0.0% Now married0.0% Separated0.0% Widowed0.0% DivorcedFemales 0.0% Never married0.0% Now married0.0% Separated100.0% Widowed0.0% DivorcedMarital status - Other race population 15 years and over
Males 32.1% Never married60.2% Now married3.5% Separated0.0% Widowed4.2% DivorcedFemales 46.8% Never married50.2% Now married1.9% Separated0.0% Widowed1.2% DivorcedWomen who gave birth in the past 12 months Now married:
73.1% (95)Unmarried:
26.9% (35)
Women who did not give birth in the past 12 months Now married:
47.4% (382)Unmarried:
52.6% (425)
Marital status - Two or more races population 15 years and over
Males 55.1% Never married28.0% Now married7.8% Separated2.1% Widowed7.1% DivorcedFemales 50.0% Never married32.7% Now married1.6% Separated4.5% Widowed11.2% DivorcedWomen who gave birth in the past 12 months Now married:
8.6% (21)Unmarried:
91.4% (219)
Women who did not give birth in the past 12 months Now married:
31.6% (541)Unmarried:
68.4% (1,169)
Marital status - White alone, not Hispanic / Latino population 15 years and over
Males 40.9% Never married37.1% Now married1.2% Separated5.3% Widowed15.5% DivorcedFemales 29.1% Never married49.7% Now married0.0% Separated6.6% Widowed14.7% DivorcedWomen who gave birth in the past 12 months Now married:
19.6% (49)Unmarried:
80.4% (201)
Women who did not give birth in the past 12 months Now married:
38.1% (1,219)Unmarried:
61.9% (1,979)
Marital status - Hispanic or Latino population 15 years and over
Males 42.9% Never married44.0% Now married1.1% Separated0.0% Widowed12.0% DivorcedFemales 35.4% Never married55.5% Now married3.3% Separated2.2% Widowed3.6% DivorcedWomen who gave birth in the past 12 months Now married:
34.3% (100)Unmarried:
65.7% (192)
Women who did not give birth in the past 12 months Now married:
56.7% (1,006)Unmarried:
43.3% (769)
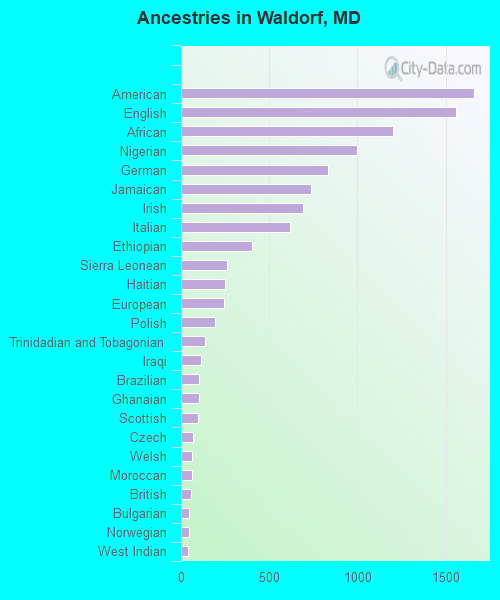
Ancestries in Waldorf
1,663 3.6% American1,558 3.4% English1,202 2.6% African997 2.2% Nigerian835 1.8% German738 1.6% Jamaican693 1.5% Irish618 1.3% Italian404 0.9% Ethiopian259 0.6% Sierra Leonean248 0.5% Haitian241 0.5% European193 0.4% Polish136 0.3% Trinidadian and Tobagonian112 0.2% Iraqi104 0.2% Brazilian104 0.2% Ghanaian98 0.2% Scottish68 0.1% Czech65 0.1% Welsh63 0.1% Moroccan55 0.1% British47 0.1% Bulgarian46 0.10% Norwegian42 0.09% West Indian34 0.07% British West Indian32 0.07% French25 0.05% Scotch-Irish20 0.04% Greek20 0.04% Slovak18 0.04% Finnish18 0.04% Northern European17 0.04% Barbadian12 0.03% Croatian11 0.02% Scandinavian10 0.02% Celtic9 0.02% Hungarian7 0.02% Guyanese7 0.02% Lebanese6 0.01% Ukrainian4 0.01% Dutch
Geographical mobility in Waldorf Same house 1 year ago 14,901 89.3% White (Caucasian)43,550 84.4% Black or African American290 68.2% American Indian / Alaska Native2,556 94.5% Asian18 100.0% Native Hawaiian / Pacific Islander2,531 95.2% Other race6,986 92.2% Two or more races13,304 89.6% White alone, not Hispanic / Latino6,193 87.6% Hispanic or LatinoMoved within same county 691 4.1% White / Caucasian3,044 5.9% Black or African American30 1.1% Asian16 0.6% Other race130 1.7% Two or more races706 4.8% White alone, not Hispanic / Latino76 1.1% Hispanic or LatinoMoved within same state 745 4.5% White / Caucasian1,984 3.8% Black or African American180 42.5% American Indian / Alaska Native38 1.4% Asian75 2.8% Other race219 2.9% Two or more races492 3.3% White alone, not Hispanic / Latino588 8.3% Hispanic or LatinoMoved from different state 338 2.0% White / Caucasian2,608 5.1% Black or African American51 1.9% Asian44 1.6% Other race224 3.0% Two or more races316 2.1% White alone, not Hispanic / Latino230 3.2% Hispanic or LatinoMoved from abroad 53 0.3% White399 0.8% Black or African American11 0.4% Asian43 1.6% Other race50 0.7% Two or more races53 0.4% White alone, not Hispanic / Latino41 0.6% Hispanic or Latino
Children Nativity (place of birth) in Waldorf
Children under 6 years - Living with two parents Both parents native 3,391 100.0% NativeBoth parents foreign-born 684 95.4% Native33 4.6% Foreign-bornOne native, one foreign-born parent 441 100.0% NativeChildren under 6 years - Living with one parent Native parent 839 100.0% NativeForeign-born parent 372 92.1% Native32 7.9% Foreign-bornChildren 6 to 17 years - Living with two parents Both parents native 6,876 100.0% NativeBoth parents foreign-born 691 52.3% Native631 47.7% Foreign-bornOne native, one foreign-born parent 693 90.0% Native77 10.0% Foreign-bornChildren 6 to 17 years - Living with one parent Native parent 4,030 100.0% NativeForeign-born parent 639 42.7% Native858 57.3% Foreign-born
Grandparents responsible for own grandchildren in Waldorf
Grandparents (30 to 59 years) White / Caucasian 37 49.7% Responsible for grandchildren37 50.3% Not responsible for grandchildrenBlack or African American 223 24.2% Responsible for grandchildren701 75.8% Not responsible for grandchildrenAsian 5 100.0% Not responsible for grandchildrenOther race 18 100.0% Not responsible for grandchildrenTwo or more races 23 20.2% Responsible for grandchildren92 79.8% Not responsible for grandchildrenWhite alone, not Hispanic / Latino 38 50.2% Responsible for grandchildren37 49.8% Not responsible for grandchildrenHispanic or Latino 17 100.0% Not responsible for grandchildrenGrandparents (60 years and over) White / Caucasian 76 33.3% Responsible for grandchildren153 66.7% Not responsible for grandchildrenBlack or African American 95 16.4% Responsible for grandchildren485 83.6% Not responsible for grandchildrenAsian 36 29.8% Responsible for grandchildren85 70.2% Not responsible for grandchildrenTwo or more races 23 100.0% Responsible for grandchildrenWhite alone, not Hispanic / Latino 76 33.3% Responsible for grandchildren153 66.7% Not responsible for grandchildrenHispanic or Latino 11 100.0% Not responsible for grandchildren