Races in Walden, New York (NY) Detailed Stats
Data:
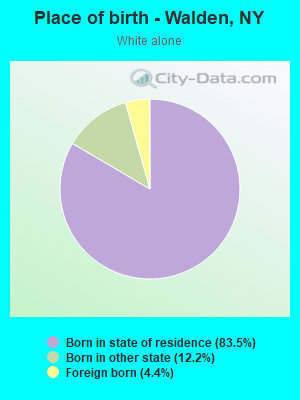
Races - White alone (%)
Races - White alone (% change since 2000)
Races - Black alone (%)
Races - Black alone (% change since 2000)
Races - American Indian alone (%)
Races - American Indian alone (% change since 2000)
Races - Asian alone (%)
Races - Asian alone (% change since 2000)
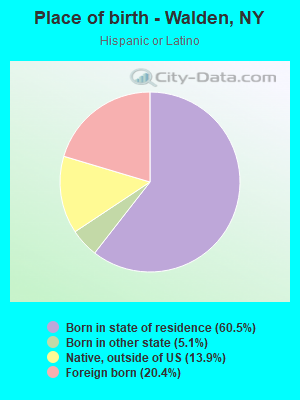
Races - Hispanic (%)
Races - Hispanic (% change since 2000)
Races - Native Hawaiian and Other Pacific Islander alone (%)
Races - Native Hawaiian and Other Pacific Islander alone (% change since 2000)
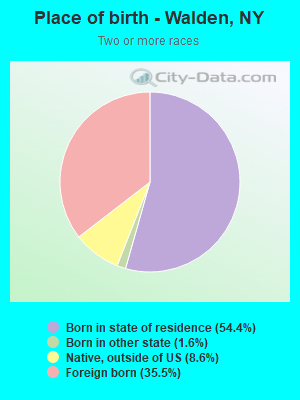
Races - Two or more races(%)
Races - Two or more races(% change since 2000)
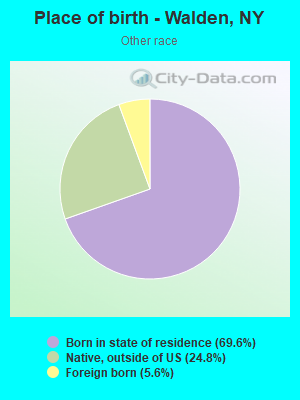
Races - Other race alone (%)
Races - Other race alone (% change since 2000)
Racial diversity
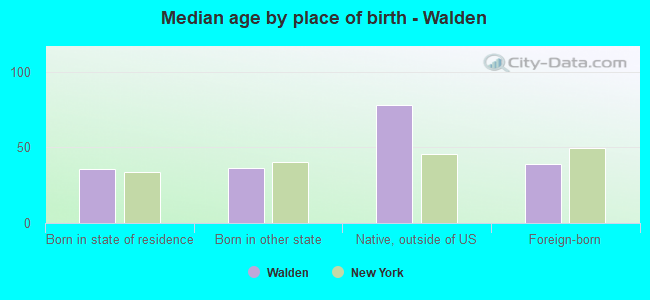
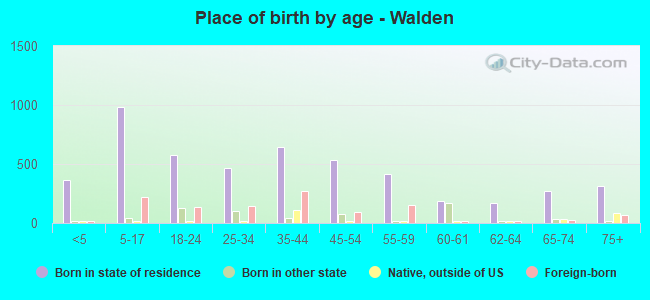
Place of birth - Born in state of residence (%)
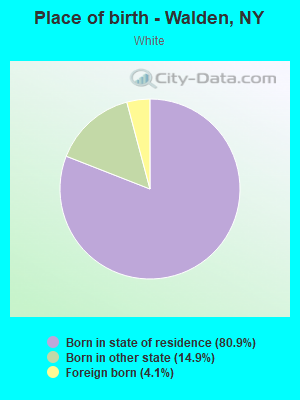
Place of birth - Born in state of residence (%) - White
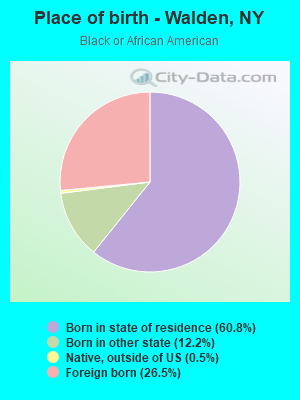
Place of birth - Born in state of residence (%) - Black or African American
Place of birth - Born in state of residence (%) - Asian
Place of birth - Born in state of residence (%) - Hispanic or Latino
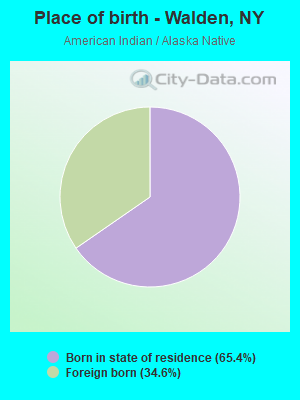
Place of birth - Born in state of residence (%) - American Indian and Alaska Native
Place of birth - Born in state of residence (%) - Multirace
Place of birth - Born in state of residence (%) - Other Race
Place of birth - Born in other state (%)
Place of birth - Born in other state (%) - White
Place of birth - Born in other state (%) - Black or African American
Place of birth - Born in other state (%) - Asian
Place of birth - Born in other state (%) - Hispanic or Latino
Place of birth - Born in other state (%) - American Indian and Alaska Native
Place of birth - Born in other state (%) - Multirace
Place of birth - Born in other state (%) - Other Race
Place of birth - Native, outside of US (%)
Place of birth - Native, outside of US (%) - White
Place of birth - Native, outside of US (%) - Black or African American
Place of birth - Native, outside of US (%) - Asian
Place of birth - Native, outside of US (%) - Hispanic or Latino
Place of birth - Native, outside of US (%) - American Indian and Alaska Native
Place of birth - Native, outside of US (%) - Multirace
Place of birth - Native, outside of US (%) - Other Race
Place of birth - Foreign born (%)
Place of birth - Foreign born (%) - White
Place of birth - Foreign born (%) - Black or African American
Place of birth - Foreign born (%) - Asian
Place of birth - Foreign born (%) - Hispanic or Latino
Place of birth - Foreign born (%) - American Indian and Alaska Native
Place of birth - Foreign born (%) - Multirace
Place of birth - Foreign born (%) - Other Race
Residents speaking English at home (%)
Residents speaking English at home - Born in the United States (%)
Residents speaking English at home - Native, born elsewhere (%)
Residents speaking English at home - Foreign born (%)
Residents speaking Spanish at home (%)
Residents speaking Spanish at home - Born in the United States (%)
Residents speaking Spanish at home - Native, born elsewhere (%)
Residents speaking Spanish at home - Foreign born (%)
Residents speaking other language at home (%)
Residents speaking other language at home - Born in the United States (%)
Residents speaking other language at home - Native, born elsewhere (%)
Residents speaking other language at home - Foreign born (%)
Marital status - Never married (%)
Marital status - Now married (%)
Marital status - Separated (%)
Marital status - Widowed (%)
Marital status - Divorced (%)
Ancestries Reported - Arab (%)
Ancestries Reported - Czech (%)
Ancestries Reported - Danish (%)
Ancestries Reported - Dutch (%)
Ancestries Reported - English (%)
Ancestries Reported - French (%)
Ancestries Reported - French Canadian (%)
Ancestries Reported - German (%)
Ancestries Reported - Greek (%)
Ancestries Reported - Hungarian (%)
Ancestries Reported - Irish (%)
Ancestries Reported - Italian (%)
Ancestries Reported - Lithuanian (%)
Ancestries Reported - Norwegian (%)
Ancestries Reported - Polish (%)
Ancestries Reported - Portuguese (%)
Ancestries Reported - Russian (%)
Ancestries Reported - Scotch-Irish (%)
Ancestries Reported - Scottish (%)
Ancestries Reported - Slovak (%)
Ancestries Reported - Subsaharan African (%)
Ancestries Reported - Swedish (%)
Ancestries Reported - Swiss (%)
Ancestries Reported - Ukrainian (%)
Ancestries Reported - United States (%)
Ancestries Reported - Welsh (%)
Ancestries Reported - West Indian (%)
Ancestries Reported - Other (%)
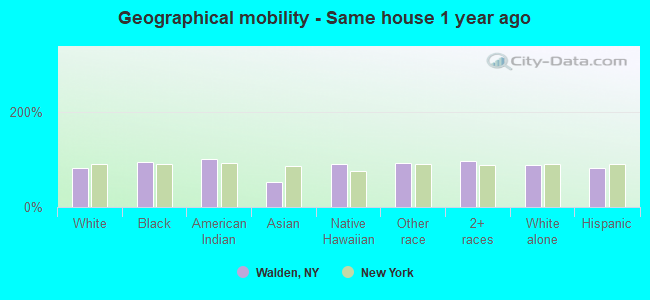
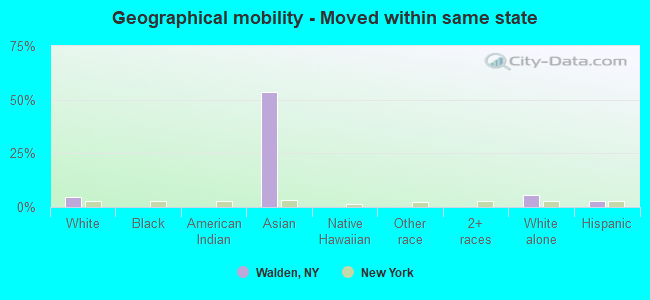
Geographical mobility - Same house 1 year ago (%)
Geographical mobility - Same house 1 year ago (%) - White
Geographical mobility - Same house 1 year ago (%) - Black or African American
Geographical mobility - Same house 1 year ago (%) - Asian
Geographical mobility - Same house 1 year ago (%) - Hispanic or Latino
Geographical mobility - Same house 1 year ago (%) - American Indian and Alaska Native
Geographical mobility - Same house 1 year ago (%) - Multirace
Geographical mobility - Same house 1 year ago (%) - Other Race
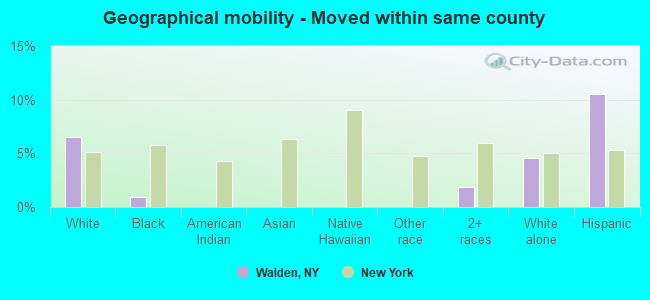
Geographical mobility - Moved within same county (%)
Geographical mobility - Moved within same county (%) - White
Geographical mobility - Moved within same county (%) - Black or African American
Geographical mobility - Moved within same county (%) - Asian
Geographical mobility - Moved within same county (%) - Hispanic or Latino
Geographical mobility - Moved within same county (%) - American Indian and Alaska Native
Geographical mobility - Moved within same county (%) - Multirace
Geographical mobility - Moved within same county (%) - Other Race
Geographical mobility - Moved from different county within same state (%)
Geographical mobility - Moved from different county within same state (%) - White
Geographical mobility - Moved from different county within same state (%) - Black or African American
Geographical mobility - Moved from different county within same state (%) - Asian
Geographical mobility - Moved from different county within same state (%) - Hispanic or Latino
Geographical mobility - Moved from different county within same state (%) - American Indian and Alaska Native
Geographical mobility - Moved from different county within same state (%) - Multirace
Geographical mobility - Moved from different county within same state (%) - Other Race
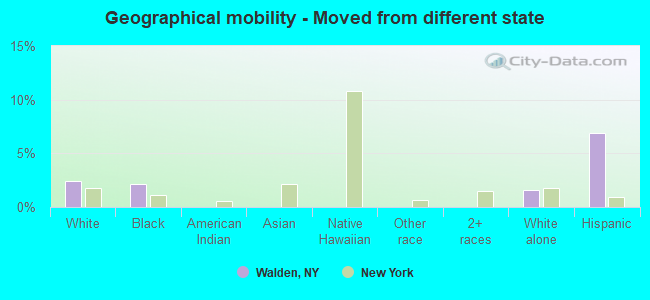
Geographical mobility - Moved from different state (%)
Geographical mobility - Moved from different state (%) - White
Geographical mobility - Moved from different state (%) - Black or African American
Geographical mobility - Moved from different state (%) - Asian
Geographical mobility - Moved from different state (%) - Hispanic or Latino
Geographical mobility - Moved from different state (%) - American Indian and Alaska Native
Geographical mobility - Moved from different state (%) - Multirace
Geographical mobility - Moved from different state (%) - Other Race
Geographical mobility - Moved from abroad (%)
Geographical mobility - Moved from abroad (%) - White
Geographical mobility - Moved from abroad (%) - Black or African American
Geographical mobility - Moved from abroad (%) - Asian
Geographical mobility - Moved from abroad (%) - Hispanic or Latino
Geographical mobility - Moved from abroad (%) - American Indian and Alaska Native
Geographical mobility - Moved from abroad (%) - Multirace
Geographical mobility - Moved from abroad (%) - Other Race
Place of birth for the foreign-born population - Ireland (%)
Place of birth for the foreign-born population - Denmark (%)
Place of birth for the foreign-born population - Norway (%)
Place of birth for the foreign-born population - Sweden (%)
Place of birth for the foreign-born population - United Kingdom (%)
Place of birth for the foreign-born population - England (%)
Place of birth for the foreign-born population - Scotland (%)
Place of birth for the foreign-born population - Other Northern Europe (%)
Place of birth for the foreign-born population - Austria (%)
Place of birth for the foreign-born population - Belgium (%)
Place of birth for the foreign-born population - France (%)
Place of birth for the foreign-born population - Germany (%)
Place of birth for the foreign-born population - Netherlands (%)
Place of birth for the foreign-born population - Switzerland (%)
Place of birth for the foreign-born population - Other Western Europe (%)
Place of birth for the foreign-born population - Greece (%)
Place of birth for the foreign-born population - Italy (%)
Place of birth for the foreign-born population - Portugal (%)
Place of birth for the foreign-born population - Spain (%)
Place of birth for the foreign-born population - Other Southern Europe (%)
Place of birth for the foreign-born population - Albania (%)
Place of birth for the foreign-born population - Belarus (%)
Place of birth for the foreign-born population - Bosnia and Herzegovina (%)
Place of birth for the foreign-born population - Bulgaria (%)
Place of birth for the foreign-born population - Croatia (%)
Place of birth for the foreign-born population - Czechoslovakia (%)
Place of birth for the foreign-born population - Hungary (%)
Place of birth for the foreign-born population - Latvia (%)
Place of birth for the foreign-born population - Lithuania (%)
Place of birth for the foreign-born population - North Macedonia (Macedonia) (%)
Place of birth for the foreign-born population - Moldova (%)
Place of birth for the foreign-born population - Poland (%)
Place of birth for the foreign-born population - Romania (%)
Place of birth for the foreign-born population - Russia (%)
Place of birth for the foreign-born population - Serbia (%)
Place of birth for the foreign-born population - Ukraine (%)
Place of birth for the foreign-born population - Other Eastern Europe (%)
Place of birth for the foreign-born population - China (%)
Place of birth for the foreign-born population - Hong Kong (%)
Place of birth for the foreign-born population - Taiwan (%)
Place of birth for the foreign-born population - Japan (%)
Place of birth for the foreign-born population - Korea (%)
Place of birth for the foreign-born population - Other Eastern Asia (%)
Place of birth for the foreign-born population - Afghanistan (%)
Place of birth for the foreign-born population - Bangladesh (%)
Place of birth for the foreign-born population - India (%)
Place of birth for the foreign-born population - Iran (%)
Place of birth for the foreign-born population - Kazakhstan (%)
Place of birth for the foreign-born population - Nepal (%)
Place of birth for the foreign-born population - Pakistan (%)
Place of birth for the foreign-born population - Sri Lanka (%)
Place of birth for the foreign-born population - Uzbekistan (%)
Place of birth for the foreign-born population - Other South Central Asia (%)
Place of birth for the foreign-born population - Burma (%)
Place of birth for the foreign-born population - Cambodia (%)
Place of birth for the foreign-born population - Indonesia (%)
Place of birth for the foreign-born population - Laos (%)
Place of birth for the foreign-born population - Malaysia (%)
Place of birth for the foreign-born population - Philippines (%)
Place of birth for the foreign-born population - Singapore (%)
Place of birth for the foreign-born population - Thailand (%)
Place of birth for the foreign-born population - Vietnam (%)
Place of birth for the foreign-born population - Other South Eastern Asia (%)
Place of birth for the foreign-born population - Armenia (%)
Place of birth for the foreign-born population - Iraq (%)
Place of birth for the foreign-born population - Israel (%)
Place of birth for the foreign-born population - Jordan (%)
Place of birth for the foreign-born population - Kuwait (%)
Place of birth for the foreign-born population - Lebanon (%)
Place of birth for the foreign-born population - Saudi Arabia (%)
Place of birth for the foreign-born population - Syria (%)
Place of birth for the foreign-born population - Turkey (%)
Place of birth for the foreign-born population - Yemen (%)
Place of birth for the foreign-born population - Other Western Asia (%)
Place of birth for the foreign-born population - Eritrea (%)
Place of birth for the foreign-born population - Ethiopia (%)
Place of birth for the foreign-born population - Kenya (%)
Place of birth for the foreign-born population - Somalia (%)
Place of birth for the foreign-born population - Uganda (%)
Place of birth for the foreign-born population - Zimbabwe (%)
Place of birth for the foreign-born population - Other Eastern Africa (%)
Place of birth for the foreign-born population - Cameroon (%)
Place of birth for the foreign-born population - Congo (%)
Place of birth for the foreign-born population - Democratic Republic of Congo (Zaire) (%)
Place of birth for the foreign-born population - Other Middle Africa (%)
Place of birth for the foreign-born population - Egypt (%)
Place of birth for the foreign-born population - Morocco (%)
Place of birth for the foreign-born population - Sudan (%)
Place of birth for the foreign-born population - Other Northern Africa (%)
Place of birth for the foreign-born population - South Africa (%)
Place of birth for the foreign-born population - Other Southern Africa (%)
Place of birth for the foreign-born population - Cabo Verde (%)
Place of birth for the foreign-born population - Ghana (%)
Place of birth for the foreign-born population - Liberia (%)
Place of birth for the foreign-born population - Nigeria (%)
Place of birth for the foreign-born population - Senegal (%)
Place of birth for the foreign-born population - Sierra Leone (%)
Place of birth for the foreign-born population - Other Western Africa (%)
Place of birth for the foreign-born population - Australia (%)
Place of birth for the foreign-born population - New Zealand (%)
Place of birth for the foreign-born population - Fiji (%)
Place of birth for the foreign-born population - Micronesia (%)
Place of birth for the foreign-born population - Bahamas (%)
Place of birth for the foreign-born population - Barbados (%)
Place of birth for the foreign-born population - Cuba (%)
Place of birth for the foreign-born population - Dominica (%)
Place of birth for the foreign-born population - Dominican Republic (%)
Place of birth for the foreign-born population - Grenada (%)
Place of birth for the foreign-born population - Haiti (%)
Place of birth for the foreign-born population - Jamaica (%)
Place of birth for the foreign-born population - St. Vincent and the Grenadines (%)
Place of birth for the foreign-born population - Trinidad and Tobago (%)
Place of birth for the foreign-born population - West Indies (%)
Place of birth for the foreign-born population - Other Caribbean (%)
Place of birth for the foreign-born population - Belize (%)
Place of birth for the foreign-born population - Costa Rica (%)
Place of birth for the foreign-born population - El Salvador (%)
Place of birth for the foreign-born population - Guatemala (%)
Place of birth for the foreign-born population - Honduras (%)
Place of birth for the foreign-born population - Mexico (%)
Place of birth for the foreign-born population - Nicaragua (%)
Place of birth for the foreign-born population - Panama (%)
Place of birth for the foreign-born population - Other Central America (%)
Place of birth for the foreign-born population - Argentina (%)
Place of birth for the foreign-born population - Bolivia (%)
Place of birth for the foreign-born population - Brazil (%)
Place of birth for the foreign-born population - Chile (%)
Place of birth for the foreign-born population - Colombia (%)
Place of birth for the foreign-born population - Ecuador (%)
Place of birth for the foreign-born population - Guyana (%)
Place of birth for the foreign-born population - Peru (%)
Place of birth for the foreign-born population - Uruguay (%)
Place of birth for the foreign-born population - Venezuela (%)
Place of birth for the foreign-born population - Other South America (%)
Place of birth for the foreign-born population - Canada (%)
Place of birth for the foreign-born population - Other Northern America (%)
Place of birth for the foreign-born population - Other (%)
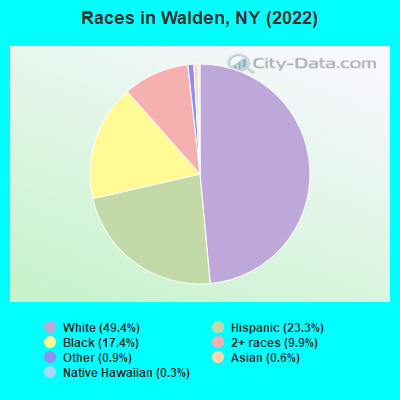
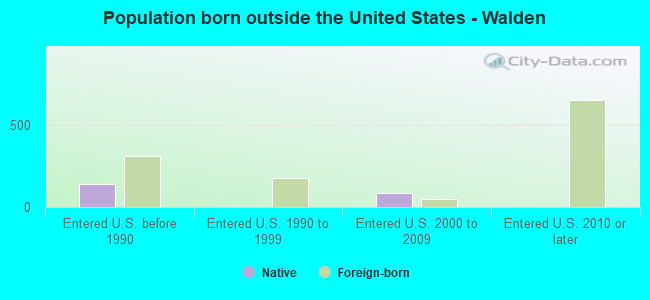
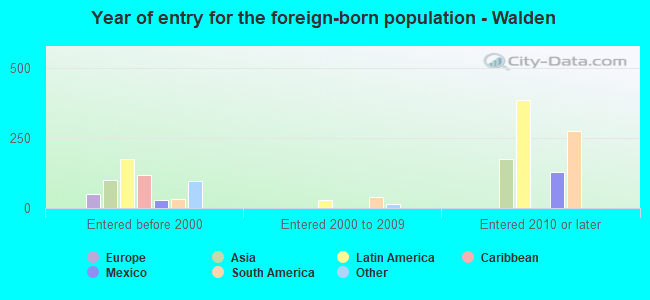
According to 2022 data, the most numerous races in Walden, NY are White alone (3,429 residents), Hispanic (1,618 residents), and Black alone (1,211 residents). 79.9% of Walden residents speak English at home. 14.2% of Walden, NY residents are foreign-born (6.1% born in Latin America, 4.9% born in Asia, 2.4% born in Africa), which is 54.9% less than the foreign-born rate of 22.0% across the entire state of New York.
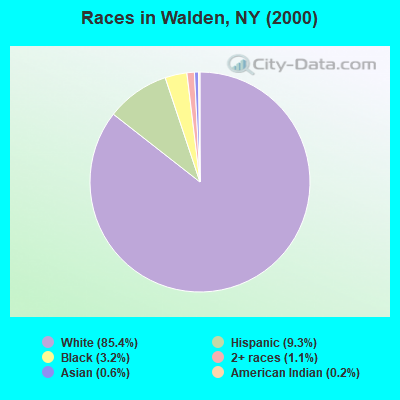
Race distribution in Walden
2000 2022
11,760,981 62.0% White alone 2,867,583 15.1% Hispanic 2,812,623 14.8% Black alone 1,035,926 5.5% Asian alone 366,116 1.9% Two or more races 75,499 0.4% Other race alone 52,499 0.3% American Indian alone 5,230 0.03% Native Hawaiian and Other
10,408,933 52.9% White alone 3,867,299 19.7% Hispanic 2,633,840 13.4% Black alone 1,776,286 9.0% Asian alone 732,670 3.7% Two or more races 216,110 1.1% Other race alone 35,082 0.2% American Indian alone 6,931 0.04% Native Hawaiian and Other
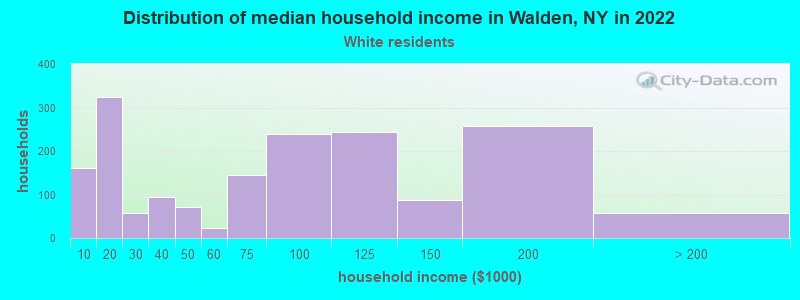
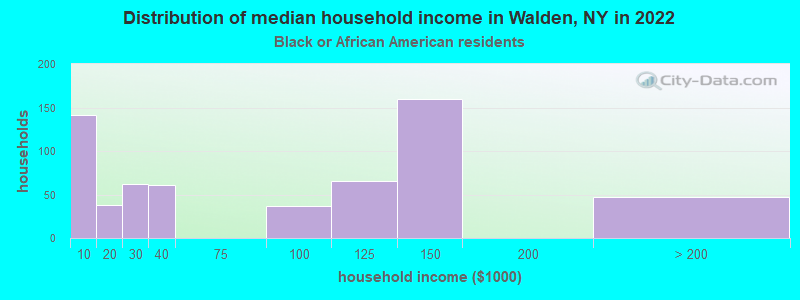
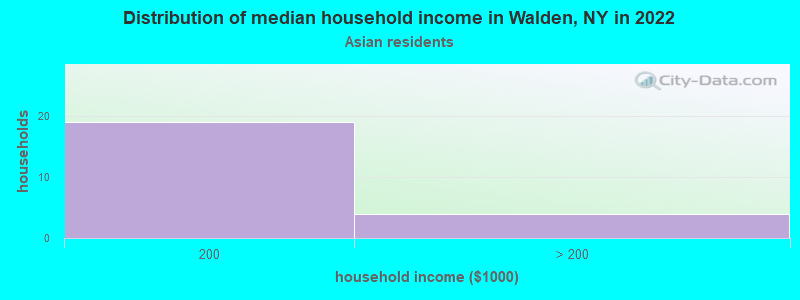
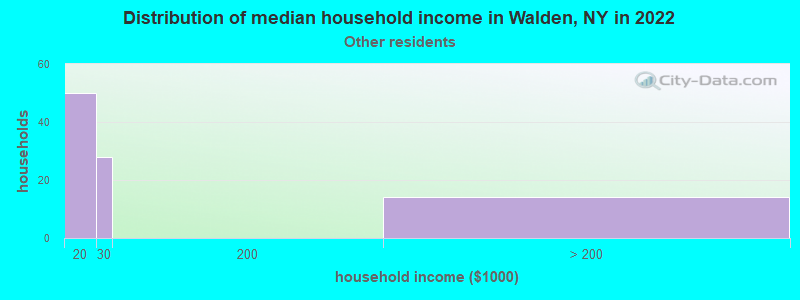
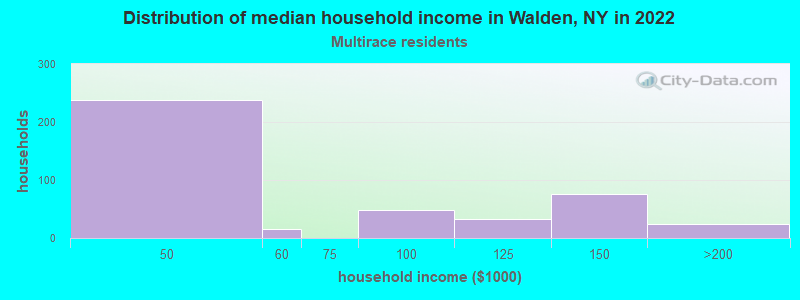
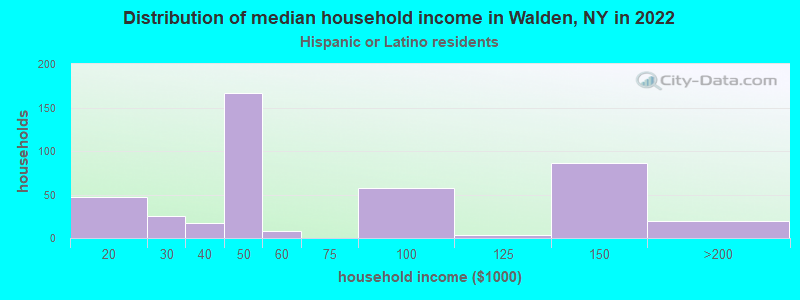
Income and house value in Walden Median household income in 2022 $74,812 White non-Hispanic householders$22,596 Some other race householders$85,982 Two or more races householders$49,244 Hispanic or Latino race householdersMedian 2022 house value $337,331 White Non-Hispanic householders$454,331 Black or African American householders$374,998 Two or more races householders$437,664 Hispanic or Latino householders
Median age by race in Walden
47.2 Median age for White residents49.3 43.2 39.4 Median age for Black or African American residents35.9 44.2 15.2 Median age for American Indian / Alaska Native residents15.8 -603,603,603.0 27.9 Median age for Asian residents-752,567,693.0 7.5 -487,992,314.6 Median age for Native Hawaiian / Pacific Islander residents-477,502,295.2 -497,387,669.3 27.6 Median age for Other race residents13.3 38.3 21.1 Median age for Two or more races residents28.9 20.4 49.3 Median age for White alone residents54.0 48.8 19.8 Median age for Hispanic or Latino residents24.5 18.3
Owner/renter occupied households by race in Walden
House owners and renters - White residents 1,105 62.7% Owner occupied657 37.3% Renter occupiedHouse owners and renters - Black or African American residents 211 40.2% Owner occupied314 59.8% Renter occupiedHouse owners and renters - American Indian / Alaska Native residents 6 100.0% Owner occupiedHouse owners and renters - Asian residents 25 100.0% Owner occupiedHouse owners and renters - Other race residents 140 100.0% Owner occupiedHouse owners and renters - Two or more races residents 366 85.6% Owner occupied62 14.4% Renter occupiedHouse owners and renters - White alone residents 1,142 65.2% Owner occupied609 34.8% Renter occupiedHouse owners and renters - Hispanic or Latino residents 344 76.7% Owner occupied105 23.3% Renter occupied
Language usage in Walden
English speakers - Total 79.9% of residents of Walden speak English at home.
10.4% of residents speak Spanish at home 501 73.2% Speak English very well183 26.8% Speak English less than very well7.1% of residents speak other language at home 357 76.3% Speak English very well111 23.7% Speak English less than very well
All residents speak only English at home
English speakers - Native, born elsewhere 17.3% of residents of Walden speak English at home.
81.1% of residents speak Spanish at home 117 59.4% Speak English very well80 40.6% Speak English less than very well
English speakers - Foreign-born 35.2% of residents of Walden speak English at home.
23.9% of residents speak Spanish at home 144 56.2% Speak English very well112 43.8% Speak English less than very well37.0% of residents speak other language at home 304 76.6% Speak English very well93 23.4% Speak English less than very well
White (Caucasian) - Speak only English Native:
93.7% (3,067)Foreign-born:
32.8% (48)
White (Caucasian) - Speak another language Native:
3.0% (98)Foreign-born:
64.2% (94)
Black or African American - Speak only English Native:
96.4% (903)Foreign-born:
64.4% (217)
Black or African American - Speak another language Native:
0.7% (6)Foreign-born:
14.1% (47)
American Indian / Alaska Native - Speak another language Native:
100.0% (43)Foreign-born:
100.0% (23)
Asian - Speak only English Native:
100.0% (1)Foreign-born:
59.4% (24)
Other race - Speak only English Native:
66.2% (218)Foreign-born:
100.0% (24)
Two or more races - Speak only English Native:
72.0% (735)Foreign-born:
4.3% (30)
Two or more races - Speak another language Native:
27.4% (280)Foreign-born:
100.0% (712)
White alone - Speak only English Native:
92.2% (2,958)Foreign-born:
31.6% (48)
White alone - Speak another language Native:
3.0% (95)Foreign-born:
65.9% (99)
Hispanic or Latino - Speak only English Native:
65.1% (689)Foreign-born:
12.4% (38)
Hispanic or Latino - Speak another language Native:
34.5% (365)Foreign-born:
86.2% (266)
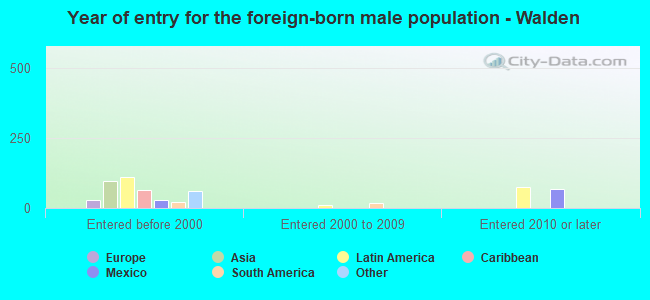
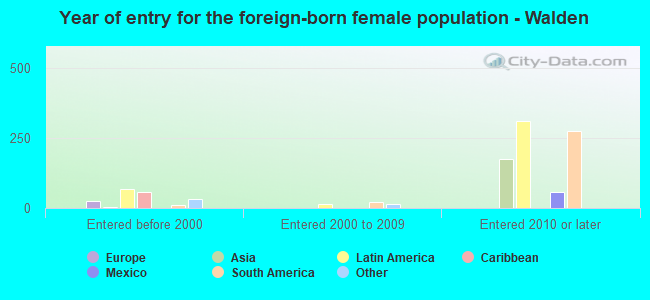
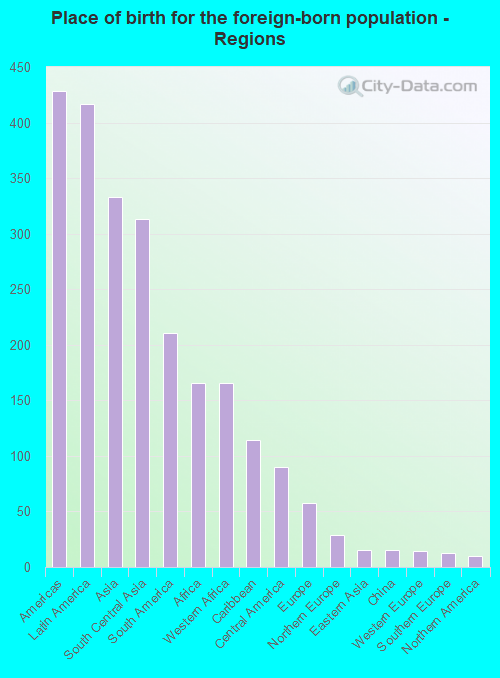
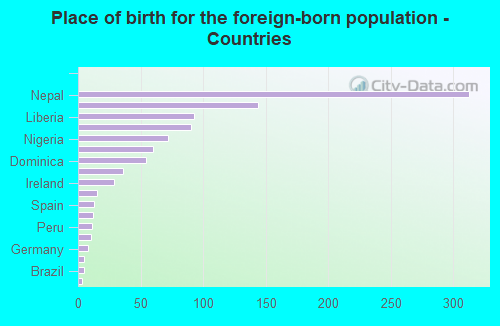
Foreign-born residents in Walden 986 residents are foreign born (6.1% Latin America , 4.9% Asia , 2.4% Africa ).
This city:
14.2%New York:
22.6%
Marital status for residents in Walden Marital status - White (Caucasian) population 15 years and over
Males 28.5% Never married44.9% Now married0.0% Separated1.6% Widowed24.9% DivorcedFemales 31.2% Never married39.8% Now married1.9% Separated16.0% Widowed11.0% DivorcedWomen who gave birth in the past 12 months Now married:
100.0% (9)Unmarried:
0.0% (0)
Women who did not give birth in the past 12 months Now married:
40.3% (335)Unmarried:
59.7% (496)
Marital status - Black or African American population 15 years and over
Males 54.2% Never married30.7% Now married1.2% Separated0.0% Widowed13.9% DivorcedFemales 45.6% Never married34.0% Now married8.3% Separated0.0% Widowed12.1% DivorcedWomen who did not give birth in the past 12 months Now married:
38.5% (128)Unmarried:
61.5% (203)
Marital status - American Indian / Alaska Native population 15 years and over
Males 31.8% Never married68.2% Now married0.0% Separated0.0% Widowed0.0% DivorcedFemales 0.0% Never married100.0% Now married0.0% Separated0.0% Widowed0.0% DivorcedWomen who did not give birth in the past 12 months Now married:
100.0% (6)Unmarried:
0.0% (0)
Marital status - Asian population 15 years and over
Males 0.0% Never married100.0% Now married0.0% Separated0.0% Widowed0.0% DivorcedFemales 0.0% Never married20.0% Now married0.0% Separated80.0% Widowed0.0% DivorcedWomen who did not give birth in the past 12 months Now married:
100.0% (1)Unmarried:
0.0% (0)
Marital status - Other race population 15 years and over
Males 0.0% Never married41.2% Now married0.0% Separated0.0% Widowed58.8% DivorcedFemales 20.5% Never married30.7% Now married17.6% Separated31.3% Widowed0.0% DivorcedWomen who did not give birth in the past 12 months Now married:
68.4% (104)Unmarried:
31.6% (48)
Marital status - Two or more races population 15 years and over
Males 29.6% Never married64.1% Now married0.0% Separated0.0% Widowed6.3% DivorcedFemales 53.5% Never married39.6% Now married0.0% Separated2.2% Widowed4.7% DivorcedWomen who gave birth in the past 12 months Now married:
0.0% (0)Unmarried:
100.0% (18)
Women who did not give birth in the past 12 months Now married:
42.4% (236)Unmarried:
57.6% (321)
Marital status - White alone, not Hispanic / Latino population 15 years and over
Males 26.8% Never married45.4% Now married0.0% Separated1.7% Widowed26.1% DivorcedFemales 31.7% Never married38.1% Now married2.0% Separated16.7% Widowed11.5% DivorcedWomen who gave birth in the past 12 months Now married:
100.0% (9)Unmarried:
0.0% (0)
Women who did not give birth in the past 12 months Now married:
36.9% (303)Unmarried:
63.1% (517)
Marital status - Hispanic or Latino population 15 years and over
Males 30.2% Never married66.7% Now married0.0% Separated0.0% Widowed3.2% DivorcedFemales 37.0% Never married45.5% Now married6.3% Separated11.2% Widowed0.0% DivorcedWomen who gave birth in the past 12 months Now married:
0.0% (0)Unmarried:
100.0% (7)
Women who did not give birth in the past 12 months Now married:
57.6% (252)Unmarried:
42.4% (185)
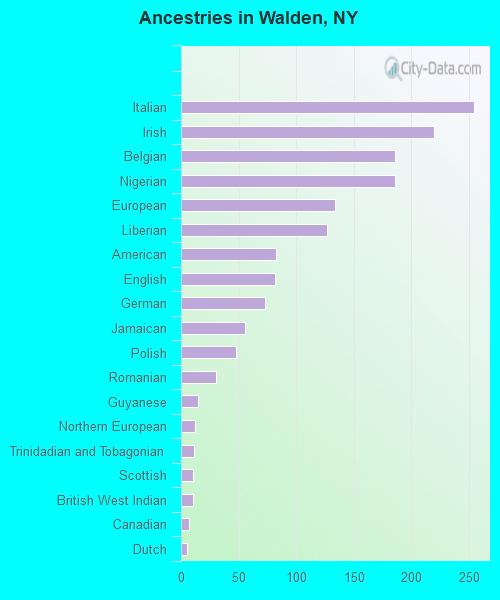
Ancestries in Walden
255 9.5% Italian220 8.2% Irish186 6.9% Belgian186 6.9% Nigerian134 5.0% European127 4.7% Liberian83 3.1% American82 3.0% English73 2.7% German56 2.1% Jamaican48 1.8% Polish30 1.1% Romanian15 0.6% Guyanese12 0.4% Northern European11 0.4% Trinidadian and Tobagonian10 0.4% Scottish10 0.4% British West Indian7 0.3% Canadian5 0.2% Dutch1 0.04% Hungarian
Children Nativity (place of birth) in Walden
Children under 6 years - Living with two parents Both parents native 187 100.0% NativeBoth parents foreign-born 12 49.2% Native12 50.8% Foreign-bornOne native, one foreign-born parent 89 100.0% NativeChildren under 6 years - Living with one parent Native parent 160 100.0% NativeChildren 6 to 17 years - Living with two parents Both parents native 284 100.0% NativeBoth parents foreign-born 136 37.1% Native231 62.9% Foreign-bornOne native, one foreign-born parent 105 100.0% NativeChildren 6 to 17 years - Living with one parent Native parent 477 100.0% Native
Grandparents responsible for own grandchildren in Walden
Grandparents (30 to 59 years) Two or more races 6 41.8% Responsible for grandchildren8 58.2% Not responsible for grandchildrenHispanic or Latino 5 40.2% Responsible for grandchildren8 59.8% Not responsible for grandchildren
Grandparents (60 years and over) Two or more races 18 100.0% Responsible for grandchildren