Races in Wailea-Makena, Hawaii (HI) Detailed Stats
Ancestries, Foreign-born residents, place of birth

Discuss Wailea-Makena, Hawaii races on our local forum with over 2,400,000 registered users
12.5% of Wailea-Makena, HI residents are foreign-born (4.0% born in Asia, 3.7% born in Europe, 2.2% born in Latin America, 1.3% born in North America), which is 43.8% less than the foreign-born rate of 18.0% across the entire state of Hawaii.
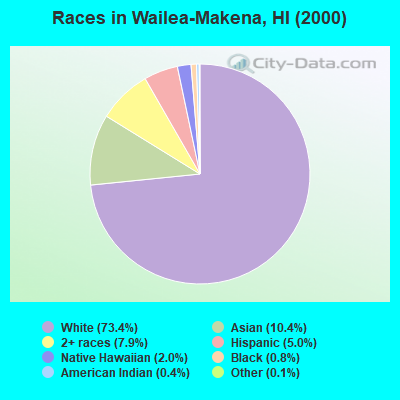
Race distribution in Wailea-Makena

- 4,16373.4%White alone
- 58810.4%Asian alone
- 4467.9%Two or more races
- 2845.0%Hispanic
- 1162.0%Native Hawaiian and Other
Pacific Islander alone - 430.8%Black alone
- 250.4%American Indian alone
- 60.1%Other race alone
2000
2022
-
- 494,14940.8%Asian alone
- 277,09122.9%White alone
- 218,70018.1%Two or more races
- 108,4419.0%Native Hawaiian and Other
Pacific Islander alone - 87,6997.2%Hispanic
- 20,8291.7%Black alone
- 2,0890.2%Other race alone
- 2,5390.2%American Indian alone

-
- 498,12534.6%Asian alone
- 318,57422.1%Two or more races
- 297,93720.7%White alone
- 160,10311.1%Hispanic
- 134,5679.3%Native Hawaiian and Other
Pacific Islander alone - 23,6821.6%Black alone
- 5,3780.4%Other race alone
- 1,8300.1%American Indian alone

Income and house value in Wailea-Makena
- Median household income in 2022
- $105,628White non-Hispanic householders
- $95,688Black householders
- $26,393American Indian and Alaska Native householders
- $107,339Asian householders
- $96,852Native Hawaiian and other Pacific Islander householders
- $21,756Some other race householders
- $98,328Two or more races householders
- $94,552Hispanic or Latino race householders
- Median 2022 house value
- over $1,000,000White Non-Hispanic householders
- over $1,000,000Black or African American householders
- over $1,000,000Asian householders
- $858,236Native Hawaiian and other Pacific Islander householders
- over $1,000,000Two or more races householders
- over $1,000,000Hispanic or Latino householders
Household income for White non-Hispanic householders

Household income for Black householders

Household income for American Indian and Alaska Native householders

Household income for Asian householders

Household income for Native Hawaiian and other Pacific Islander householders

Household income for Two or more races householders

Household income for Hispanic or Latino race householders

Foreign-born residents in Wailea-Makena
710 residents are foreign born (4.0% Asia, 3.7% Europe, 2.2% Latin America, 1.3% North America).
| This city: | 12.5% |
| Hawaii: | 17.5% |
Ancestries in Wailea-Makena

- 1,97428.8%Other
- 1,11616.3%German
- 78111.4%English
- 71410.4%Irish
- 3334.9%Italian
- 2633.8%United States
- 2123.1%French
- 2022.9%Dutch
- 1732.5%Scottish
- 1712.5%Swedish
- 1472.1%Polish
- 1281.9%Norwegian
- 1261.8%Danish
- 1061.5%Scotch-Irish
- 661.0%Russian
- 650.9%Portuguese
- 580.8%Hungarian
- 480.7%Ukrainian
- 350.5%Swiss
- 270.4%French Canadian
- 270.4%Welsh
- 210.3%Arab
- 200.3%Subsaharan African
- 180.3%West Indian
- 140.2%Czech
- 70.1%Greek

Zip codes: 96753.