Races in Waianae, Hawaii (HI) Detailed Stats
Data:
Races - White alone (%)
Races - White alone (% change since 2000)
Races - Black alone (%)
Races - Black alone (% change since 2000)
Races - American Indian alone (%)
Races - American Indian alone (% change since 2000)
Races - Asian alone (%)
Races - Asian alone (% change since 2000)
Races - Hispanic (%)
Races - Hispanic (% change since 2000)
Races - Native Hawaiian and Other Pacific Islander alone (%)
Races - Native Hawaiian and Other Pacific Islander alone (% change since 2000)
Races - Two or more races(%)
Races - Two or more races(% change since 2000)
Races - Other race alone (%)
Races - Other race alone (% change since 2000)
Racial diversity
Place of birth - Born in state of residence (%)
Place of birth - Born in state of residence (%) - White
Place of birth - Born in state of residence (%) - Black or African American
Place of birth - Born in state of residence (%) - Asian
Place of birth - Born in state of residence (%) - Hispanic or Latino
Place of birth - Born in state of residence (%) - American Indian and Alaska Native
Place of birth - Born in state of residence (%) - Multirace
Place of birth - Born in state of residence (%) - Other Race
Place of birth - Born in other state (%)
Place of birth - Born in other state (%) - White
Place of birth - Born in other state (%) - Black or African American
Place of birth - Born in other state (%) - Asian
Place of birth - Born in other state (%) - Hispanic or Latino
Place of birth - Born in other state (%) - American Indian and Alaska Native
Place of birth - Born in other state (%) - Multirace
Place of birth - Born in other state (%) - Other Race
Place of birth - Native, outside of US (%)
Place of birth - Native, outside of US (%) - White
Place of birth - Native, outside of US (%) - Black or African American
Place of birth - Native, outside of US (%) - Asian
Place of birth - Native, outside of US (%) - Hispanic or Latino
Place of birth - Native, outside of US (%) - American Indian and Alaska Native
Place of birth - Native, outside of US (%) - Multirace
Place of birth - Native, outside of US (%) - Other Race
Place of birth - Foreign born (%)
Place of birth - Foreign born (%) - White
Place of birth - Foreign born (%) - Black or African American
Place of birth - Foreign born (%) - Asian
Place of birth - Foreign born (%) - Hispanic or Latino
Place of birth - Foreign born (%) - American Indian and Alaska Native
Place of birth - Foreign born (%) - Multirace
Place of birth - Foreign born (%) - Other Race
Residents speaking English at home (%)
Residents speaking English at home - Born in the United States (%)
Residents speaking English at home - Native, born elsewhere (%)
Residents speaking English at home - Foreign born (%)
Residents speaking Spanish at home (%)
Residents speaking Spanish at home - Born in the United States (%)
Residents speaking Spanish at home - Native, born elsewhere (%)
Residents speaking Spanish at home - Foreign born (%)
Residents speaking other language at home (%)
Residents speaking other language at home - Born in the United States (%)
Residents speaking other language at home - Native, born elsewhere (%)
Residents speaking other language at home - Foreign born (%)
Marital status - Never married (%)
Marital status - Now married (%)
Marital status - Separated (%)
Marital status - Widowed (%)
Marital status - Divorced (%)
Ancestries Reported - Arab (%)
Ancestries Reported - Czech (%)
Ancestries Reported - Danish (%)
Ancestries Reported - Dutch (%)
Ancestries Reported - English (%)
Ancestries Reported - French (%)
Ancestries Reported - French Canadian (%)
Ancestries Reported - German (%)
Ancestries Reported - Greek (%)
Ancestries Reported - Hungarian (%)
Ancestries Reported - Irish (%)
Ancestries Reported - Italian (%)
Ancestries Reported - Lithuanian (%)
Ancestries Reported - Norwegian (%)
Ancestries Reported - Polish (%)
Ancestries Reported - Portuguese (%)
Ancestries Reported - Russian (%)
Ancestries Reported - Scotch-Irish (%)
Ancestries Reported - Scottish (%)
Ancestries Reported - Slovak (%)
Ancestries Reported - Subsaharan African (%)
Ancestries Reported - Swedish (%)
Ancestries Reported - Swiss (%)
Ancestries Reported - Ukrainian (%)
Ancestries Reported - United States (%)
Ancestries Reported - Welsh (%)
Ancestries Reported - West Indian (%)
Ancestries Reported - Other (%)
Geographical mobility - Same house 1 year ago (%)
Geographical mobility - Same house 1 year ago (%) - White
Geographical mobility - Same house 1 year ago (%) - Black or African American
Geographical mobility - Same house 1 year ago (%) - Asian
Geographical mobility - Same house 1 year ago (%) - Hispanic or Latino
Geographical mobility - Same house 1 year ago (%) - American Indian and Alaska Native
Geographical mobility - Same house 1 year ago (%) - Multirace
Geographical mobility - Same house 1 year ago (%) - Other Race
Geographical mobility - Moved within same county (%)
Geographical mobility - Moved within same county (%) - White
Geographical mobility - Moved within same county (%) - Black or African American
Geographical mobility - Moved within same county (%) - Asian
Geographical mobility - Moved within same county (%) - Hispanic or Latino
Geographical mobility - Moved within same county (%) - American Indian and Alaska Native
Geographical mobility - Moved within same county (%) - Multirace
Geographical mobility - Moved within same county (%) - Other Race
Geographical mobility - Moved from different county within same state (%)
Geographical mobility - Moved from different county within same state (%) - White
Geographical mobility - Moved from different county within same state (%) - Black or African American
Geographical mobility - Moved from different county within same state (%) - Asian
Geographical mobility - Moved from different county within same state (%) - Hispanic or Latino
Geographical mobility - Moved from different county within same state (%) - American Indian and Alaska Native
Geographical mobility - Moved from different county within same state (%) - Multirace
Geographical mobility - Moved from different county within same state (%) - Other Race
Geographical mobility - Moved from different state (%)
Geographical mobility - Moved from different state (%) - White
Geographical mobility - Moved from different state (%) - Black or African American
Geographical mobility - Moved from different state (%) - Asian
Geographical mobility - Moved from different state (%) - Hispanic or Latino
Geographical mobility - Moved from different state (%) - American Indian and Alaska Native
Geographical mobility - Moved from different state (%) - Multirace
Geographical mobility - Moved from different state (%) - Other Race
Geographical mobility - Moved from abroad (%)
Geographical mobility - Moved from abroad (%) - White
Geographical mobility - Moved from abroad (%) - Black or African American
Geographical mobility - Moved from abroad (%) - Asian
Geographical mobility - Moved from abroad (%) - Hispanic or Latino
Geographical mobility - Moved from abroad (%) - American Indian and Alaska Native
Geographical mobility - Moved from abroad (%) - Multirace
Geographical mobility - Moved from abroad (%) - Other Race
Place of birth for the foreign-born population - Ireland (%)
Place of birth for the foreign-born population - Denmark (%)
Place of birth for the foreign-born population - Norway (%)
Place of birth for the foreign-born population - Sweden (%)
Place of birth for the foreign-born population - United Kingdom (%)
Place of birth for the foreign-born population - England (%)
Place of birth for the foreign-born population - Scotland (%)
Place of birth for the foreign-born population - Other Northern Europe (%)
Place of birth for the foreign-born population - Austria (%)
Place of birth for the foreign-born population - Belgium (%)
Place of birth for the foreign-born population - France (%)
Place of birth for the foreign-born population - Germany (%)
Place of birth for the foreign-born population - Netherlands (%)
Place of birth for the foreign-born population - Switzerland (%)
Place of birth for the foreign-born population - Other Western Europe (%)
Place of birth for the foreign-born population - Greece (%)
Place of birth for the foreign-born population - Italy (%)
Place of birth for the foreign-born population - Portugal (%)
Place of birth for the foreign-born population - Spain (%)
Place of birth for the foreign-born population - Other Southern Europe (%)
Place of birth for the foreign-born population - Albania (%)
Place of birth for the foreign-born population - Belarus (%)
Place of birth for the foreign-born population - Bosnia and Herzegovina (%)
Place of birth for the foreign-born population - Bulgaria (%)
Place of birth for the foreign-born population - Croatia (%)
Place of birth for the foreign-born population - Czechoslovakia (%)
Place of birth for the foreign-born population - Hungary (%)
Place of birth for the foreign-born population - Latvia (%)
Place of birth for the foreign-born population - Lithuania (%)
Place of birth for the foreign-born population - North Macedonia (Macedonia) (%)
Place of birth for the foreign-born population - Moldova (%)
Place of birth for the foreign-born population - Poland (%)
Place of birth for the foreign-born population - Romania (%)
Place of birth for the foreign-born population - Russia (%)
Place of birth for the foreign-born population - Serbia (%)
Place of birth for the foreign-born population - Ukraine (%)
Place of birth for the foreign-born population - Other Eastern Europe (%)
Place of birth for the foreign-born population - China (%)
Place of birth for the foreign-born population - Hong Kong (%)
Place of birth for the foreign-born population - Taiwan (%)
Place of birth for the foreign-born population - Japan (%)
Place of birth for the foreign-born population - Korea (%)
Place of birth for the foreign-born population - Other Eastern Asia (%)
Place of birth for the foreign-born population - Afghanistan (%)
Place of birth for the foreign-born population - Bangladesh (%)
Place of birth for the foreign-born population - India (%)
Place of birth for the foreign-born population - Iran (%)
Place of birth for the foreign-born population - Kazakhstan (%)
Place of birth for the foreign-born population - Nepal (%)
Place of birth for the foreign-born population - Pakistan (%)
Place of birth for the foreign-born population - Sri Lanka (%)
Place of birth for the foreign-born population - Uzbekistan (%)
Place of birth for the foreign-born population - Other South Central Asia (%)
Place of birth for the foreign-born population - Burma (%)
Place of birth for the foreign-born population - Cambodia (%)
Place of birth for the foreign-born population - Indonesia (%)
Place of birth for the foreign-born population - Laos (%)
Place of birth for the foreign-born population - Malaysia (%)
Place of birth for the foreign-born population - Philippines (%)
Place of birth for the foreign-born population - Singapore (%)
Place of birth for the foreign-born population - Thailand (%)
Place of birth for the foreign-born population - Vietnam (%)
Place of birth for the foreign-born population - Other South Eastern Asia (%)
Place of birth for the foreign-born population - Armenia (%)
Place of birth for the foreign-born population - Iraq (%)
Place of birth for the foreign-born population - Israel (%)
Place of birth for the foreign-born population - Jordan (%)
Place of birth for the foreign-born population - Kuwait (%)
Place of birth for the foreign-born population - Lebanon (%)
Place of birth for the foreign-born population - Saudi Arabia (%)
Place of birth for the foreign-born population - Syria (%)
Place of birth for the foreign-born population - Turkey (%)
Place of birth for the foreign-born population - Yemen (%)
Place of birth for the foreign-born population - Other Western Asia (%)
Place of birth for the foreign-born population - Eritrea (%)
Place of birth for the foreign-born population - Ethiopia (%)
Place of birth for the foreign-born population - Kenya (%)
Place of birth for the foreign-born population - Somalia (%)
Place of birth for the foreign-born population - Uganda (%)
Place of birth for the foreign-born population - Zimbabwe (%)
Place of birth for the foreign-born population - Other Eastern Africa (%)
Place of birth for the foreign-born population - Cameroon (%)
Place of birth for the foreign-born population - Congo (%)
Place of birth for the foreign-born population - Democratic Republic of Congo (Zaire) (%)
Place of birth for the foreign-born population - Other Middle Africa (%)
Place of birth for the foreign-born population - Egypt (%)
Place of birth for the foreign-born population - Morocco (%)
Place of birth for the foreign-born population - Sudan (%)
Place of birth for the foreign-born population - Other Northern Africa (%)
Place of birth for the foreign-born population - South Africa (%)
Place of birth for the foreign-born population - Other Southern Africa (%)
Place of birth for the foreign-born population - Cabo Verde (%)
Place of birth for the foreign-born population - Ghana (%)
Place of birth for the foreign-born population - Liberia (%)
Place of birth for the foreign-born population - Nigeria (%)
Place of birth for the foreign-born population - Senegal (%)
Place of birth for the foreign-born population - Sierra Leone (%)
Place of birth for the foreign-born population - Other Western Africa (%)
Place of birth for the foreign-born population - Australia (%)
Place of birth for the foreign-born population - New Zealand (%)
Place of birth for the foreign-born population - Fiji (%)
Place of birth for the foreign-born population - Micronesia (%)
Place of birth for the foreign-born population - Bahamas (%)
Place of birth for the foreign-born population - Barbados (%)
Place of birth for the foreign-born population - Cuba (%)
Place of birth for the foreign-born population - Dominica (%)
Place of birth for the foreign-born population - Dominican Republic (%)
Place of birth for the foreign-born population - Grenada (%)
Place of birth for the foreign-born population - Haiti (%)
Place of birth for the foreign-born population - Jamaica (%)
Place of birth for the foreign-born population - St. Vincent and the Grenadines (%)
Place of birth for the foreign-born population - Trinidad and Tobago (%)
Place of birth for the foreign-born population - West Indies (%)
Place of birth for the foreign-born population - Other Caribbean (%)
Place of birth for the foreign-born population - Belize (%)
Place of birth for the foreign-born population - Costa Rica (%)
Place of birth for the foreign-born population - El Salvador (%)
Place of birth for the foreign-born population - Guatemala (%)
Place of birth for the foreign-born population - Honduras (%)
Place of birth for the foreign-born population - Mexico (%)
Place of birth for the foreign-born population - Nicaragua (%)
Place of birth for the foreign-born population - Panama (%)
Place of birth for the foreign-born population - Other Central America (%)
Place of birth for the foreign-born population - Argentina (%)
Place of birth for the foreign-born population - Bolivia (%)
Place of birth for the foreign-born population - Brazil (%)
Place of birth for the foreign-born population - Chile (%)
Place of birth for the foreign-born population - Colombia (%)
Place of birth for the foreign-born population - Ecuador (%)
Place of birth for the foreign-born population - Guyana (%)
Place of birth for the foreign-born population - Peru (%)
Place of birth for the foreign-born population - Uruguay (%)
Place of birth for the foreign-born population - Venezuela (%)
Place of birth for the foreign-born population - Other South America (%)
Place of birth for the foreign-born population - Canada (%)
Place of birth for the foreign-born population - Other Northern America (%)
Place of birth for the foreign-born population - Other (%)
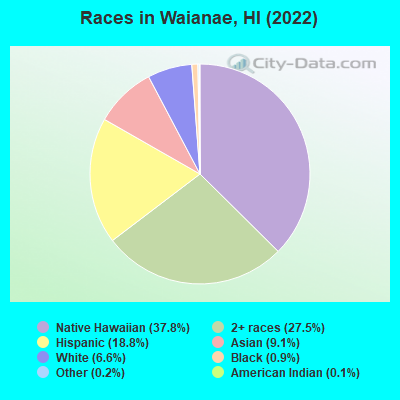
According to 2022 data, the most numerous races in Waianae, HI are Asian alone (1,237 residents), Two or more races (3,729 residents), and White alone (893 residents). 81.8% of Waianae residents speak English at home. 6.6% of Waianae, HI residents are foreign-born (3.3% born in Asia, 2.8% born in Oceania), which is 172.2% less than the foreign-born rate of 18.0% across the entire state of Hawaii.
Race distribution in Waianae
2000 2022
494,149 40.8% Asian alone 277,091 22.9% White alone 218,700 18.1% Two or more races 108,441 9.0% Native Hawaiian and Other 87,699 7.2% Hispanic 20,829 1.7% Black alone 2,089 0.2% Other race alone 2,539 0.2% American Indian alone
498,125 34.6% Asian alone 318,574 22.1% Two or more races 297,937 20.7% White alone 160,103 11.1% Hispanic 134,567 9.3% Native Hawaiian and Other 23,682 1.6% Black alone 5,378 0.4% Other race alone 1,830 0.1% American Indian alone
Income and house value in Waianae Median household income in 2022 $118,932 White non-Hispanic householders$112,468 Black householders$89,628 Asian householders$65,219 Native Hawaiian and other Pacific Islander householders$71,704 Two or more races householders$71,895 Hispanic or Latino race householdersMedian 2022 house value $553,098 White Non-Hispanic householders$203,460 Black or African American householders$380,627 American Indian or Alaska Native householders $557,481 Asian householders$394,399 Native Hawaiian and other Pacific Islander householders$304,251 Some other race householders$503,642 Two or more races householders$497,695 Hispanic or Latino householders
Median age by race in Waianae
56.1 Median age for White residents48.1 63.1 46.7 Median age for Black or African American residents47.6 36.6 -693,430,656.2 Median age for American Indian / Alaska Native residents-715,953,306.7 -629,508,196.1 52.9 Median age for Asian residents57.6 44.6 33.6 Median age for Native Hawaiian / Pacific Islander residents33.5 33.8 41.7 Median age for Other race residents58.6 38.1 26.7 Median age for Two or more races residents24.2 30.8 59.6 Median age for White alone residents49.2 63.8 25.2 Median age for Hispanic or Latino residents27.2 22.3
Owner/renter occupied households by race in Waianae
House owners and renters - White residents 346 69.1% Owner occupied155 30.9% Renter occupiedHouse owners and renters - Black or African American residents 74 100.0% Owner occupiedHouse owners and renters - Asian residents 329 92.9% Owner occupied25 7.1% Renter occupiedHouse owners and renters - Native Hawaiian / Pacific Islander residents 721 52.2% Owner occupied660 47.8% Renter occupiedHouse owners and renters - Other race residents 15 62.6% Owner occupied9 37.4% Renter occupiedHouse owners and renters - Two or more races residents 869 66.1% Owner occupied446 33.9% Renter occupiedHouse owners and renters - White alone residents 296 74.5% Owner occupied101 25.5% Renter occupiedHouse owners and renters - Hispanic or Latino residents 309 61.5% Owner occupied193 38.5% Renter occupied
Language usage in Waianae
English speakers - Total 81.8% of residents of Waianae speak English at home.
0.8% of residents speak Spanish at home 99 95.2% Speak English very well5 4.8% Speak English less than very well17.7% of residents speak other language at home 1,615 72.7% Speak English very well607 27.3% Speak English less than very well
English speakers - Born in the United States 92.2% of residents of Waianae speak English at home.
2.3% of residents speak Spanish at home 25 92.6% Speak English very well2 7.4% Speak English less than very well4.8% of residents speak other language at home 44 77.2% Speak English very well13 22.8% Speak English less than very well
English speakers - Native, born elsewhere 63.9% of residents of Waianae speak English at home.
28.3% of residents speak Spanish at home 51 100.0% Speak English very well8.9% of residents speak other language at home 10 62.5% Speak English very well6 37.5% Speak English less than very well
English speakers - Foreign-born 12.9% of residents of Waianae speak English at home.
86.7% of residents speak other language at home 372 51.0% Speak English very well358 49.0% Speak English less than very well
White (Caucasian) - Speak only English Native:
98.1% (1,049)Foreign-born:
32.9% (12)
White (Caucasian) - Speak another language Native:
2.6% (28)Foreign-born:
64.0% (23)
Asian - Speak only English Native:
71.6% (630)Foreign-born:
7.4% (30)
Asian - Speak another language Native:
27.4% (241)Foreign-born:
92.7% (379)
Native Hawaiian / Pacific Islander - Speak only English Native:
81.2% (3,919)Foreign-born:
4.3% (15)
Native Hawaiian / Pacific Islander - Speak another language Native:
18.8% (907)Foreign-born:
96.1% (346)
Two or more races - Speak only English Native:
92.9% (4,475)Foreign-born:
100.0% (56)
White alone - Speak only English Native:
96.5% (830)Foreign-born:
100.0% (12)
Hispanic or Latino - Speak only English Native:
91.5% (2,058)Foreign-born:
34.7% (12)
Hispanic or Latino - Speak another language Native:
8.9% (200)Foreign-born:
68.3% (23)
Foreign-born residents in Waianae 896 residents are foreign born (3.3% Asia , 2.8% Oceania ).
This city:
6.6%Hawaii:
18.0%
Marital status for residents in Waianae Marital status - White (Caucasian) population 15 years and over
Males 16.8% Never married69.7% Now married0.0% Separated1.8% Widowed11.7% DivorcedFemales 22.0% Never married56.9% Now married0.4% Separated3.7% Widowed17.0% DivorcedWomen who gave birth in the past 12 months Now married:
44.4% (4)Unmarried:
55.6% (5)
Women who did not give birth in the past 12 months Now married:
34.8% (52)Unmarried:
65.2% (98)
Marital status - Black or African American population 15 years and over
Males 4.6% Never married76.9% Now married0.0% Separated0.0% Widowed18.5% DivorcedFemales 0.0% Never married100.0% Now married0.0% Separated0.0% Widowed0.0% DivorcedWomen who did not give birth in the past 12 months Now married:
100.0% (8)Unmarried:
0.0% (0)
Marital status - Asian population 15 years and over
Males 21.8% Never married61.4% Now married1.0% Separated8.7% Widowed7.1% DivorcedFemales 20.4% Never married64.3% Now married0.0% Separated8.3% Widowed7.1% DivorcedWomen who gave birth in the past 12 months Now married:
100.0% (10)Unmarried:
0.0% (0)
Women who did not give birth in the past 12 months Now married:
57.1% (177)Unmarried:
42.9% (133)
Marital status - Native Hawaiian / Pacific Islander population 15 years and over
Males 33.5% Never married51.9% Now married2.8% Separated2.7% Widowed9.1% DivorcedFemales 36.7% Never married47.6% Now married1.0% Separated7.3% Widowed7.4% DivorcedWomen who gave birth in the past 12 months Now married:
75.0% (58)Unmarried:
25.0% (19)
Women who did not give birth in the past 12 months Now married:
41.6% (410)Unmarried:
58.4% (576)
Marital status - Other race population 15 years and over
Males 2.9% Never married70.6% Now married0.0% Separated0.0% Widowed26.5% DivorcedFemales 0.0% Never married93.8% Now married0.0% Separated6.3% Widowed0.0% DivorcedWomen who did not give birth in the past 12 months Now married:
100.0% (40)Unmarried:
0.0% (0)
Marital status - Two or more races population 15 years and over
Males 43.4% Never married42.4% Now married3.1% Separated1.6% Widowed9.4% DivorcedFemales 46.2% Never married42.3% Now married1.0% Separated6.0% Widowed4.6% DivorcedWomen who gave birth in the past 12 months Now married:
37.2% (31)Unmarried:
62.8% (52)
Women who did not give birth in the past 12 months Now married:
36.3% (422)Unmarried:
63.7% (740)
Marital status - White alone, not Hispanic / Latino population 15 years and over
Males 23.6% Never married70.9% Now married0.0% Separated2.5% Widowed3.0% DivorcedFemales 19.6% Never married55.1% Now married0.4% Separated4.4% Widowed20.4% DivorcedWomen who gave birth in the past 12 months Now married:
44.4% (4)Unmarried:
55.6% (5)
Women who did not give birth in the past 12 months Now married:
33.9% (37)Unmarried:
66.1% (71)
Marital status - Hispanic or Latino population 15 years and over
Males 38.8% Never married51.5% Now married1.4% Separated0.4% Widowed7.8% DivorcedFemales 47.5% Never married48.7% Now married0.0% Separated1.8% Widowed2.0% DivorcedWomen who gave birth in the past 12 months Now married:
100.0% (6)Unmarried:
0.0% (0)
Women who did not give birth in the past 12 months Now married:
32.3% (165)Unmarried:
67.7% (347)
Ancestries in Waianae
84 1.6% Portuguese29 0.6% English28 0.5% Norwegian25 0.5% American25 0.5% Irish15 0.3% German14 0.3% Italian6 0.1% Canadian4 0.08% Polish3 0.06% European3 0.06% Haitian1 0.02% Ukrainian
Children Nativity (place of birth) in Waianae
Children under 6 years - Living with two parents Both parents native 441 100.0% NativeBoth parents foreign-born 29 100.0% NativeOne native, one foreign-born parent 32 100.0% NativeChildren under 6 years - Living with one parent Native parent 576 100.0% NativeForeign-born parent 78 100.0% NativeChildren 6 to 17 years - Living with two parents Both parents native 1,296 100.0% NativeBoth parents foreign-born 199 86.9% Native30 13.1% Foreign-bornOne native, one foreign-born parent 47 100.0% NativeChildren 6 to 17 years - Living with one parent Native parent 983 100.0% NativeForeign-born parent 254 45.6% Native303 54.4% Foreign-born
Grandparents responsible for own grandchildren in Waianae
Grandparents (30 to 59 years) White / Caucasian 7 14.5% Responsible for grandchildren40 85.5% Not responsible for grandchildrenBlack or African American 3 100.0% Responsible for grandchildrenAsian 18 100.0% Not responsible for grandchildrenNative Hawaiian / Pacific Islander 22 12.4% Responsible for grandchildren155 87.6% Not responsible for grandchildrenOther race 11 100.0% Not responsible for grandchildrenTwo or more races 14 32.9% Responsible for grandchildren28 67.1% Not responsible for grandchildrenWhite alone, not Hispanic / Latino 5 9.8% Responsible for grandchildren44 90.2% Not responsible for grandchildrenHispanic or Latino 19 100.0% Not responsible for grandchildrenGrandparents (60 years and over) White / Caucasian 8 39.5% Responsible for grandchildren12 60.5% Not responsible for grandchildrenAsian 6 29.1% Responsible for grandchildren15 70.9% Not responsible for grandchildrenNative Hawaiian / Pacific Islander 94 34.1% Responsible for grandchildren182 65.9% Not responsible for grandchildrenTwo or more races 27 23.4% Responsible for grandchildren89 76.6% Not responsible for grandchildrenWhite alone, not Hispanic / Latino 8 40.3% Responsible for grandchildren12 59.7% Not responsible for grandchildrenHispanic or Latino 3 11.9% Responsible for grandchildren21 88.1% Not responsible for grandchildren