Races in Wahiawa, Hawaii (HI) Detailed Stats
Data:
Races - White alone (%)
Races - White alone (% change since 2000)
Races - Black alone (%)
Races - Black alone (% change since 2000)
Races - American Indian alone (%)
Races - American Indian alone (% change since 2000)
Races - Asian alone (%)
Races - Asian alone (% change since 2000)
Races - Hispanic (%)
Races - Hispanic (% change since 2000)
Races - Native Hawaiian and Other Pacific Islander alone (%)
Races - Native Hawaiian and Other Pacific Islander alone (% change since 2000)
Races - Two or more races(%)
Races - Two or more races(% change since 2000)
Races - Other race alone (%)
Races - Other race alone (% change since 2000)
Racial diversity
Place of birth - Born in state of residence (%)
Place of birth - Born in state of residence (%) - White
Place of birth - Born in state of residence (%) - Black or African American
Place of birth - Born in state of residence (%) - Asian
Place of birth - Born in state of residence (%) - Hispanic or Latino
Place of birth - Born in state of residence (%) - American Indian and Alaska Native
Place of birth - Born in state of residence (%) - Multirace
Place of birth - Born in state of residence (%) - Other Race
Place of birth - Born in other state (%)
Place of birth - Born in other state (%) - White
Place of birth - Born in other state (%) - Black or African American
Place of birth - Born in other state (%) - Asian
Place of birth - Born in other state (%) - Hispanic or Latino
Place of birth - Born in other state (%) - American Indian and Alaska Native
Place of birth - Born in other state (%) - Multirace
Place of birth - Born in other state (%) - Other Race
Place of birth - Native, outside of US (%)
Place of birth - Native, outside of US (%) - White
Place of birth - Native, outside of US (%) - Black or African American
Place of birth - Native, outside of US (%) - Asian
Place of birth - Native, outside of US (%) - Hispanic or Latino
Place of birth - Native, outside of US (%) - American Indian and Alaska Native
Place of birth - Native, outside of US (%) - Multirace
Place of birth - Native, outside of US (%) - Other Race
Place of birth - Foreign born (%)
Place of birth - Foreign born (%) - White
Place of birth - Foreign born (%) - Black or African American
Place of birth - Foreign born (%) - Asian
Place of birth - Foreign born (%) - Hispanic or Latino
Place of birth - Foreign born (%) - American Indian and Alaska Native
Place of birth - Foreign born (%) - Multirace
Place of birth - Foreign born (%) - Other Race
Residents speaking English at home (%)
Residents speaking English at home - Born in the United States (%)
Residents speaking English at home - Native, born elsewhere (%)
Residents speaking English at home - Foreign born (%)
Residents speaking Spanish at home (%)
Residents speaking Spanish at home - Born in the United States (%)
Residents speaking Spanish at home - Native, born elsewhere (%)
Residents speaking Spanish at home - Foreign born (%)
Residents speaking other language at home (%)
Residents speaking other language at home - Born in the United States (%)
Residents speaking other language at home - Native, born elsewhere (%)
Residents speaking other language at home - Foreign born (%)
Marital status - Never married (%)
Marital status - Now married (%)
Marital status - Separated (%)
Marital status - Widowed (%)
Marital status - Divorced (%)
Ancestries Reported - Arab (%)
Ancestries Reported - Czech (%)
Ancestries Reported - Danish (%)
Ancestries Reported - Dutch (%)
Ancestries Reported - English (%)
Ancestries Reported - French (%)
Ancestries Reported - French Canadian (%)
Ancestries Reported - German (%)
Ancestries Reported - Greek (%)
Ancestries Reported - Hungarian (%)
Ancestries Reported - Irish (%)
Ancestries Reported - Italian (%)
Ancestries Reported - Lithuanian (%)
Ancestries Reported - Norwegian (%)
Ancestries Reported - Polish (%)
Ancestries Reported - Portuguese (%)
Ancestries Reported - Russian (%)
Ancestries Reported - Scotch-Irish (%)
Ancestries Reported - Scottish (%)
Ancestries Reported - Slovak (%)
Ancestries Reported - Subsaharan African (%)
Ancestries Reported - Swedish (%)
Ancestries Reported - Swiss (%)
Ancestries Reported - Ukrainian (%)
Ancestries Reported - United States (%)
Ancestries Reported - Welsh (%)
Ancestries Reported - West Indian (%)
Ancestries Reported - Other (%)
Geographical mobility - Same house 1 year ago (%)
Geographical mobility - Same house 1 year ago (%) - White
Geographical mobility - Same house 1 year ago (%) - Black or African American
Geographical mobility - Same house 1 year ago (%) - Asian
Geographical mobility - Same house 1 year ago (%) - Hispanic or Latino
Geographical mobility - Same house 1 year ago (%) - American Indian and Alaska Native
Geographical mobility - Same house 1 year ago (%) - Multirace
Geographical mobility - Same house 1 year ago (%) - Other Race
Geographical mobility - Moved within same county (%)
Geographical mobility - Moved within same county (%) - White
Geographical mobility - Moved within same county (%) - Black or African American
Geographical mobility - Moved within same county (%) - Asian
Geographical mobility - Moved within same county (%) - Hispanic or Latino
Geographical mobility - Moved within same county (%) - American Indian and Alaska Native
Geographical mobility - Moved within same county (%) - Multirace
Geographical mobility - Moved within same county (%) - Other Race
Geographical mobility - Moved from different county within same state (%)
Geographical mobility - Moved from different county within same state (%) - White
Geographical mobility - Moved from different county within same state (%) - Black or African American
Geographical mobility - Moved from different county within same state (%) - Asian
Geographical mobility - Moved from different county within same state (%) - Hispanic or Latino
Geographical mobility - Moved from different county within same state (%) - American Indian and Alaska Native
Geographical mobility - Moved from different county within same state (%) - Multirace
Geographical mobility - Moved from different county within same state (%) - Other Race
Geographical mobility - Moved from different state (%)
Geographical mobility - Moved from different state (%) - White
Geographical mobility - Moved from different state (%) - Black or African American
Geographical mobility - Moved from different state (%) - Asian
Geographical mobility - Moved from different state (%) - Hispanic or Latino
Geographical mobility - Moved from different state (%) - American Indian and Alaska Native
Geographical mobility - Moved from different state (%) - Multirace
Geographical mobility - Moved from different state (%) - Other Race
Geographical mobility - Moved from abroad (%)
Geographical mobility - Moved from abroad (%) - White
Geographical mobility - Moved from abroad (%) - Black or African American
Geographical mobility - Moved from abroad (%) - Asian
Geographical mobility - Moved from abroad (%) - Hispanic or Latino
Geographical mobility - Moved from abroad (%) - American Indian and Alaska Native
Geographical mobility - Moved from abroad (%) - Multirace
Geographical mobility - Moved from abroad (%) - Other Race
Place of birth for the foreign-born population - Ireland (%)
Place of birth for the foreign-born population - Denmark (%)
Place of birth for the foreign-born population - Norway (%)
Place of birth for the foreign-born population - Sweden (%)
Place of birth for the foreign-born population - United Kingdom (%)
Place of birth for the foreign-born population - England (%)
Place of birth for the foreign-born population - Scotland (%)
Place of birth for the foreign-born population - Other Northern Europe (%)
Place of birth for the foreign-born population - Austria (%)
Place of birth for the foreign-born population - Belgium (%)
Place of birth for the foreign-born population - France (%)
Place of birth for the foreign-born population - Germany (%)
Place of birth for the foreign-born population - Netherlands (%)
Place of birth for the foreign-born population - Switzerland (%)
Place of birth for the foreign-born population - Other Western Europe (%)
Place of birth for the foreign-born population - Greece (%)
Place of birth for the foreign-born population - Italy (%)
Place of birth for the foreign-born population - Portugal (%)
Place of birth for the foreign-born population - Spain (%)
Place of birth for the foreign-born population - Other Southern Europe (%)
Place of birth for the foreign-born population - Albania (%)
Place of birth for the foreign-born population - Belarus (%)
Place of birth for the foreign-born population - Bosnia and Herzegovina (%)
Place of birth for the foreign-born population - Bulgaria (%)
Place of birth for the foreign-born population - Croatia (%)
Place of birth for the foreign-born population - Czechoslovakia (%)
Place of birth for the foreign-born population - Hungary (%)
Place of birth for the foreign-born population - Latvia (%)
Place of birth for the foreign-born population - Lithuania (%)
Place of birth for the foreign-born population - North Macedonia (Macedonia) (%)
Place of birth for the foreign-born population - Moldova (%)
Place of birth for the foreign-born population - Poland (%)
Place of birth for the foreign-born population - Romania (%)
Place of birth for the foreign-born population - Russia (%)
Place of birth for the foreign-born population - Serbia (%)
Place of birth for the foreign-born population - Ukraine (%)
Place of birth for the foreign-born population - Other Eastern Europe (%)
Place of birth for the foreign-born population - China (%)
Place of birth for the foreign-born population - Hong Kong (%)
Place of birth for the foreign-born population - Taiwan (%)
Place of birth for the foreign-born population - Japan (%)
Place of birth for the foreign-born population - Korea (%)
Place of birth for the foreign-born population - Other Eastern Asia (%)
Place of birth for the foreign-born population - Afghanistan (%)
Place of birth for the foreign-born population - Bangladesh (%)
Place of birth for the foreign-born population - India (%)
Place of birth for the foreign-born population - Iran (%)
Place of birth for the foreign-born population - Kazakhstan (%)
Place of birth for the foreign-born population - Nepal (%)
Place of birth for the foreign-born population - Pakistan (%)
Place of birth for the foreign-born population - Sri Lanka (%)
Place of birth for the foreign-born population - Uzbekistan (%)
Place of birth for the foreign-born population - Other South Central Asia (%)
Place of birth for the foreign-born population - Burma (%)
Place of birth for the foreign-born population - Cambodia (%)
Place of birth for the foreign-born population - Indonesia (%)
Place of birth for the foreign-born population - Laos (%)
Place of birth for the foreign-born population - Malaysia (%)
Place of birth for the foreign-born population - Philippines (%)
Place of birth for the foreign-born population - Singapore (%)
Place of birth for the foreign-born population - Thailand (%)
Place of birth for the foreign-born population - Vietnam (%)
Place of birth for the foreign-born population - Other South Eastern Asia (%)
Place of birth for the foreign-born population - Armenia (%)
Place of birth for the foreign-born population - Iraq (%)
Place of birth for the foreign-born population - Israel (%)
Place of birth for the foreign-born population - Jordan (%)
Place of birth for the foreign-born population - Kuwait (%)
Place of birth for the foreign-born population - Lebanon (%)
Place of birth for the foreign-born population - Saudi Arabia (%)
Place of birth for the foreign-born population - Syria (%)
Place of birth for the foreign-born population - Turkey (%)
Place of birth for the foreign-born population - Yemen (%)
Place of birth for the foreign-born population - Other Western Asia (%)
Place of birth for the foreign-born population - Eritrea (%)
Place of birth for the foreign-born population - Ethiopia (%)
Place of birth for the foreign-born population - Kenya (%)
Place of birth for the foreign-born population - Somalia (%)
Place of birth for the foreign-born population - Uganda (%)
Place of birth for the foreign-born population - Zimbabwe (%)
Place of birth for the foreign-born population - Other Eastern Africa (%)
Place of birth for the foreign-born population - Cameroon (%)
Place of birth for the foreign-born population - Congo (%)
Place of birth for the foreign-born population - Democratic Republic of Congo (Zaire) (%)
Place of birth for the foreign-born population - Other Middle Africa (%)
Place of birth for the foreign-born population - Egypt (%)
Place of birth for the foreign-born population - Morocco (%)
Place of birth for the foreign-born population - Sudan (%)
Place of birth for the foreign-born population - Other Northern Africa (%)
Place of birth for the foreign-born population - South Africa (%)
Place of birth for the foreign-born population - Other Southern Africa (%)
Place of birth for the foreign-born population - Cabo Verde (%)
Place of birth for the foreign-born population - Ghana (%)
Place of birth for the foreign-born population - Liberia (%)
Place of birth for the foreign-born population - Nigeria (%)
Place of birth for the foreign-born population - Senegal (%)
Place of birth for the foreign-born population - Sierra Leone (%)
Place of birth for the foreign-born population - Other Western Africa (%)
Place of birth for the foreign-born population - Australia (%)
Place of birth for the foreign-born population - New Zealand (%)
Place of birth for the foreign-born population - Fiji (%)
Place of birth for the foreign-born population - Micronesia (%)
Place of birth for the foreign-born population - Bahamas (%)
Place of birth for the foreign-born population - Barbados (%)
Place of birth for the foreign-born population - Cuba (%)
Place of birth for the foreign-born population - Dominica (%)
Place of birth for the foreign-born population - Dominican Republic (%)
Place of birth for the foreign-born population - Grenada (%)
Place of birth for the foreign-born population - Haiti (%)
Place of birth for the foreign-born population - Jamaica (%)
Place of birth for the foreign-born population - St. Vincent and the Grenadines (%)
Place of birth for the foreign-born population - Trinidad and Tobago (%)
Place of birth for the foreign-born population - West Indies (%)
Place of birth for the foreign-born population - Other Caribbean (%)
Place of birth for the foreign-born population - Belize (%)
Place of birth for the foreign-born population - Costa Rica (%)
Place of birth for the foreign-born population - El Salvador (%)
Place of birth for the foreign-born population - Guatemala (%)
Place of birth for the foreign-born population - Honduras (%)
Place of birth for the foreign-born population - Mexico (%)
Place of birth for the foreign-born population - Nicaragua (%)
Place of birth for the foreign-born population - Panama (%)
Place of birth for the foreign-born population - Other Central America (%)
Place of birth for the foreign-born population - Argentina (%)
Place of birth for the foreign-born population - Bolivia (%)
Place of birth for the foreign-born population - Brazil (%)
Place of birth for the foreign-born population - Chile (%)
Place of birth for the foreign-born population - Colombia (%)
Place of birth for the foreign-born population - Ecuador (%)
Place of birth for the foreign-born population - Guyana (%)
Place of birth for the foreign-born population - Peru (%)
Place of birth for the foreign-born population - Uruguay (%)
Place of birth for the foreign-born population - Venezuela (%)
Place of birth for the foreign-born population - Other South America (%)
Place of birth for the foreign-born population - Canada (%)
Place of birth for the foreign-born population - Other Northern America (%)
Place of birth for the foreign-born population - Other (%)
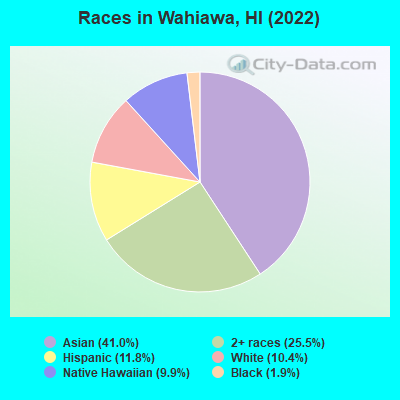
According to 2022 data, the most numerous races in Wahiawa, HI are Asian alone (7,034 residents), Two or more races (4,377 residents), and White alone (1,782 residents). 71.6% of Wahiawa residents speak English at home. 20.2% of Wahiawa, HI residents are foreign-born (15.0% born in Asia, 3.2% born in Oceania), which is 10.9% greater than the foreign-born rate of 18.0% across the entire state of Hawaii.
Race distribution in Wahiawa
2000 2022
7,197 44.6% Asian alone 3,714 23.0% Two or more races 1,777 11.0% Hispanic 1,640 10.2% White alone 1,445 8.9% Native Hawaiian and Other 306 1.9% Black alone 42 0.3% Other race alone 30 0.2% American Indian alone
7,034 41.0% Asian alone 4,377 25.5% Two or more races 2,031 11.8% Hispanic 1,782 10.4% White alone 1,704 9.9% Native Hawaiian and Other 318 1.9% Black alone 12 0.07% Other race alone
2000 2022
494,149 40.8% Asian alone 277,091 22.9% White alone 218,700 18.1% Two or more races 108,441 9.0% Native Hawaiian and Other 87,699 7.2% Hispanic 20,829 1.7% Black alone 2,089 0.2% Other race alone 2,539 0.2% American Indian alone
498,125 34.6% Asian alone 318,574 22.1% Two or more races 297,937 20.7% White alone 160,103 11.1% Hispanic 134,567 9.3% Native Hawaiian and Other 23,682 1.6% Black alone 5,378 0.4% Other race alone 1,830 0.1% American Indian alone
Income and house value in Wahiawa Median household income in 2022 $74,956 White non-Hispanic householders$47,627 Black householders$92,963 Asian householders$41,651 Native Hawaiian and other Pacific Islander householders$81,510 Two or more races householders$116,790 Hispanic or Latino race householdersMedian 2022 house value $672,281 White Non-Hispanic householdersover $1,000,000 Black or African American householders$540,534 American Indian or Alaska Native householders $708,028 Asian householders$632,497 Native Hawaiian and other Pacific Islander householders$949,034 Some other race householders$678,335 Two or more races householders$872,062 Hispanic or Latino householders
Median age by race in Wahiawa
52.4 Median age for White residents54.7 40.8 55.3 Median age for Black or African American residents60.6 32.4 -693,430,656.2 Median age for American Indian / Alaska Native residents-715,953,306.7 -629,508,196.1 54.5 Median age for Asian residents49.8 56.1 31.8 Median age for Native Hawaiian / Pacific Islander residents30.4 34.9 58.1 Median age for Other race residents34.7 58.3 32.4 Median age for Two or more races residents28.0 34.3 55.2 Median age for White alone residents57.6 40.7 35.8 Median age for Hispanic or Latino residents24.6 46.2
Owner/renter occupied households by race in Wahiawa
House owners and renters - White residents 504 45.8% Owner occupied596 54.2% Renter occupiedHouse owners and renters - Black or African American residents 49 21.7% Owner occupied176 78.3% Renter occupiedHouse owners and renters - Asian residents 1,665 69.2% Owner occupied740 30.8% Renter occupiedHouse owners and renters - Native Hawaiian / Pacific Islander residents 124 20.3% Owner occupied485 79.7% Renter occupiedHouse owners and renters - Other race residents 22 100.0% Renter occupiedHouse owners and renters - Two or more races residents 843 47.3% Owner occupied938 52.7% Renter occupiedHouse owners and renters - White alone residents 504 48.4% Owner occupied538 51.6% Renter occupiedHouse owners and renters - Hispanic or Latino residents 253 41.4% Owner occupied357 58.6% Renter occupied
Language usage in Wahiawa
English speakers - Total 71.6% of residents of Wahiawa speak English at home.
0.7% of residents speak Spanish at home 88 74.6% Speak English very well30 25.4% Speak English less than very well27.4% of residents speak other language at home 2,863 64.2% Speak English very well1,597 35.8% Speak English less than very well
English speakers - Born in the United States 88.5% of residents of Wahiawa speak English at home.
1.6% of residents speak Spanish at home 24 57.1% Speak English very well18 42.9% Speak English less than very well9.8% of residents speak other language at home 259 100.0% Speak English very well
English speakers - Native, born elsewhere 70.3% of residents of Wahiawa speak English at home.
29.7% of residents speak other language at home 65 100.0% Speak English very well
English speakers - Foreign-born 18.4% of residents of Wahiawa speak English at home.
1.9% of residents speak Spanish at home 45 75.0% Speak English very well15 25.0% Speak English less than very well79.6% of residents speak other language at home 1,024 39.8% Speak English very well1,548 60.2% Speak English less than very well
White (Caucasian) - Speak only English Native:
93.2% (1,654)Foreign-born:
97.8% (118)
White (Caucasian) - Speak another language Native:
6.5% (115)Foreign-born:
8.5% (10)
Black or African American - Speak only English Native:
100.0% (255)Foreign-born:
85.0% (33)
Asian - Speak only English Native:
92.8% (4,111)Foreign-born:
16.4% (400)
Asian - Speak another language Native:
7.6% (337)Foreign-born:
83.6% (2,036)
Native Hawaiian / Pacific Islander - Speak another language Native:
51.9% (627)Foreign-born:
100.0% (483)
Two or more races - Speak only English Native:
82.7% (4,472)Foreign-born:
29.3% (31)
Two or more races - Speak another language Native:
17.5% (944)Foreign-born:
70.7% (76)
White alone - Speak only English Native:
94.4% (1,551)Foreign-born:
100.0% (119)
Hispanic or Latino - Speak another language Native:
23.0% (422)Foreign-born:
95.6% (80)
Foreign-born residents in Wahiawa 3,466 residents are foreign born (15.0% Asia , 3.2% Oceania ).
This city:
20.2%Hawaii:
18.0%
Marital status for residents in Wahiawa Marital status - White (Caucasian) population 15 years and over
Males 22.1% Never married67.6% Now married0.2% Separated0.0% Widowed10.0% DivorcedFemales 33.1% Never married50.1% Now married4.6% Separated3.6% Widowed8.7% DivorcedWomen who gave birth in the past 12 months Now married:
100.0% (7)Unmarried:
0.0% (0)
Women who did not give birth in the past 12 months Now married:
52.6% (215)Unmarried:
47.4% (194)
Marital status - Black or African American population 15 years and over
Males 30.1% Never married55.3% Now married0.0% Separated3.7% Widowed11.0% DivorcedFemales 52.2% Never married6.1% Now married0.0% Separated0.0% Widowed41.7% DivorcedWomen who did not give birth in the past 12 months Now married:
9.3% (7)Unmarried:
90.7% (65)
Marital status - Asian population 15 years and over
Males 31.5% Never married56.8% Now married0.2% Separated6.0% Widowed5.5% DivorcedFemales 27.3% Never married46.3% Now married2.3% Separated12.1% Widowed11.9% DivorcedWomen who gave birth in the past 12 months Now married:
87.9% (48)Unmarried:
12.1% (7)
Women who did not give birth in the past 12 months Now married:
49.0% (671)Unmarried:
51.0% (698)
Marital status - Native Hawaiian / Pacific Islander population 15 years and over
Males 41.2% Never married27.3% Now married8.4% Separated7.9% Widowed15.3% DivorcedFemales 67.9% Never married15.7% Now married0.0% Separated9.2% Widowed7.1% DivorcedWomen who gave birth in the past 12 months Now married:
100.0% (7)Unmarried:
0.0% (0)
Women who did not give birth in the past 12 months Now married:
15.4% (73)Unmarried:
84.6% (401)
Marital status - Other race population 15 years and over
Males 31.9% Never married53.6% Now married0.0% Separated0.0% Widowed14.5% DivorcedFemales 0.0% Never married78.0% Now married0.0% Separated15.4% Widowed6.5% DivorcedMarital status - Two or more races population 15 years and over
Males 56.0% Never married33.9% Now married0.0% Separated1.1% Widowed9.0% DivorcedFemales 41.1% Never married38.2% Now married7.5% Separated4.2% Widowed9.0% DivorcedWomen who gave birth in the past 12 months Now married:
47.5% (31)Unmarried:
52.5% (34)
Women who did not give birth in the past 12 months Now married:
34.9% (442)Unmarried:
65.1% (825)
Marital status - White alone, not Hispanic / Latino population 15 years and over
Males 16.4% Never married72.4% Now married0.3% Separated0.0% Widowed11.0% DivorcedFemales 35.2% Never married49.6% Now married4.8% Separated3.8% Widowed6.6% DivorcedWomen who gave birth in the past 12 months Now married:
100.0% (7)Unmarried:
0.0% (0)
Women who did not give birth in the past 12 months Now married:
51.0% (197)Unmarried:
49.0% (190)
Marital status - Hispanic or Latino population 15 years and over
Males 66.0% Never married23.6% Now married0.0% Separated0.0% Widowed10.3% DivorcedFemales 20.5% Never married46.9% Now married15.9% Separated2.4% Widowed14.2% DivorcedWomen who gave birth in the past 12 months Now married:
100.0% (7)Unmarried:
0.0% (0)
Women who did not give birth in the past 12 months Now married:
50.3% (181)Unmarried:
49.7% (179)
Ancestries in Wahiawa
128 1.5% English100 1.2% Dutch46 0.6% Canadian37 0.4% Greek36 0.4% Haitian32 0.4% Italian29 0.3% European25 0.3% Polish22 0.3% Irish21 0.3% Norwegian14 0.2% German11 0.1% French7 0.08% American6 0.07% British5 0.06% Portuguese
Geographical mobility in Wahiawa Same house 1 year ago 1,725 89.1% White (Caucasian)252 75.6% Black or African American6,789 95.6% Asian1,636 91.7% Native Hawaiian / Pacific Islander213 99.4% Other race5,228 88.2% Two or more races1,602 89.8% White alone, not Hispanic / Latino1,854 91.3% Hispanic or LatinoMoved within same county 89 4.6% White / Caucasian66 19.7% Black or African American223 3.1% Asian133 7.5% Native Hawaiian / Pacific Islander5 2.4% Other race567 9.6% Two or more races57 3.2% White alone, not Hispanic / Latino165 8.1% Hispanic or LatinoMoved within same state 28 0.4% Asian10 0.6% Native Hawaiian / Pacific IslanderMoved from different state 111 5.7% White / Caucasian17 0.2% Asian7 3.1% Other race83 1.4% Two or more races113 6.4% White alone, not Hispanic / Latino8 0.4% Hispanic or LatinoMoved from abroad 17 0.9% White31 0.4% Asian1 0.1% Native Hawaiian / Pacific Islander18 1.0% White alone, not Hispanic / Latino
Children Nativity (place of birth) in Wahiawa
Children under 6 years - Living with two parents Both parents native 348 100.0% NativeBoth parents foreign-born 179 100.0% NativeOne native, one foreign-born parent 44 100.0% NativeChildren under 6 years - Living with one parent Native parent 318 100.0% NativeForeign-born parent 27 85.2% Native5 14.8% Foreign-bornChildren 6 to 17 years - Living with two parents Both parents native 671 99.5% Native3 0.5% Foreign-bornBoth parents foreign-born 243 71.8% Native96 28.2% Foreign-bornOne native, one foreign-born parent 243 100.0% NativeChildren 6 to 17 years - Living with one parent Native parent 592 100.0% NativeForeign-born parent 346 58.9% Native241 41.1% Foreign-born
Grandparents responsible for own grandchildren in Wahiawa
Grandparents (30 to 59 years) Asian 8 16.1% Responsible for grandchildren42 83.9% Not responsible for grandchildrenNative Hawaiian / Pacific Islander 21 100.0% Not responsible for grandchildrenTwo or more races 13 100.0% Responsible for grandchildrenGrandparents (60 years and over) Asian 50 13.7% Responsible for grandchildren314 86.3% Not responsible for grandchildrenNative Hawaiian / Pacific Islander 21 100.0% Not responsible for grandchildrenTwo or more races 91 100.0% Responsible for grandchildren