Races in Viera West, Florida (FL) Detailed Stats
Data:
Races - White alone (%)
Races - White alone (% change since 2000)
Races - Black alone (%)
Races - Black alone (% change since 2000)
Races - American Indian alone (%)
Races - American Indian alone (% change since 2000)
Races - Asian alone (%)
Races - Asian alone (% change since 2000)
Races - Hispanic (%)
Races - Hispanic (% change since 2000)
Races - Native Hawaiian and Other Pacific Islander alone (%)
Races - Native Hawaiian and Other Pacific Islander alone (% change since 2000)
Races - Two or more races(%)
Races - Two or more races(% change since 2000)
Races - Other race alone (%)
Races - Other race alone (% change since 2000)
Racial diversity
Place of birth - Born in state of residence (%)
Place of birth - Born in state of residence (%) - White
Place of birth - Born in state of residence (%) - Black or African American
Place of birth - Born in state of residence (%) - Asian
Place of birth - Born in state of residence (%) - Hispanic or Latino
Place of birth - Born in state of residence (%) - American Indian and Alaska Native
Place of birth - Born in state of residence (%) - Multirace
Place of birth - Born in state of residence (%) - Other Race
Place of birth - Born in other state (%)
Place of birth - Born in other state (%) - White
Place of birth - Born in other state (%) - Black or African American
Place of birth - Born in other state (%) - Asian
Place of birth - Born in other state (%) - Hispanic or Latino
Place of birth - Born in other state (%) - American Indian and Alaska Native
Place of birth - Born in other state (%) - Multirace
Place of birth - Born in other state (%) - Other Race
Place of birth - Native, outside of US (%)
Place of birth - Native, outside of US (%) - White
Place of birth - Native, outside of US (%) - Black or African American
Place of birth - Native, outside of US (%) - Asian
Place of birth - Native, outside of US (%) - Hispanic or Latino
Place of birth - Native, outside of US (%) - American Indian and Alaska Native
Place of birth - Native, outside of US (%) - Multirace
Place of birth - Native, outside of US (%) - Other Race
Place of birth - Foreign born (%)
Place of birth - Foreign born (%) - White
Place of birth - Foreign born (%) - Black or African American
Place of birth - Foreign born (%) - Asian
Place of birth - Foreign born (%) - Hispanic or Latino
Place of birth - Foreign born (%) - American Indian and Alaska Native
Place of birth - Foreign born (%) - Multirace
Place of birth - Foreign born (%) - Other Race
Residents speaking English at home (%)
Residents speaking English at home - Born in the United States (%)
Residents speaking English at home - Native, born elsewhere (%)
Residents speaking English at home - Foreign born (%)
Residents speaking Spanish at home (%)
Residents speaking Spanish at home - Born in the United States (%)
Residents speaking Spanish at home - Native, born elsewhere (%)
Residents speaking Spanish at home - Foreign born (%)
Residents speaking other language at home (%)
Residents speaking other language at home - Born in the United States (%)
Residents speaking other language at home - Native, born elsewhere (%)
Residents speaking other language at home - Foreign born (%)
Marital status - Never married (%)
Marital status - Now married (%)
Marital status - Separated (%)
Marital status - Widowed (%)
Marital status - Divorced (%)
Ancestries Reported - Arab (%)
Ancestries Reported - Czech (%)
Ancestries Reported - Danish (%)
Ancestries Reported - Dutch (%)
Ancestries Reported - English (%)
Ancestries Reported - French (%)
Ancestries Reported - French Canadian (%)
Ancestries Reported - German (%)
Ancestries Reported - Greek (%)
Ancestries Reported - Hungarian (%)
Ancestries Reported - Irish (%)
Ancestries Reported - Italian (%)
Ancestries Reported - Lithuanian (%)
Ancestries Reported - Norwegian (%)
Ancestries Reported - Polish (%)
Ancestries Reported - Portuguese (%)
Ancestries Reported - Russian (%)
Ancestries Reported - Scotch-Irish (%)
Ancestries Reported - Scottish (%)
Ancestries Reported - Slovak (%)
Ancestries Reported - Subsaharan African (%)
Ancestries Reported - Swedish (%)
Ancestries Reported - Swiss (%)
Ancestries Reported - Ukrainian (%)
Ancestries Reported - United States (%)
Ancestries Reported - Welsh (%)
Ancestries Reported - West Indian (%)
Ancestries Reported - Other (%)
Geographical mobility - Same house 1 year ago (%)
Geographical mobility - Same house 1 year ago (%) - White
Geographical mobility - Same house 1 year ago (%) - Black or African American
Geographical mobility - Same house 1 year ago (%) - Asian
Geographical mobility - Same house 1 year ago (%) - Hispanic or Latino
Geographical mobility - Same house 1 year ago (%) - American Indian and Alaska Native
Geographical mobility - Same house 1 year ago (%) - Multirace
Geographical mobility - Same house 1 year ago (%) - Other Race
Geographical mobility - Moved within same county (%)
Geographical mobility - Moved within same county (%) - White
Geographical mobility - Moved within same county (%) - Black or African American
Geographical mobility - Moved within same county (%) - Asian
Geographical mobility - Moved within same county (%) - Hispanic or Latino
Geographical mobility - Moved within same county (%) - American Indian and Alaska Native
Geographical mobility - Moved within same county (%) - Multirace
Geographical mobility - Moved within same county (%) - Other Race
Geographical mobility - Moved from different county within same state (%)
Geographical mobility - Moved from different county within same state (%) - White
Geographical mobility - Moved from different county within same state (%) - Black or African American
Geographical mobility - Moved from different county within same state (%) - Asian
Geographical mobility - Moved from different county within same state (%) - Hispanic or Latino
Geographical mobility - Moved from different county within same state (%) - American Indian and Alaska Native
Geographical mobility - Moved from different county within same state (%) - Multirace
Geographical mobility - Moved from different county within same state (%) - Other Race
Geographical mobility - Moved from different state (%)
Geographical mobility - Moved from different state (%) - White
Geographical mobility - Moved from different state (%) - Black or African American
Geographical mobility - Moved from different state (%) - Asian
Geographical mobility - Moved from different state (%) - Hispanic or Latino
Geographical mobility - Moved from different state (%) - American Indian and Alaska Native
Geographical mobility - Moved from different state (%) - Multirace
Geographical mobility - Moved from different state (%) - Other Race
Geographical mobility - Moved from abroad (%)
Geographical mobility - Moved from abroad (%) - White
Geographical mobility - Moved from abroad (%) - Black or African American
Geographical mobility - Moved from abroad (%) - Asian
Geographical mobility - Moved from abroad (%) - Hispanic or Latino
Geographical mobility - Moved from abroad (%) - American Indian and Alaska Native
Geographical mobility - Moved from abroad (%) - Multirace
Geographical mobility - Moved from abroad (%) - Other Race
Place of birth for the foreign-born population - Ireland (%)
Place of birth for the foreign-born population - Denmark (%)
Place of birth for the foreign-born population - Norway (%)
Place of birth for the foreign-born population - Sweden (%)
Place of birth for the foreign-born population - United Kingdom (%)
Place of birth for the foreign-born population - England (%)
Place of birth for the foreign-born population - Scotland (%)
Place of birth for the foreign-born population - Other Northern Europe (%)
Place of birth for the foreign-born population - Austria (%)
Place of birth for the foreign-born population - Belgium (%)
Place of birth for the foreign-born population - France (%)
Place of birth for the foreign-born population - Germany (%)
Place of birth for the foreign-born population - Netherlands (%)
Place of birth for the foreign-born population - Switzerland (%)
Place of birth for the foreign-born population - Other Western Europe (%)
Place of birth for the foreign-born population - Greece (%)
Place of birth for the foreign-born population - Italy (%)
Place of birth for the foreign-born population - Portugal (%)
Place of birth for the foreign-born population - Spain (%)
Place of birth for the foreign-born population - Other Southern Europe (%)
Place of birth for the foreign-born population - Albania (%)
Place of birth for the foreign-born population - Belarus (%)
Place of birth for the foreign-born population - Bosnia and Herzegovina (%)
Place of birth for the foreign-born population - Bulgaria (%)
Place of birth for the foreign-born population - Croatia (%)
Place of birth for the foreign-born population - Czechoslovakia (%)
Place of birth for the foreign-born population - Hungary (%)
Place of birth for the foreign-born population - Latvia (%)
Place of birth for the foreign-born population - Lithuania (%)
Place of birth for the foreign-born population - North Macedonia (Macedonia) (%)
Place of birth for the foreign-born population - Moldova (%)
Place of birth for the foreign-born population - Poland (%)
Place of birth for the foreign-born population - Romania (%)
Place of birth for the foreign-born population - Russia (%)
Place of birth for the foreign-born population - Serbia (%)
Place of birth for the foreign-born population - Ukraine (%)
Place of birth for the foreign-born population - Other Eastern Europe (%)
Place of birth for the foreign-born population - China (%)
Place of birth for the foreign-born population - Hong Kong (%)
Place of birth for the foreign-born population - Taiwan (%)
Place of birth for the foreign-born population - Japan (%)
Place of birth for the foreign-born population - Korea (%)
Place of birth for the foreign-born population - Other Eastern Asia (%)
Place of birth for the foreign-born population - Afghanistan (%)
Place of birth for the foreign-born population - Bangladesh (%)
Place of birth for the foreign-born population - India (%)
Place of birth for the foreign-born population - Iran (%)
Place of birth for the foreign-born population - Kazakhstan (%)
Place of birth for the foreign-born population - Nepal (%)
Place of birth for the foreign-born population - Pakistan (%)
Place of birth for the foreign-born population - Sri Lanka (%)
Place of birth for the foreign-born population - Uzbekistan (%)
Place of birth for the foreign-born population - Other South Central Asia (%)
Place of birth for the foreign-born population - Burma (%)
Place of birth for the foreign-born population - Cambodia (%)
Place of birth for the foreign-born population - Indonesia (%)
Place of birth for the foreign-born population - Laos (%)
Place of birth for the foreign-born population - Malaysia (%)
Place of birth for the foreign-born population - Philippines (%)
Place of birth for the foreign-born population - Singapore (%)
Place of birth for the foreign-born population - Thailand (%)
Place of birth for the foreign-born population - Vietnam (%)
Place of birth for the foreign-born population - Other South Eastern Asia (%)
Place of birth for the foreign-born population - Armenia (%)
Place of birth for the foreign-born population - Iraq (%)
Place of birth for the foreign-born population - Israel (%)
Place of birth for the foreign-born population - Jordan (%)
Place of birth for the foreign-born population - Kuwait (%)
Place of birth for the foreign-born population - Lebanon (%)
Place of birth for the foreign-born population - Saudi Arabia (%)
Place of birth for the foreign-born population - Syria (%)
Place of birth for the foreign-born population - Turkey (%)
Place of birth for the foreign-born population - Yemen (%)
Place of birth for the foreign-born population - Other Western Asia (%)
Place of birth for the foreign-born population - Eritrea (%)
Place of birth for the foreign-born population - Ethiopia (%)
Place of birth for the foreign-born population - Kenya (%)
Place of birth for the foreign-born population - Somalia (%)
Place of birth for the foreign-born population - Uganda (%)
Place of birth for the foreign-born population - Zimbabwe (%)
Place of birth for the foreign-born population - Other Eastern Africa (%)
Place of birth for the foreign-born population - Cameroon (%)
Place of birth for the foreign-born population - Congo (%)
Place of birth for the foreign-born population - Democratic Republic of Congo (Zaire) (%)
Place of birth for the foreign-born population - Other Middle Africa (%)
Place of birth for the foreign-born population - Egypt (%)
Place of birth for the foreign-born population - Morocco (%)
Place of birth for the foreign-born population - Sudan (%)
Place of birth for the foreign-born population - Other Northern Africa (%)
Place of birth for the foreign-born population - South Africa (%)
Place of birth for the foreign-born population - Other Southern Africa (%)
Place of birth for the foreign-born population - Cabo Verde (%)
Place of birth for the foreign-born population - Ghana (%)
Place of birth for the foreign-born population - Liberia (%)
Place of birth for the foreign-born population - Nigeria (%)
Place of birth for the foreign-born population - Senegal (%)
Place of birth for the foreign-born population - Sierra Leone (%)
Place of birth for the foreign-born population - Other Western Africa (%)
Place of birth for the foreign-born population - Australia (%)
Place of birth for the foreign-born population - New Zealand (%)
Place of birth for the foreign-born population - Fiji (%)
Place of birth for the foreign-born population - Micronesia (%)
Place of birth for the foreign-born population - Bahamas (%)
Place of birth for the foreign-born population - Barbados (%)
Place of birth for the foreign-born population - Cuba (%)
Place of birth for the foreign-born population - Dominica (%)
Place of birth for the foreign-born population - Dominican Republic (%)
Place of birth for the foreign-born population - Grenada (%)
Place of birth for the foreign-born population - Haiti (%)
Place of birth for the foreign-born population - Jamaica (%)
Place of birth for the foreign-born population - St. Vincent and the Grenadines (%)
Place of birth for the foreign-born population - Trinidad and Tobago (%)
Place of birth for the foreign-born population - West Indies (%)
Place of birth for the foreign-born population - Other Caribbean (%)
Place of birth for the foreign-born population - Belize (%)
Place of birth for the foreign-born population - Costa Rica (%)
Place of birth for the foreign-born population - El Salvador (%)
Place of birth for the foreign-born population - Guatemala (%)
Place of birth for the foreign-born population - Honduras (%)
Place of birth for the foreign-born population - Mexico (%)
Place of birth for the foreign-born population - Nicaragua (%)
Place of birth for the foreign-born population - Panama (%)
Place of birth for the foreign-born population - Other Central America (%)
Place of birth for the foreign-born population - Argentina (%)
Place of birth for the foreign-born population - Bolivia (%)
Place of birth for the foreign-born population - Brazil (%)
Place of birth for the foreign-born population - Chile (%)
Place of birth for the foreign-born population - Colombia (%)
Place of birth for the foreign-born population - Ecuador (%)
Place of birth for the foreign-born population - Guyana (%)
Place of birth for the foreign-born population - Peru (%)
Place of birth for the foreign-born population - Uruguay (%)
Place of birth for the foreign-born population - Venezuela (%)
Place of birth for the foreign-born population - Other South America (%)
Place of birth for the foreign-born population - Canada (%)
Place of birth for the foreign-born population - Other Northern America (%)
Place of birth for the foreign-born population - Other (%)
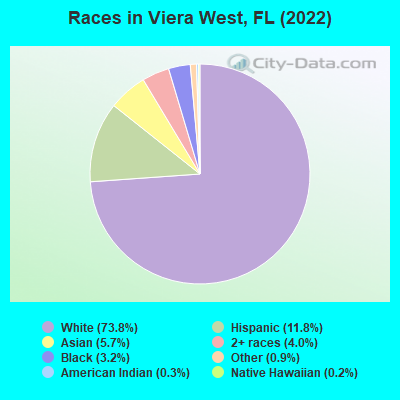
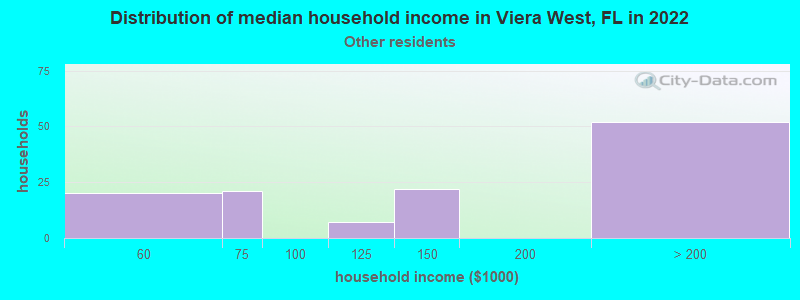
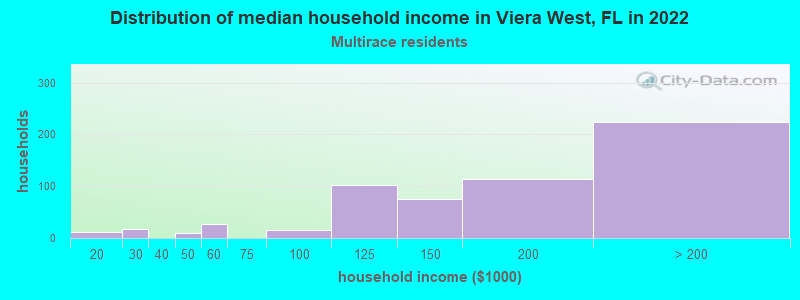
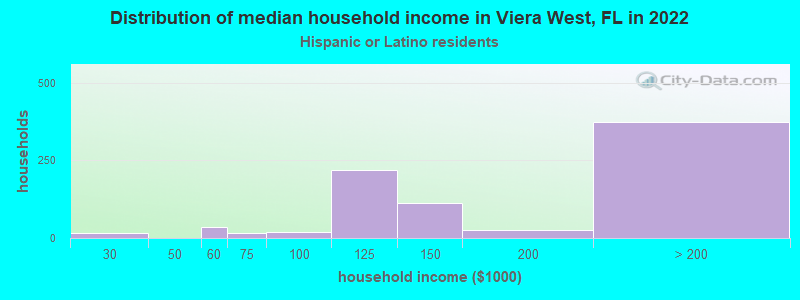
According to 2022 data, the most numerous races in Viera West, FL are White alone (12,167 residents), Hispanic (1,942 residents), and Black alone (532 residents). 84.8% of Viera West residents speak English at home.
Race distribution in Viera West 12,167 73.8% White alone 1,942 11.8% Hispanic 942 5.7% Asian alone 659 4.0% Two or more races 532 3.2% Black alone 154 0.9% Other race alone 50 0.3% American Indian alone 39 0.2% Native Hawaiian and Other
2000 2022
10,458,509 65.4% White alone 2,682,715 16.8% Hispanic 2,264,268 14.2% Black alone 261,693 1.6% Asian alone 236,954 1.5% Two or more races 42,358 0.3% American Indian alone 28,994 0.2% Other race alone 6,887 0.04% Native Hawaiian and Other
11,309,403 50.8% White alone 6,025,039 27.1% Hispanic 3,241,015 14.6% Black alone 861,630 3.9% Two or more races 623,692 2.8% Asian alone 152,054 0.7% Other race alone 22,504 0.1% American Indian alone 9,486 0.04% Native Hawaiian and Other
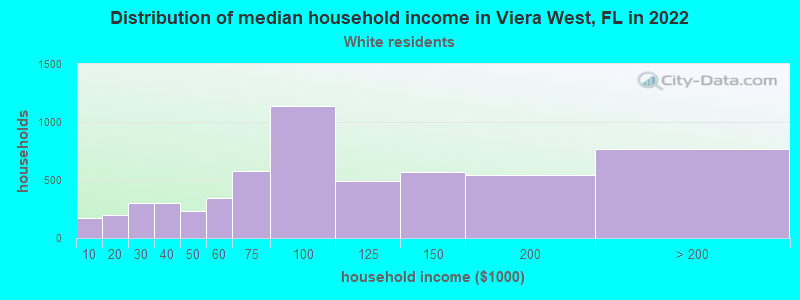
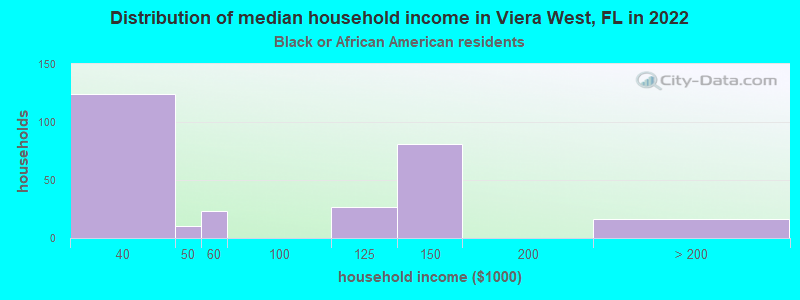
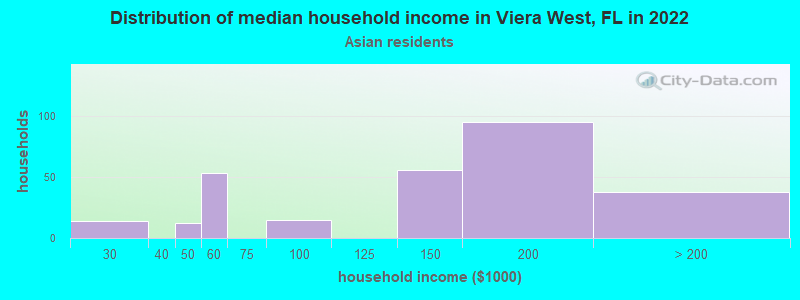
Income and house value in Viera West Median household income in 2022 $82,809 White non-Hispanic householders$177,609 Asian householders$187,264 Two or more races householders$149,421 Hispanic or Latino race householders
Median age by race in Viera West
48.8 Median age for White residents48.1 49.1 72.1 Median age for Black or African American residents74.3 68.7 35.6 Median age for American Indian / Alaska Native residents-611,418,047.3 -594,925,633.7 38.7 Median age for Asian residents39.2 36.3 4.4 Median age for Native Hawaiian / Pacific Islander residents5.5 -443,298,968.6 35.2 Median age for Other race residents19.8 37.6 37.1 Median age for Two or more races residents19.3 39.3 48.6 Median age for White alone residents47.7 48.9 39.7 Median age for Hispanic or Latino residents39.2 38.9
Owner/renter occupied households by race in Viera West
House owners and renters - White residents 4,548 80.7% Owner occupied1,090 19.3% Renter occupiedHouse owners and renters - Black or African American residents 188 78.5% Owner occupied51 21.5% Renter occupiedHouse owners and renters - American Indian / Alaska Native residents 11 100.0% Owner occupiedHouse owners and renters - Asian residents 256 91.3% Owner occupied24 8.7% Renter occupiedHouse owners and renters - Native Hawaiian / Pacific Islander residents 9 100.0% Owner occupiedHouse owners and renters - Other race residents 84 46.0% Owner occupied99 54.0% Renter occupiedHouse owners and renters - Two or more races residents 520 92.4% Owner occupied43 7.6% Renter occupiedHouse owners and renters - White alone residents 4,434 79.9% Owner occupied1,113 20.1% Renter occupiedHouse owners and renters - Hispanic or Latino residents 536 84.7% Owner occupied97 15.3% Renter occupied
Language usage in Viera West
English speakers - Total 84.8% of residents of Viera West speak English at home.
8.5% of residents speak Spanish at home 1,186 88.6% Speak English very well153 11.4% Speak English less than very well6.3% of residents speak other language at home 658 66.4% Speak English very well333 33.6% Speak English less than very well
English speakers - Born in the United States 96.2% of residents of Viera West speak English at home.
3.1% of residents speak Spanish at home 284 85.8% Speak English very well47 14.2% Speak English less than very well0.7% of residents speak other language at home 69 97.2% Speak English very well2 2.8% Speak English less than very well
English speakers - Native, born elsewhere 35.6% of residents of Viera West speak English at home.
54.5% of residents speak Spanish at home 309 100.0% Speak English very well3.5% of residents speak other language at home 20 100.0% Speak English very well
English speakers - Foreign-born 24.6% of residents of Viera West speak English at home.
26.0% of residents speak Spanish at home 482 93.1% Speak English very well36 6.9% Speak English less than very well45.3% of residents speak other language at home 560 62.1% Speak English very well342 37.9% Speak English less than very well
White (Caucasian) - Speak only English Native:
96.9% (11,093)Foreign-born:
40.4% (221)
White (Caucasian) - Speak another language Native:
2.9% (336)Foreign-born:
57.6% (314)
Black or African American - Speak only English Native:
96.3% (419)Foreign-born:
92.1% (85)
Asian - Speak only English Native:
59.6% (82)Foreign-born:
17.3% (144)
Asian - Speak another language Native:
39.7% (55)Foreign-born:
82.0% (680)
Other race - Speak only English Native:
71.4% (344)Foreign-born:
47.5% (19)
Other race - Speak another language Native:
31.3% (151)Foreign-born:
24.2% (10)
Two or more races - Speak only English Native:
71.9% (889)Foreign-born:
5.2% (28)
Two or more races - Speak another language Native:
28.3% (349)Foreign-born:
91.1% (498)
White alone - Speak only English Native:
98.3% (11,095)Foreign-born:
46.1% (231)
White alone - Speak another language Native:
1.5% (173)Foreign-born:
53.4% (267)
Hispanic or Latino - Speak another language Native:
55.3% (660)Foreign-born:
100.0% (560)
Foreign-born residents in Viera West
Marital status for residents in Viera West Marital status - White (Caucasian) population 15 years and over
Males 13.2% Never married62.0% Now married1.6% Separated2.7% Widowed20.5% DivorcedFemales 13.5% Never married55.5% Now married0.0% Separated13.3% Widowed17.8% DivorcedWomen who gave birth in the past 12 months Now married:
100.0% (67)Unmarried:
0.0% (0)
Women who did not give birth in the past 12 months Now married:
56.3% (1,347)Unmarried:
43.7% (1,045)
Marital status - Black or African American population 15 years and over
Males 13.6% Never married65.4% Now married0.0% Separated21.0% Widowed0.0% DivorcedFemales 15.3% Never married64.9% Now married0.0% Separated0.0% Widowed19.8% DivorcedWomen who did not give birth in the past 12 months Now married:
18.0% (9)Unmarried:
82.0% (40)
Marital status - American Indian / Alaska Native population 15 years and over
Males 0.0% Never married100.0% Now married0.0% Separated0.0% Widowed0.0% DivorcedFemales 0.0% Never married100.0% Now married0.0% Separated0.0% Widowed0.0% DivorcedWomen who gave birth in the past 12 months Now married:
100.0% (56)Unmarried:
0.0% (0)
Women who did not give birth in the past 12 months Now married:
100.0% (5)Unmarried:
0.0% (0)
Marital status - Asian population 15 years and over
Males 26.4% Never married73.6% Now married0.0% Separated0.0% Widowed0.0% DivorcedFemales 34.2% Never married62.8% Now married0.0% Separated3.0% Widowed0.0% DivorcedWomen who did not give birth in the past 12 months Now married:
42.6% (125)Unmarried:
57.4% (169)
Marital status - Other race population 15 years and over
Males 82.9% Never married17.1% Now married0.0% Separated0.0% Widowed0.0% DivorcedFemales 9.2% Never married17.1% Now married27.0% Separated0.0% Widowed46.7% DivorcedWomen who did not give birth in the past 12 months Now married:
23.4% (34)Unmarried:
76.6% (110)
Marital status - Two or more races population 15 years and over
Males 19.5% Never married80.5% Now married0.0% Separated0.0% Widowed0.0% DivorcedFemales 22.7% Never married63.7% Now married0.0% Separated10.8% Widowed2.8% DivorcedWomen who did not give birth in the past 12 months Now married:
70.4% (367)Unmarried:
29.6% (154)
Marital status - White alone, not Hispanic / Latino population 15 years and over
Males 13.7% Never married62.6% Now married1.7% Separated2.8% Widowed19.2% DivorcedFemales 12.5% Never married54.9% Now married0.0% Separated13.9% Widowed18.7% DivorcedWomen who gave birth in the past 12 months Now married:
100.0% (69)Unmarried:
0.0% (0)
Women who did not give birth in the past 12 months Now married:
57.4% (1,345)Unmarried:
42.6% (997)
Marital status - Hispanic or Latino population 15 years and over
Males 22.4% Never married62.2% Now married0.0% Separated0.0% Widowed15.4% DivorcedFemales 14.3% Never married64.1% Now married6.1% Separated3.0% Widowed12.5% DivorcedWomen who did not give birth in the past 12 months Now married:
60.7% (282)Unmarried:
39.3% (183)
Ancestries in Viera West
1,163 15.4% American702 9.3% Italian530 7.0% English352 4.7% Irish246 3.3% German226 3.0% Dutch209 2.8% European192 2.5% Iranian129 1.7% Russian125 1.7% Scottish76 1.0% Norwegian75 1.0% Canadian68 0.9% Polish65 0.9% Lebanese65 0.9% Eastern European58 0.8% British56 0.7% Welsh48 0.6% French45 0.6% Barbadian42 0.6% Czech37 0.5% Finnish34 0.5% Scotch-Irish26 0.3% Greek25 0.3% French Canadian22 0.3% Danish19 0.3% Jamaican17 0.2% Hungarian15 0.2% Ukrainian14 0.2% Swedish12 0.2% Austrian12 0.2% Turkish
Children Nativity (place of birth) in Viera West
Children under 6 years - Living with two parents Both parents native 771 100.0% NativeBoth parents foreign-born 105 100.0% NativeOne native, one foreign-born parent 138 100.0% NativeChildren under 6 years - Living with one parent Native parent 58 100.0% NativeChildren 6 to 17 years - Living with two parents Both parents native 1,392 98.2% Native26 1.8% Foreign-bornBoth parents foreign-born 235 63.8% Native134 36.2% Foreign-bornOne native, one foreign-born parent 279 100.0% NativeChildren 6 to 17 years - Living with one parent Native parent 350 100.0% NativeForeign-born parent 36 52.7% Native32 47.3% Foreign-born