Races in Viera East, Florida (FL) Detailed Stats
Data:
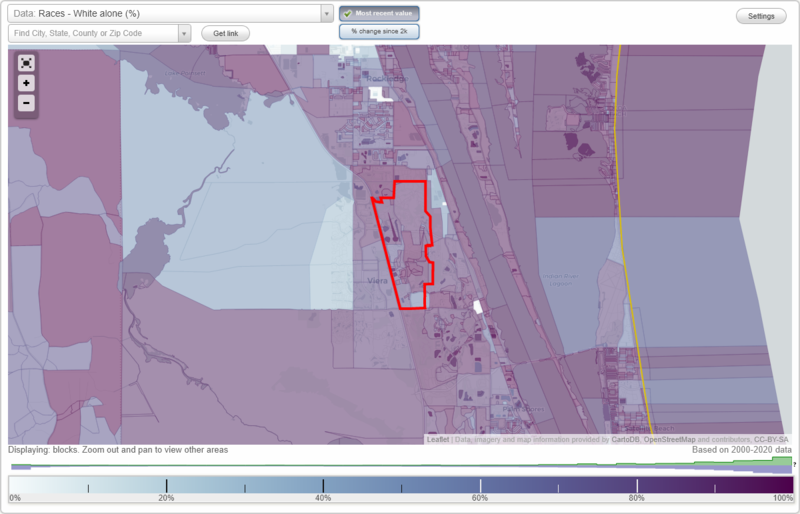
Races - White alone (%)
Races - White alone (% change since 2000)
Races - Black alone (%)
Races - Black alone (% change since 2000)
Races - American Indian alone (%)
Races - American Indian alone (% change since 2000)
Races - Asian alone (%)
Races - Asian alone (% change since 2000)
Races - Hispanic (%)
Races - Hispanic (% change since 2000)
Races - Native Hawaiian and Other Pacific Islander alone (%)
Races - Native Hawaiian and Other Pacific Islander alone (% change since 2000)
Races - Two or more races(%)
Races - Two or more races(% change since 2000)
Races - Other race alone (%)
Races - Other race alone (% change since 2000)
Racial diversity
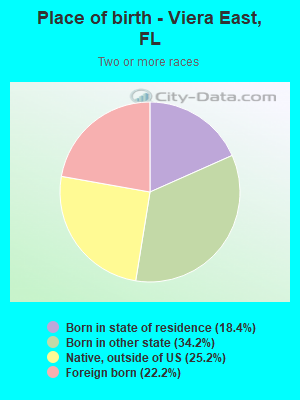
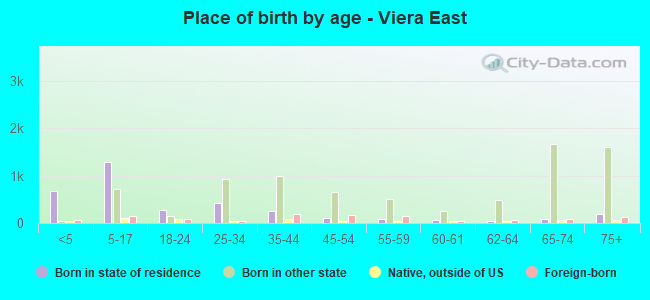
Place of birth - Born in state of residence (%)
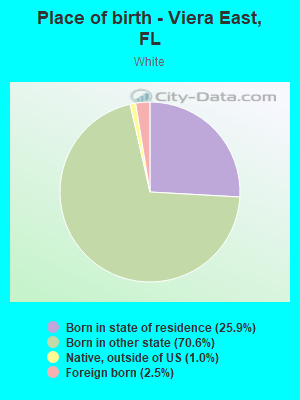
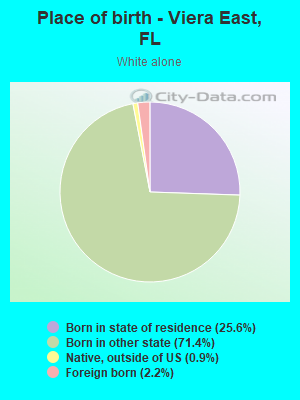
Place of birth - Born in state of residence (%) - White
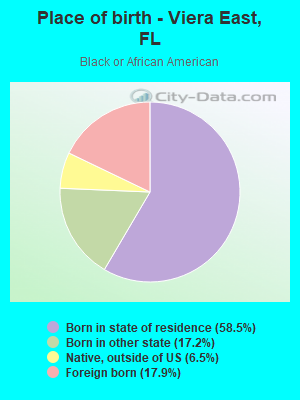
Place of birth - Born in state of residence (%) - Black or African American
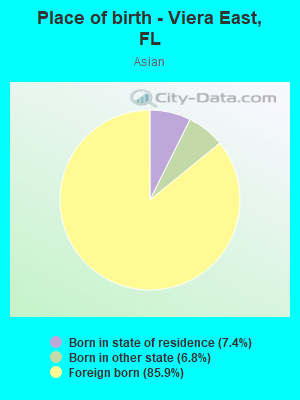
Place of birth - Born in state of residence (%) - Asian
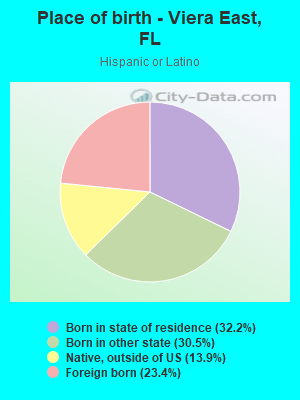
Place of birth - Born in state of residence (%) - Hispanic or Latino
Place of birth - Born in state of residence (%) - American Indian and Alaska Native
Place of birth - Born in state of residence (%) - Multirace
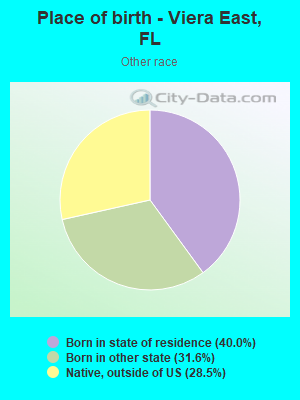
Place of birth - Born in state of residence (%) - Other Race
Place of birth - Born in other state (%)
Place of birth - Born in other state (%) - White
Place of birth - Born in other state (%) - Black or African American
Place of birth - Born in other state (%) - Asian
Place of birth - Born in other state (%) - Hispanic or Latino
Place of birth - Born in other state (%) - American Indian and Alaska Native
Place of birth - Born in other state (%) - Multirace
Place of birth - Born in other state (%) - Other Race
Place of birth - Native, outside of US (%)
Place of birth - Native, outside of US (%) - White
Place of birth - Native, outside of US (%) - Black or African American
Place of birth - Native, outside of US (%) - Asian
Place of birth - Native, outside of US (%) - Hispanic or Latino
Place of birth - Native, outside of US (%) - American Indian and Alaska Native
Place of birth - Native, outside of US (%) - Multirace
Place of birth - Native, outside of US (%) - Other Race
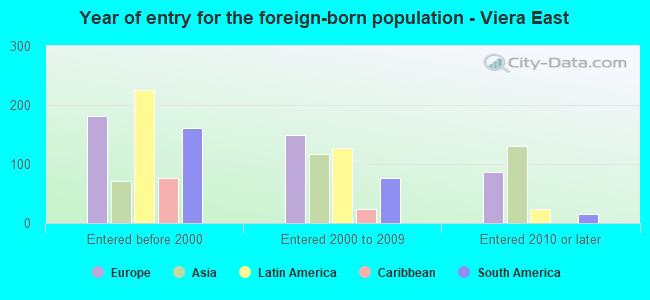
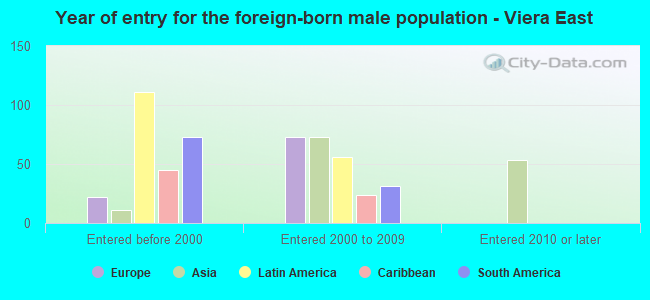
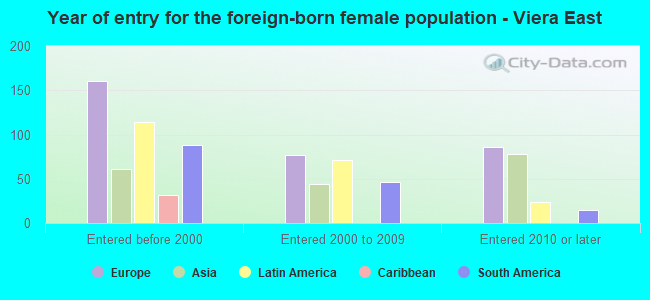
Place of birth - Foreign born (%)
Place of birth - Foreign born (%) - White
Place of birth - Foreign born (%) - Black or African American
Place of birth - Foreign born (%) - Asian
Place of birth - Foreign born (%) - Hispanic or Latino
Place of birth - Foreign born (%) - American Indian and Alaska Native
Place of birth - Foreign born (%) - Multirace
Place of birth - Foreign born (%) - Other Race
Residents speaking English at home (%)
Residents speaking English at home - Born in the United States (%)
Residents speaking English at home - Native, born elsewhere (%)
Residents speaking English at home - Foreign born (%)
Residents speaking Spanish at home (%)
Residents speaking Spanish at home - Born in the United States (%)
Residents speaking Spanish at home - Native, born elsewhere (%)
Residents speaking Spanish at home - Foreign born (%)
Residents speaking other language at home (%)
Residents speaking other language at home - Born in the United States (%)
Residents speaking other language at home - Native, born elsewhere (%)
Residents speaking other language at home - Foreign born (%)
Marital status - Never married (%)
Marital status - Now married (%)
Marital status - Separated (%)
Marital status - Widowed (%)
Marital status - Divorced (%)
Ancestries Reported - Arab (%)
Ancestries Reported - Czech (%)
Ancestries Reported - Danish (%)
Ancestries Reported - Dutch (%)
Ancestries Reported - English (%)
Ancestries Reported - French (%)
Ancestries Reported - French Canadian (%)
Ancestries Reported - German (%)
Ancestries Reported - Greek (%)
Ancestries Reported - Hungarian (%)
Ancestries Reported - Irish (%)
Ancestries Reported - Italian (%)
Ancestries Reported - Lithuanian (%)
Ancestries Reported - Norwegian (%)
Ancestries Reported - Polish (%)
Ancestries Reported - Portuguese (%)
Ancestries Reported - Russian (%)
Ancestries Reported - Scotch-Irish (%)
Ancestries Reported - Scottish (%)
Ancestries Reported - Slovak (%)
Ancestries Reported - Subsaharan African (%)
Ancestries Reported - Swedish (%)
Ancestries Reported - Swiss (%)
Ancestries Reported - Ukrainian (%)
Ancestries Reported - United States (%)
Ancestries Reported - Welsh (%)
Ancestries Reported - West Indian (%)
Ancestries Reported - Other (%)
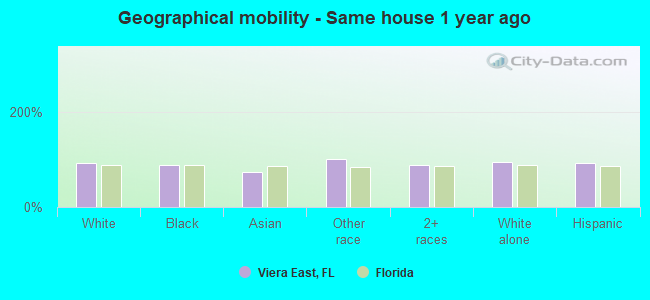
Geographical mobility - Same house 1 year ago (%)
Geographical mobility - Same house 1 year ago (%) - White
Geographical mobility - Same house 1 year ago (%) - Black or African American
Geographical mobility - Same house 1 year ago (%) - Asian
Geographical mobility - Same house 1 year ago (%) - Hispanic or Latino
Geographical mobility - Same house 1 year ago (%) - American Indian and Alaska Native
Geographical mobility - Same house 1 year ago (%) - Multirace
Geographical mobility - Same house 1 year ago (%) - Other Race
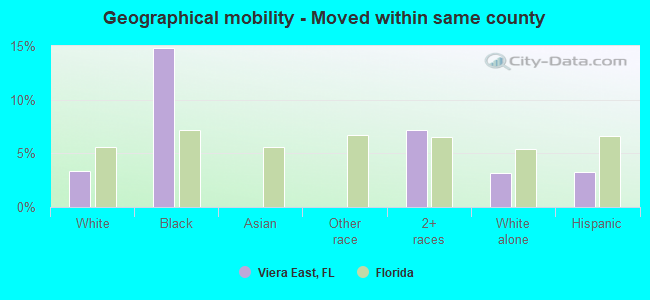
Geographical mobility - Moved within same county (%)
Geographical mobility - Moved within same county (%) - White
Geographical mobility - Moved within same county (%) - Black or African American
Geographical mobility - Moved within same county (%) - Asian
Geographical mobility - Moved within same county (%) - Hispanic or Latino
Geographical mobility - Moved within same county (%) - American Indian and Alaska Native
Geographical mobility - Moved within same county (%) - Multirace
Geographical mobility - Moved within same county (%) - Other Race
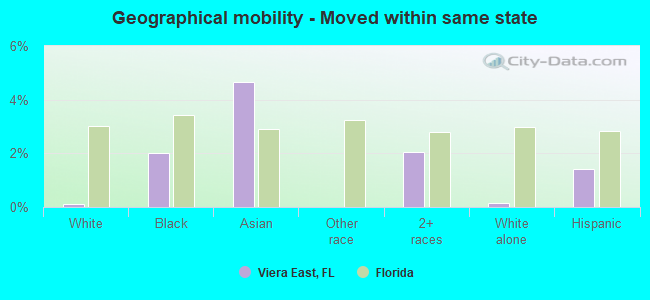
Geographical mobility - Moved from different county within same state (%)
Geographical mobility - Moved from different county within same state (%) - White
Geographical mobility - Moved from different county within same state (%) - Black or African American
Geographical mobility - Moved from different county within same state (%) - Asian
Geographical mobility - Moved from different county within same state (%) - Hispanic or Latino
Geographical mobility - Moved from different county within same state (%) - American Indian and Alaska Native
Geographical mobility - Moved from different county within same state (%) - Multirace
Geographical mobility - Moved from different county within same state (%) - Other Race
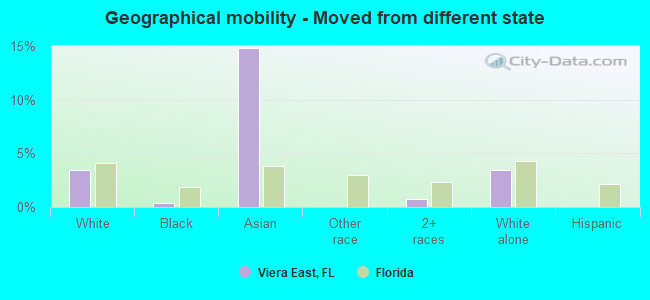
Geographical mobility - Moved from different state (%)
Geographical mobility - Moved from different state (%) - White
Geographical mobility - Moved from different state (%) - Black or African American
Geographical mobility - Moved from different state (%) - Asian
Geographical mobility - Moved from different state (%) - Hispanic or Latino
Geographical mobility - Moved from different state (%) - American Indian and Alaska Native
Geographical mobility - Moved from different state (%) - Multirace
Geographical mobility - Moved from different state (%) - Other Race
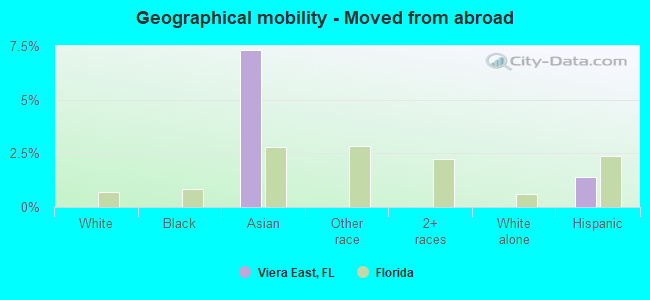
Geographical mobility - Moved from abroad (%)
Geographical mobility - Moved from abroad (%) - White
Geographical mobility - Moved from abroad (%) - Black or African American
Geographical mobility - Moved from abroad (%) - Asian
Geographical mobility - Moved from abroad (%) - Hispanic or Latino
Geographical mobility - Moved from abroad (%) - American Indian and Alaska Native
Geographical mobility - Moved from abroad (%) - Multirace
Geographical mobility - Moved from abroad (%) - Other Race
Place of birth for the foreign-born population - Ireland (%)
Place of birth for the foreign-born population - Denmark (%)
Place of birth for the foreign-born population - Norway (%)
Place of birth for the foreign-born population - Sweden (%)
Place of birth for the foreign-born population - United Kingdom (%)
Place of birth for the foreign-born population - England (%)
Place of birth for the foreign-born population - Scotland (%)
Place of birth for the foreign-born population - Other Northern Europe (%)
Place of birth for the foreign-born population - Austria (%)
Place of birth for the foreign-born population - Belgium (%)
Place of birth for the foreign-born population - France (%)
Place of birth for the foreign-born population - Germany (%)
Place of birth for the foreign-born population - Netherlands (%)
Place of birth for the foreign-born population - Switzerland (%)
Place of birth for the foreign-born population - Other Western Europe (%)
Place of birth for the foreign-born population - Greece (%)
Place of birth for the foreign-born population - Italy (%)
Place of birth for the foreign-born population - Portugal (%)
Place of birth for the foreign-born population - Spain (%)
Place of birth for the foreign-born population - Other Southern Europe (%)
Place of birth for the foreign-born population - Albania (%)
Place of birth for the foreign-born population - Belarus (%)
Place of birth for the foreign-born population - Bosnia and Herzegovina (%)
Place of birth for the foreign-born population - Bulgaria (%)
Place of birth for the foreign-born population - Croatia (%)
Place of birth for the foreign-born population - Czechoslovakia (%)
Place of birth for the foreign-born population - Hungary (%)
Place of birth for the foreign-born population - Latvia (%)
Place of birth for the foreign-born population - Lithuania (%)
Place of birth for the foreign-born population - North Macedonia (Macedonia) (%)
Place of birth for the foreign-born population - Moldova (%)
Place of birth for the foreign-born population - Poland (%)
Place of birth for the foreign-born population - Romania (%)
Place of birth for the foreign-born population - Russia (%)
Place of birth for the foreign-born population - Serbia (%)
Place of birth for the foreign-born population - Ukraine (%)
Place of birth for the foreign-born population - Other Eastern Europe (%)
Place of birth for the foreign-born population - China (%)
Place of birth for the foreign-born population - Hong Kong (%)
Place of birth for the foreign-born population - Taiwan (%)
Place of birth for the foreign-born population - Japan (%)
Place of birth for the foreign-born population - Korea (%)
Place of birth for the foreign-born population - Other Eastern Asia (%)
Place of birth for the foreign-born population - Afghanistan (%)
Place of birth for the foreign-born population - Bangladesh (%)
Place of birth for the foreign-born population - India (%)
Place of birth for the foreign-born population - Iran (%)
Place of birth for the foreign-born population - Kazakhstan (%)
Place of birth for the foreign-born population - Nepal (%)
Place of birth for the foreign-born population - Pakistan (%)
Place of birth for the foreign-born population - Sri Lanka (%)
Place of birth for the foreign-born population - Uzbekistan (%)
Place of birth for the foreign-born population - Other South Central Asia (%)
Place of birth for the foreign-born population - Burma (%)
Place of birth for the foreign-born population - Cambodia (%)
Place of birth for the foreign-born population - Indonesia (%)
Place of birth for the foreign-born population - Laos (%)
Place of birth for the foreign-born population - Malaysia (%)
Place of birth for the foreign-born population - Philippines (%)
Place of birth for the foreign-born population - Singapore (%)
Place of birth for the foreign-born population - Thailand (%)
Place of birth for the foreign-born population - Vietnam (%)
Place of birth for the foreign-born population - Other South Eastern Asia (%)
Place of birth for the foreign-born population - Armenia (%)
Place of birth for the foreign-born population - Iraq (%)
Place of birth for the foreign-born population - Israel (%)
Place of birth for the foreign-born population - Jordan (%)
Place of birth for the foreign-born population - Kuwait (%)
Place of birth for the foreign-born population - Lebanon (%)
Place of birth for the foreign-born population - Saudi Arabia (%)
Place of birth for the foreign-born population - Syria (%)
Place of birth for the foreign-born population - Turkey (%)
Place of birth for the foreign-born population - Yemen (%)
Place of birth for the foreign-born population - Other Western Asia (%)
Place of birth for the foreign-born population - Eritrea (%)
Place of birth for the foreign-born population - Ethiopia (%)
Place of birth for the foreign-born population - Kenya (%)
Place of birth for the foreign-born population - Somalia (%)
Place of birth for the foreign-born population - Uganda (%)
Place of birth for the foreign-born population - Zimbabwe (%)
Place of birth for the foreign-born population - Other Eastern Africa (%)
Place of birth for the foreign-born population - Cameroon (%)
Place of birth for the foreign-born population - Congo (%)
Place of birth for the foreign-born population - Democratic Republic of Congo (Zaire) (%)
Place of birth for the foreign-born population - Other Middle Africa (%)
Place of birth for the foreign-born population - Egypt (%)
Place of birth for the foreign-born population - Morocco (%)
Place of birth for the foreign-born population - Sudan (%)
Place of birth for the foreign-born population - Other Northern Africa (%)
Place of birth for the foreign-born population - South Africa (%)
Place of birth for the foreign-born population - Other Southern Africa (%)
Place of birth for the foreign-born population - Cabo Verde (%)
Place of birth for the foreign-born population - Ghana (%)
Place of birth for the foreign-born population - Liberia (%)
Place of birth for the foreign-born population - Nigeria (%)
Place of birth for the foreign-born population - Senegal (%)
Place of birth for the foreign-born population - Sierra Leone (%)
Place of birth for the foreign-born population - Other Western Africa (%)
Place of birth for the foreign-born population - Australia (%)
Place of birth for the foreign-born population - New Zealand (%)
Place of birth for the foreign-born population - Fiji (%)
Place of birth for the foreign-born population - Micronesia (%)
Place of birth for the foreign-born population - Bahamas (%)
Place of birth for the foreign-born population - Barbados (%)
Place of birth for the foreign-born population - Cuba (%)
Place of birth for the foreign-born population - Dominica (%)
Place of birth for the foreign-born population - Dominican Republic (%)
Place of birth for the foreign-born population - Grenada (%)
Place of birth for the foreign-born population - Haiti (%)
Place of birth for the foreign-born population - Jamaica (%)
Place of birth for the foreign-born population - St. Vincent and the Grenadines (%)
Place of birth for the foreign-born population - Trinidad and Tobago (%)
Place of birth for the foreign-born population - West Indies (%)
Place of birth for the foreign-born population - Other Caribbean (%)
Place of birth for the foreign-born population - Belize (%)
Place of birth for the foreign-born population - Costa Rica (%)
Place of birth for the foreign-born population - El Salvador (%)
Place of birth for the foreign-born population - Guatemala (%)
Place of birth for the foreign-born population - Honduras (%)
Place of birth for the foreign-born population - Mexico (%)
Place of birth for the foreign-born population - Nicaragua (%)
Place of birth for the foreign-born population - Panama (%)
Place of birth for the foreign-born population - Other Central America (%)
Place of birth for the foreign-born population - Argentina (%)
Place of birth for the foreign-born population - Bolivia (%)
Place of birth for the foreign-born population - Brazil (%)
Place of birth for the foreign-born population - Chile (%)
Place of birth for the foreign-born population - Colombia (%)
Place of birth for the foreign-born population - Ecuador (%)
Place of birth for the foreign-born population - Guyana (%)
Place of birth for the foreign-born population - Peru (%)
Place of birth for the foreign-born population - Uruguay (%)
Place of birth for the foreign-born population - Venezuela (%)
Place of birth for the foreign-born population - Other South America (%)
Place of birth for the foreign-born population - Canada (%)
Place of birth for the foreign-born population - Other Northern America (%)
Place of birth for the foreign-born population - Other (%)
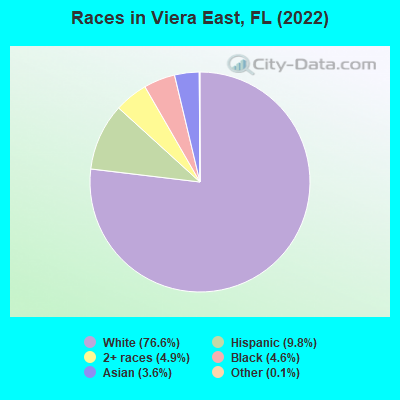
According to 2022 data, the most numerous races in Viera East, FL are White alone (9,921 residents), Hispanic (1,270 residents), and Black alone (601 residents). 90.0% of Viera East residents speak English at home.
Race distribution in Viera East 9,921 76.6% White alone 1,270 9.8% Hispanic 634 4.9% Two or more races 601 4.6% Black alone 460 3.6% Asian alone 19 0.1% Other race alone
2000 2022
10,458,509 65.4% White alone 2,682,715 16.8% Hispanic 2,264,268 14.2% Black alone 261,693 1.6% Asian alone 236,954 1.5% Two or more races 42,358 0.3% American Indian alone 28,994 0.2% Other race alone 6,887 0.04% Native Hawaiian and Other
11,309,403 50.8% White alone 6,025,039 27.1% Hispanic 3,241,015 14.6% Black alone 861,630 3.9% Two or more races 623,692 2.8% Asian alone 152,054 0.7% Other race alone 22,504 0.1% American Indian alone 9,486 0.04% Native Hawaiian and Other
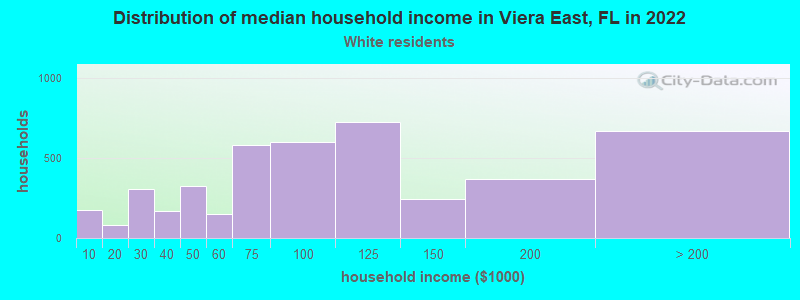
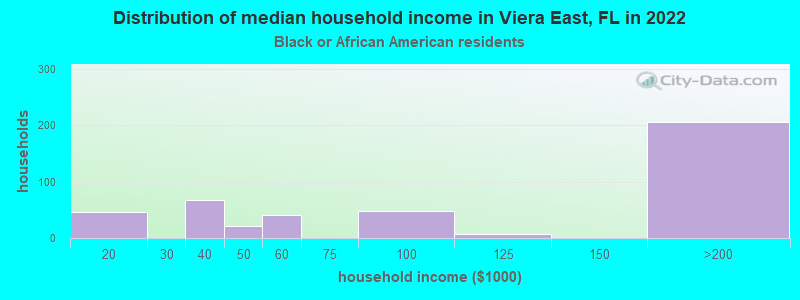
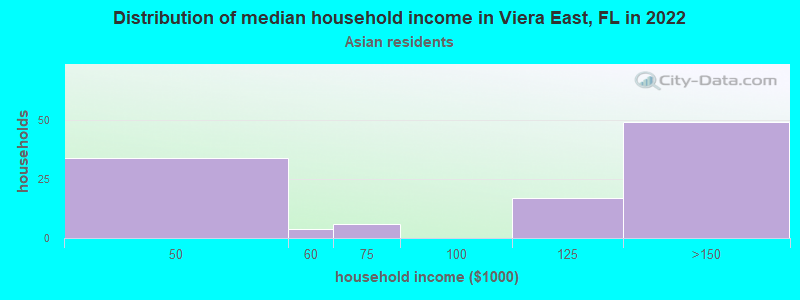
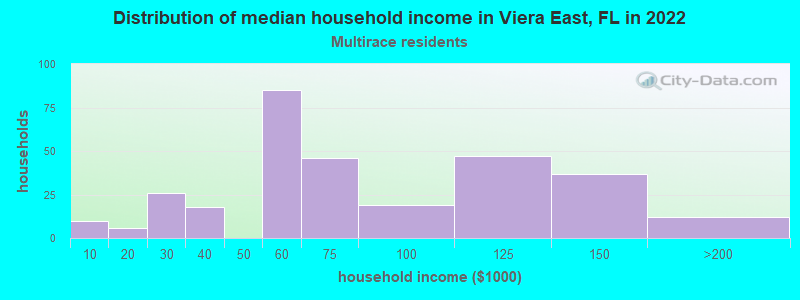
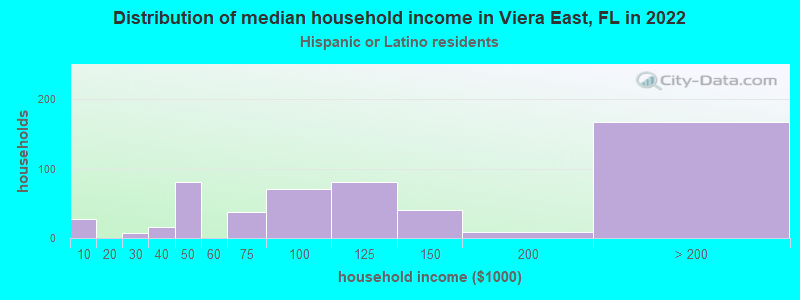
Income and house value in Viera East Median household income in 2022 $93,525 White non-Hispanic householders$122,519 Asian householders$75,127 Two or more races householders$114,329 Hispanic or Latino race householders
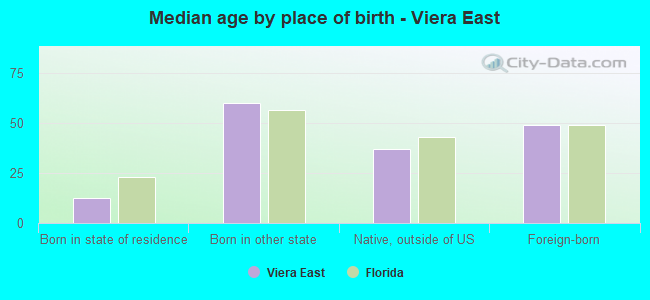
Median age by race in Viera East
50.1 Median age for White residents50.8 48.8 52.3 Median age for Black or African American residents56.2 42.8 -598,566,307.6 Median age for American Indian / Alaska Native residents-611,418,047.3 -594,925,633.7 44.0 Median age for Asian residents46.6 42.5 -679,849,340.2 Median age for Native Hawaiian / Pacific Islander residents-858,307,848.3 -443,298,968.6 29.5 Median age for Other race residents-804,526,748.2 17.7 22.8 Median age for Two or more races residents33.1 23.8 51.1 Median age for White alone residents50.9 50.8 37.8 Median age for Hispanic or Latino residents46.5 18.8
Owner/renter occupied households by race in Viera East
House owners and renters - White residents 3,325 76.9% Owner occupied1,001 23.1% Renter occupiedHouse owners and renters - Black or African American residents 140 32.6% Owner occupied289 67.4% Renter occupiedHouse owners and renters - Asian residents 100 82.5% Owner occupied21 17.5% Renter occupiedHouse owners and renters - Other race residents 34 100.0% Owner occupiedHouse owners and renters - Two or more races residents 164 48.0% Owner occupied178 52.0% Renter occupiedHouse owners and renters - White alone residents 3,164 75.8% Owner occupied1,010 24.2% Renter occupiedHouse owners and renters - Hispanic or Latino residents 397 82.2% Owner occupied86 17.8% Renter occupied
Language usage in Viera East
English speakers - Total 90.0% of residents of Viera East speak English at home.
7.1% of residents speak Spanish at home 619 71.5% Speak English very well247 28.5% Speak English less than very well3.0% of residents speak other language at home 285 79.2% Speak English very well75 20.8% Speak English less than very well
English speakers - Born in the United States 96.1% of residents of Viera East speak English at home.
3.6% of residents speak Spanish at home 287 100.0% Speak English very well0.5% of residents speak other language at home 42 100.0% Speak English very well
English speakers - Native, born elsewhere 67.6% of residents of Viera East speak English at home.
34.0% of residents speak Spanish at home 94 64.8% Speak English very well51 35.2% Speak English less than very well1.6% of residents speak other language at home 7 100.0% Speak English very well
English speakers - Foreign-born 41.6% of residents of Viera East speak English at home.
26.0% of residents speak Spanish at home 114 43.3% Speak English very well149 56.7% Speak English less than very well32.2% of residents speak other language at home 248 76.1% Speak English very well78 23.9% Speak English less than very well
White (Caucasian) - Speak only English Native:
97.9% (9,170)Foreign-born:
61.4% (161)
White (Caucasian) - Speak another language Native:
2.3% (212)Foreign-born:
40.9% (107)
Black or African American - Speak only English Native:
83.6% (447)Foreign-born:
92.1% (110)
Asian - Speak only English Native:
80.0% (70)Foreign-born:
32.2% (140)
Two or more races - Speak only English Native:
72.8% (692)Foreign-born:
4.1% (8)
Two or more races - Speak another language Native:
27.3% (260)Foreign-born:
92.0% (170)
White alone - Speak only English Native:
99.3% (9,048)Foreign-born:
64.2% (138)
White alone - Speak another language Native:
0.9% (79)Foreign-born:
36.2% (78)
Hispanic or Latino - Speak only English Native:
37.6% (331)Foreign-born:
11.5% (34)
Hispanic or Latino - Speak another language Native:
61.1% (537)Foreign-born:
88.6% (263)
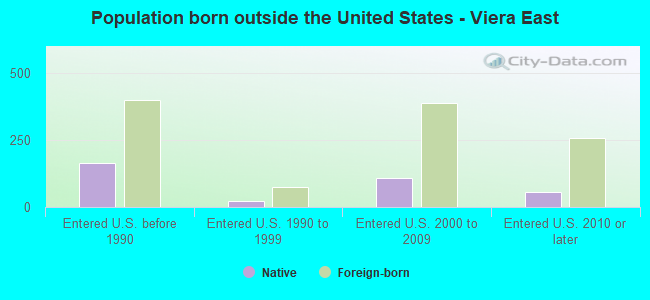
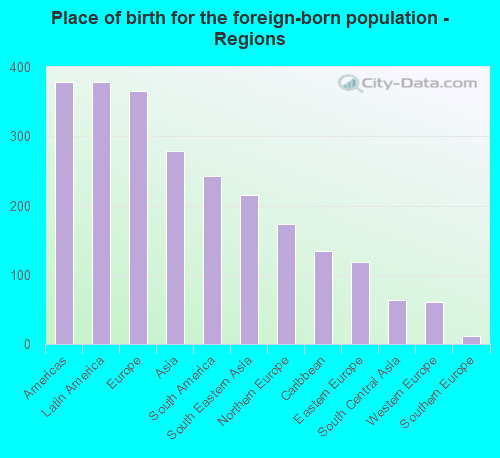
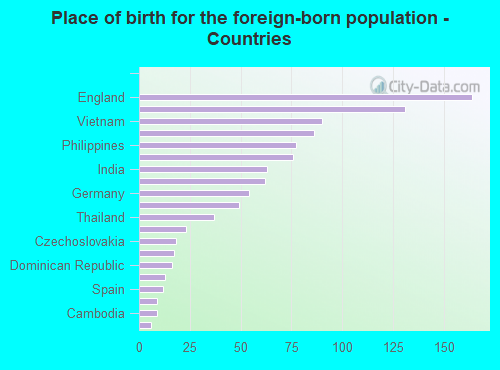
Foreign-born residents in Viera East
Marital status for residents in Viera East Marital status - White (Caucasian) population 15 years and over
Males 17.7% Never married65.3% Now married1.2% Separated3.7% Widowed12.2% DivorcedFemales 15.0% Never married58.1% Now married0.3% Separated10.5% Widowed16.0% DivorcedWomen who gave birth in the past 12 months Now married:
61.1% (32)Unmarried:
38.9% (20)
Women who did not give birth in the past 12 months Now married:
56.3% (857)Unmarried:
43.7% (665)
Marital status - Black or African American population 15 years and over
Males 29.7% Never married65.1% Now married0.0% Separated5.2% Widowed0.0% DivorcedFemales 48.3% Never married29.6% Now married2.6% Separated16.6% Widowed2.9% DivorcedWomen who did not give birth in the past 12 months Now married:
11.0% (22)Unmarried:
89.0% (181)
Marital status - Asian population 15 years and over
Males 20.0% Never married80.0% Now married0.0% Separated0.0% Widowed0.0% DivorcedFemales 21.9% Never married67.0% Now married0.0% Separated4.5% Widowed6.7% DivorcedWomen who did not give birth in the past 12 months Now married:
55.2% (90)Unmarried:
44.8% (73)
Marital status - Other race population 15 years and over
Males 38.9% Never married61.1% Now married0.0% Separated0.0% Widowed0.0% DivorcedFemales 83.6% Never married16.4% Now married0.0% Separated0.0% Widowed0.0% DivorcedWomen who did not give birth in the past 12 months Now married:
0.0% (0)Unmarried:
100.0% (73)
Marital status - Two or more races population 15 years and over
Males 22.8% Never married62.7% Now married0.0% Separated4.4% Widowed10.1% DivorcedFemales 45.8% Never married15.0% Now married17.0% Separated5.1% Widowed17.0% DivorcedWomen who did not give birth in the past 12 months Now married:
27.9% (154)Unmarried:
72.1% (400)
Marital status - White alone, not Hispanic / Latino population 15 years and over
Males 18.2% Never married64.2% Now married1.3% Separated3.8% Widowed12.5% DivorcedFemales 14.8% Never married59.0% Now married0.3% Separated9.8% Widowed16.1% DivorcedWomen who gave birth in the past 12 months Now married:
51.2% (22)Unmarried:
48.8% (21)
Women who did not give birth in the past 12 months Now married:
56.5% (848)Unmarried:
43.5% (654)
Marital status - Hispanic or Latino population 15 years and over
Males 9.3% Never married88.6% Now married0.0% Separated0.0% Widowed2.1% DivorcedFemales 32.6% Never married37.0% Now married0.0% Separated15.8% Widowed14.6% DivorcedWomen who gave birth in the past 12 months Now married:
100.0% (12)Unmarried:
0.0% (0)
Women who did not give birth in the past 12 months Now married:
31.4% (67)Unmarried:
68.6% (146)
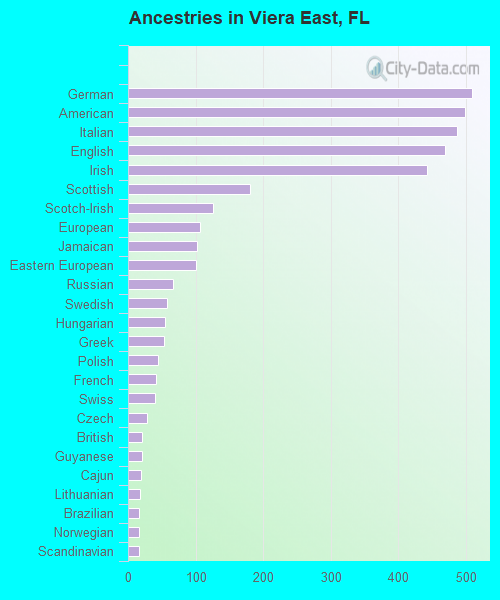
Ancestries in Viera East
509 10.2% German499 10.0% American487 9.8% Italian470 9.5% English442 8.9% Irish180 3.6% Scottish126 2.5% Scotch-Irish106 2.1% European102 2.1% Jamaican100 2.0% Eastern European67 1.3% Russian58 1.2% Swedish55 1.1% Hungarian53 1.1% Greek45 0.9% Polish42 0.8% French40 0.8% Swiss28 0.6% Czech21 0.4% British21 0.4% Guyanese19 0.4% Cajun18 0.4% Lithuanian17 0.3% Brazilian17 0.3% Norwegian16 0.3% Scandinavian14 0.3% Latvian14 0.3% West Indian10 0.2% Dutch7 0.1% Northern European
Children Nativity (place of birth) in Viera East
Children under 6 years - Living with two parents Both parents native 1,096 100.0% NativeOne native, one foreign-born parent 39 100.0% NativeChildren under 6 years - Living with one parent Native parent 30 100.0% NativeChildren 6 to 17 years - Living with two parents Both parents native 1,219 93.4% Native86 6.6% Foreign-bornBoth parents foreign-born 106 65.4% Native56 34.6% Foreign-bornOne native, one foreign-born parent 96 100.0% NativeChildren 6 to 17 years - Living with one parent Native parent 179 100.0% NativeForeign-born parent 51 52.7% Native46 47.3% Foreign-born
Grandparents responsible for own grandchildren in Viera East
Grandparents (30 to 59 years) White / Caucasian 8 100.0% Not responsible for grandchildrenAsian 6 100.0% Not responsible for grandchildrenWhite alone, not Hispanic / Latino 7 100.0% Not responsible for grandchildren
Grandparents (60 years and over) White / Caucasian 11 100.0% Not responsible for grandchildrenWhite alone, not Hispanic / Latino 10 100.0% Not responsible for grandchildren