Races in Vero Beach South, Florida (FL) Detailed Stats
Data:
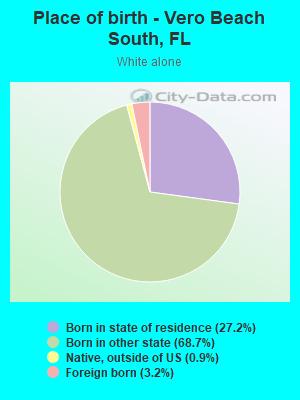
Races - White alone (%)
Races - White alone (% change since 2000)
Races - Black alone (%)
Races - Black alone (% change since 2000)
Races - American Indian alone (%)
Races - American Indian alone (% change since 2000)
Races - Asian alone (%)
Races - Asian alone (% change since 2000)
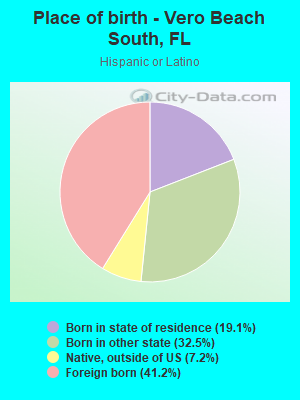
Races - Hispanic (%)
Races - Hispanic (% change since 2000)
Races - Native Hawaiian and Other Pacific Islander alone (%)
Races - Native Hawaiian and Other Pacific Islander alone (% change since 2000)
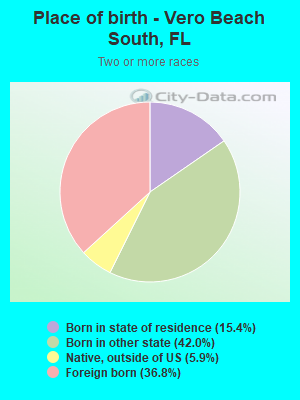
Races - Two or more races(%)
Races - Two or more races(% change since 2000)
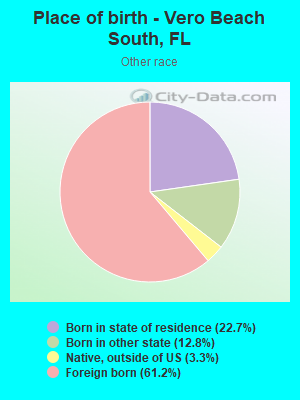
Races - Other race alone (%)
Races - Other race alone (% change since 2000)
Racial diversity
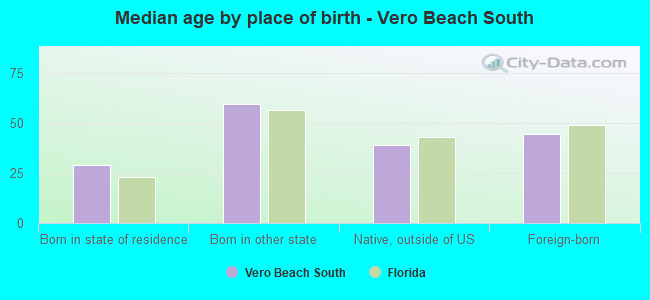
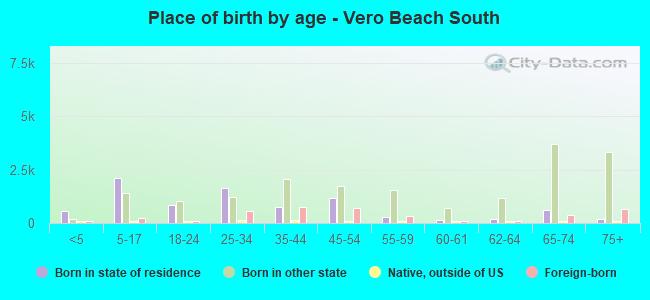
Place of birth - Born in state of residence (%)
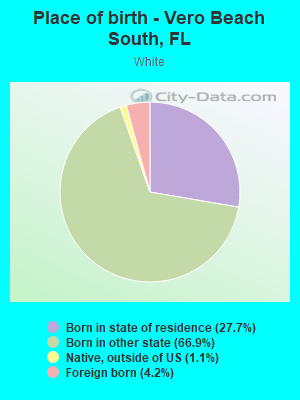
Place of birth - Born in state of residence (%) - White
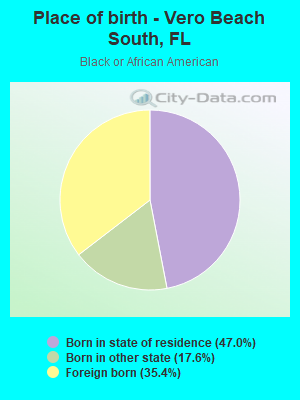
Place of birth - Born in state of residence (%) - Black or African American
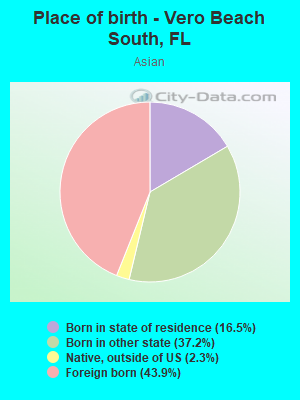
Place of birth - Born in state of residence (%) - Asian
Place of birth - Born in state of residence (%) - Hispanic or Latino
Place of birth - Born in state of residence (%) - American Indian and Alaska Native
Place of birth - Born in state of residence (%) - Multirace
Place of birth - Born in state of residence (%) - Other Race
Place of birth - Born in other state (%)
Place of birth - Born in other state (%) - White
Place of birth - Born in other state (%) - Black or African American
Place of birth - Born in other state (%) - Asian
Place of birth - Born in other state (%) - Hispanic or Latino
Place of birth - Born in other state (%) - American Indian and Alaska Native
Place of birth - Born in other state (%) - Multirace
Place of birth - Born in other state (%) - Other Race
Place of birth - Native, outside of US (%)
Place of birth - Native, outside of US (%) - White
Place of birth - Native, outside of US (%) - Black or African American
Place of birth - Native, outside of US (%) - Asian
Place of birth - Native, outside of US (%) - Hispanic or Latino
Place of birth - Native, outside of US (%) - American Indian and Alaska Native
Place of birth - Native, outside of US (%) - Multirace
Place of birth - Native, outside of US (%) - Other Race
Place of birth - Foreign born (%)
Place of birth - Foreign born (%) - White
Place of birth - Foreign born (%) - Black or African American
Place of birth - Foreign born (%) - Asian
Place of birth - Foreign born (%) - Hispanic or Latino
Place of birth - Foreign born (%) - American Indian and Alaska Native
Place of birth - Foreign born (%) - Multirace
Place of birth - Foreign born (%) - Other Race
Residents speaking English at home (%)
Residents speaking English at home - Born in the United States (%)
Residents speaking English at home - Native, born elsewhere (%)
Residents speaking English at home - Foreign born (%)
Residents speaking Spanish at home (%)
Residents speaking Spanish at home - Born in the United States (%)
Residents speaking Spanish at home - Native, born elsewhere (%)
Residents speaking Spanish at home - Foreign born (%)
Residents speaking other language at home (%)
Residents speaking other language at home - Born in the United States (%)
Residents speaking other language at home - Native, born elsewhere (%)
Residents speaking other language at home - Foreign born (%)
Marital status - Never married (%)
Marital status - Now married (%)
Marital status - Separated (%)
Marital status - Widowed (%)
Marital status - Divorced (%)
Ancestries Reported - Arab (%)
Ancestries Reported - Czech (%)
Ancestries Reported - Danish (%)
Ancestries Reported - Dutch (%)
Ancestries Reported - English (%)
Ancestries Reported - French (%)
Ancestries Reported - French Canadian (%)
Ancestries Reported - German (%)
Ancestries Reported - Greek (%)
Ancestries Reported - Hungarian (%)
Ancestries Reported - Irish (%)
Ancestries Reported - Italian (%)
Ancestries Reported - Lithuanian (%)
Ancestries Reported - Norwegian (%)
Ancestries Reported - Polish (%)
Ancestries Reported - Portuguese (%)
Ancestries Reported - Russian (%)
Ancestries Reported - Scotch-Irish (%)
Ancestries Reported - Scottish (%)
Ancestries Reported - Slovak (%)
Ancestries Reported - Subsaharan African (%)
Ancestries Reported - Swedish (%)
Ancestries Reported - Swiss (%)
Ancestries Reported - Ukrainian (%)
Ancestries Reported - United States (%)
Ancestries Reported - Welsh (%)
Ancestries Reported - West Indian (%)
Ancestries Reported - Other (%)
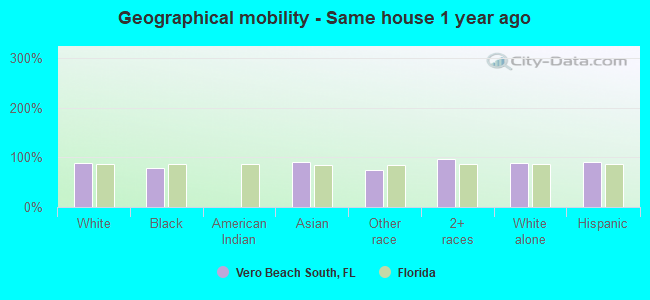
Geographical mobility - Same house 1 year ago (%)
Geographical mobility - Same house 1 year ago (%) - White
Geographical mobility - Same house 1 year ago (%) - Black or African American
Geographical mobility - Same house 1 year ago (%) - Asian
Geographical mobility - Same house 1 year ago (%) - Hispanic or Latino
Geographical mobility - Same house 1 year ago (%) - American Indian and Alaska Native
Geographical mobility - Same house 1 year ago (%) - Multirace
Geographical mobility - Same house 1 year ago (%) - Other Race
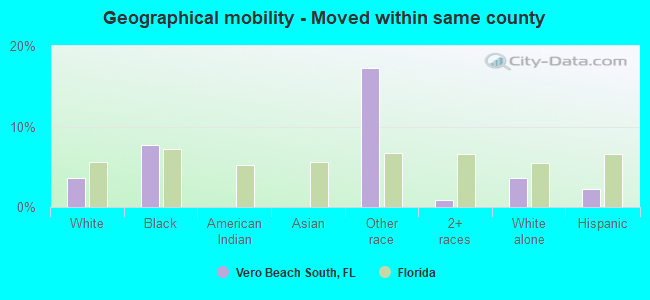
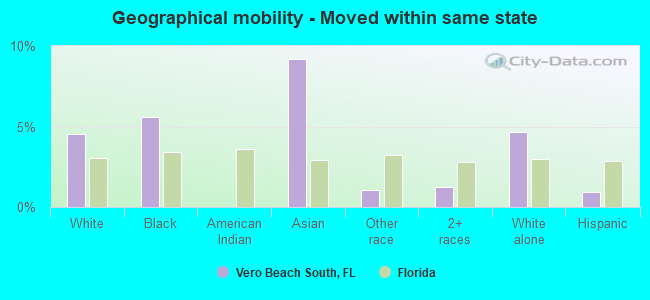
Geographical mobility - Moved within same county (%)
Geographical mobility - Moved within same county (%) - White
Geographical mobility - Moved within same county (%) - Black or African American
Geographical mobility - Moved within same county (%) - Asian
Geographical mobility - Moved within same county (%) - Hispanic or Latino
Geographical mobility - Moved within same county (%) - American Indian and Alaska Native
Geographical mobility - Moved within same county (%) - Multirace
Geographical mobility - Moved within same county (%) - Other Race
Geographical mobility - Moved from different county within same state (%)
Geographical mobility - Moved from different county within same state (%) - White
Geographical mobility - Moved from different county within same state (%) - Black or African American
Geographical mobility - Moved from different county within same state (%) - Asian
Geographical mobility - Moved from different county within same state (%) - Hispanic or Latino
Geographical mobility - Moved from different county within same state (%) - American Indian and Alaska Native
Geographical mobility - Moved from different county within same state (%) - Multirace
Geographical mobility - Moved from different county within same state (%) - Other Race
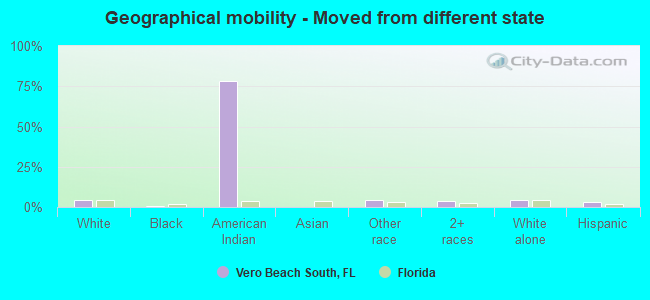
Geographical mobility - Moved from different state (%)
Geographical mobility - Moved from different state (%) - White
Geographical mobility - Moved from different state (%) - Black or African American
Geographical mobility - Moved from different state (%) - Asian
Geographical mobility - Moved from different state (%) - Hispanic or Latino
Geographical mobility - Moved from different state (%) - American Indian and Alaska Native
Geographical mobility - Moved from different state (%) - Multirace
Geographical mobility - Moved from different state (%) - Other Race
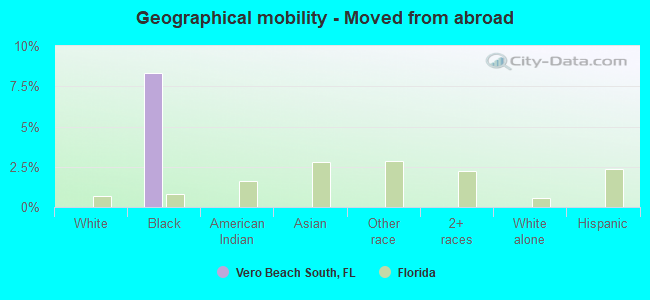
Geographical mobility - Moved from abroad (%)
Geographical mobility - Moved from abroad (%) - White
Geographical mobility - Moved from abroad (%) - Black or African American
Geographical mobility - Moved from abroad (%) - Asian
Geographical mobility - Moved from abroad (%) - Hispanic or Latino
Geographical mobility - Moved from abroad (%) - American Indian and Alaska Native
Geographical mobility - Moved from abroad (%) - Multirace
Geographical mobility - Moved from abroad (%) - Other Race
Place of birth for the foreign-born population - Ireland (%)
Place of birth for the foreign-born population - Denmark (%)
Place of birth for the foreign-born population - Norway (%)
Place of birth for the foreign-born population - Sweden (%)
Place of birth for the foreign-born population - United Kingdom (%)
Place of birth for the foreign-born population - England (%)
Place of birth for the foreign-born population - Scotland (%)
Place of birth for the foreign-born population - Other Northern Europe (%)
Place of birth for the foreign-born population - Austria (%)
Place of birth for the foreign-born population - Belgium (%)
Place of birth for the foreign-born population - France (%)
Place of birth for the foreign-born population - Germany (%)
Place of birth for the foreign-born population - Netherlands (%)
Place of birth for the foreign-born population - Switzerland (%)
Place of birth for the foreign-born population - Other Western Europe (%)
Place of birth for the foreign-born population - Greece (%)
Place of birth for the foreign-born population - Italy (%)
Place of birth for the foreign-born population - Portugal (%)
Place of birth for the foreign-born population - Spain (%)
Place of birth for the foreign-born population - Other Southern Europe (%)
Place of birth for the foreign-born population - Albania (%)
Place of birth for the foreign-born population - Belarus (%)
Place of birth for the foreign-born population - Bosnia and Herzegovina (%)
Place of birth for the foreign-born population - Bulgaria (%)
Place of birth for the foreign-born population - Croatia (%)
Place of birth for the foreign-born population - Czechoslovakia (%)
Place of birth for the foreign-born population - Hungary (%)
Place of birth for the foreign-born population - Latvia (%)
Place of birth for the foreign-born population - Lithuania (%)
Place of birth for the foreign-born population - North Macedonia (Macedonia) (%)
Place of birth for the foreign-born population - Moldova (%)
Place of birth for the foreign-born population - Poland (%)
Place of birth for the foreign-born population - Romania (%)
Place of birth for the foreign-born population - Russia (%)
Place of birth for the foreign-born population - Serbia (%)
Place of birth for the foreign-born population - Ukraine (%)
Place of birth for the foreign-born population - Other Eastern Europe (%)
Place of birth for the foreign-born population - China (%)
Place of birth for the foreign-born population - Hong Kong (%)
Place of birth for the foreign-born population - Taiwan (%)
Place of birth for the foreign-born population - Japan (%)
Place of birth for the foreign-born population - Korea (%)
Place of birth for the foreign-born population - Other Eastern Asia (%)
Place of birth for the foreign-born population - Afghanistan (%)
Place of birth for the foreign-born population - Bangladesh (%)
Place of birth for the foreign-born population - India (%)
Place of birth for the foreign-born population - Iran (%)
Place of birth for the foreign-born population - Kazakhstan (%)
Place of birth for the foreign-born population - Nepal (%)
Place of birth for the foreign-born population - Pakistan (%)
Place of birth for the foreign-born population - Sri Lanka (%)
Place of birth for the foreign-born population - Uzbekistan (%)
Place of birth for the foreign-born population - Other South Central Asia (%)
Place of birth for the foreign-born population - Burma (%)
Place of birth for the foreign-born population - Cambodia (%)
Place of birth for the foreign-born population - Indonesia (%)
Place of birth for the foreign-born population - Laos (%)
Place of birth for the foreign-born population - Malaysia (%)
Place of birth for the foreign-born population - Philippines (%)
Place of birth for the foreign-born population - Singapore (%)
Place of birth for the foreign-born population - Thailand (%)
Place of birth for the foreign-born population - Vietnam (%)
Place of birth for the foreign-born population - Other South Eastern Asia (%)
Place of birth for the foreign-born population - Armenia (%)
Place of birth for the foreign-born population - Iraq (%)
Place of birth for the foreign-born population - Israel (%)
Place of birth for the foreign-born population - Jordan (%)
Place of birth for the foreign-born population - Kuwait (%)
Place of birth for the foreign-born population - Lebanon (%)
Place of birth for the foreign-born population - Saudi Arabia (%)
Place of birth for the foreign-born population - Syria (%)
Place of birth for the foreign-born population - Turkey (%)
Place of birth for the foreign-born population - Yemen (%)
Place of birth for the foreign-born population - Other Western Asia (%)
Place of birth for the foreign-born population - Eritrea (%)
Place of birth for the foreign-born population - Ethiopia (%)
Place of birth for the foreign-born population - Kenya (%)
Place of birth for the foreign-born population - Somalia (%)
Place of birth for the foreign-born population - Uganda (%)
Place of birth for the foreign-born population - Zimbabwe (%)
Place of birth for the foreign-born population - Other Eastern Africa (%)
Place of birth for the foreign-born population - Cameroon (%)
Place of birth for the foreign-born population - Congo (%)
Place of birth for the foreign-born population - Democratic Republic of Congo (Zaire) (%)
Place of birth for the foreign-born population - Other Middle Africa (%)
Place of birth for the foreign-born population - Egypt (%)
Place of birth for the foreign-born population - Morocco (%)
Place of birth for the foreign-born population - Sudan (%)
Place of birth for the foreign-born population - Other Northern Africa (%)
Place of birth for the foreign-born population - South Africa (%)
Place of birth for the foreign-born population - Other Southern Africa (%)
Place of birth for the foreign-born population - Cabo Verde (%)
Place of birth for the foreign-born population - Ghana (%)
Place of birth for the foreign-born population - Liberia (%)
Place of birth for the foreign-born population - Nigeria (%)
Place of birth for the foreign-born population - Senegal (%)
Place of birth for the foreign-born population - Sierra Leone (%)
Place of birth for the foreign-born population - Other Western Africa (%)
Place of birth for the foreign-born population - Australia (%)
Place of birth for the foreign-born population - New Zealand (%)
Place of birth for the foreign-born population - Fiji (%)
Place of birth for the foreign-born population - Micronesia (%)
Place of birth for the foreign-born population - Bahamas (%)
Place of birth for the foreign-born population - Barbados (%)
Place of birth for the foreign-born population - Cuba (%)
Place of birth for the foreign-born population - Dominica (%)
Place of birth for the foreign-born population - Dominican Republic (%)
Place of birth for the foreign-born population - Grenada (%)
Place of birth for the foreign-born population - Haiti (%)
Place of birth for the foreign-born population - Jamaica (%)
Place of birth for the foreign-born population - St. Vincent and the Grenadines (%)
Place of birth for the foreign-born population - Trinidad and Tobago (%)
Place of birth for the foreign-born population - West Indies (%)
Place of birth for the foreign-born population - Other Caribbean (%)
Place of birth for the foreign-born population - Belize (%)
Place of birth for the foreign-born population - Costa Rica (%)
Place of birth for the foreign-born population - El Salvador (%)
Place of birth for the foreign-born population - Guatemala (%)
Place of birth for the foreign-born population - Honduras (%)
Place of birth for the foreign-born population - Mexico (%)
Place of birth for the foreign-born population - Nicaragua (%)
Place of birth for the foreign-born population - Panama (%)
Place of birth for the foreign-born population - Other Central America (%)
Place of birth for the foreign-born population - Argentina (%)
Place of birth for the foreign-born population - Bolivia (%)
Place of birth for the foreign-born population - Brazil (%)
Place of birth for the foreign-born population - Chile (%)
Place of birth for the foreign-born population - Colombia (%)
Place of birth for the foreign-born population - Ecuador (%)
Place of birth for the foreign-born population - Guyana (%)
Place of birth for the foreign-born population - Peru (%)
Place of birth for the foreign-born population - Uruguay (%)
Place of birth for the foreign-born population - Venezuela (%)
Place of birth for the foreign-born population - Other South America (%)
Place of birth for the foreign-born population - Canada (%)
Place of birth for the foreign-born population - Other Northern America (%)
Place of birth for the foreign-born population - Other (%)
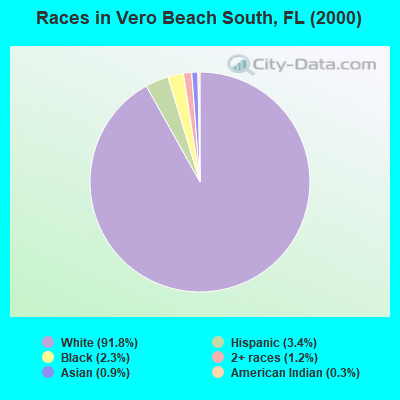
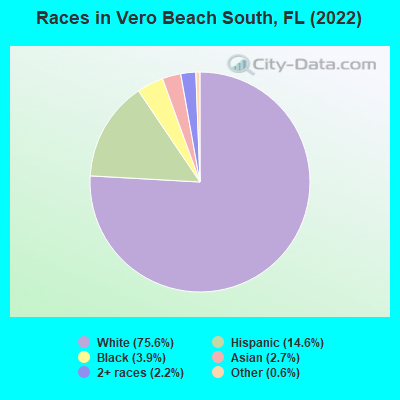
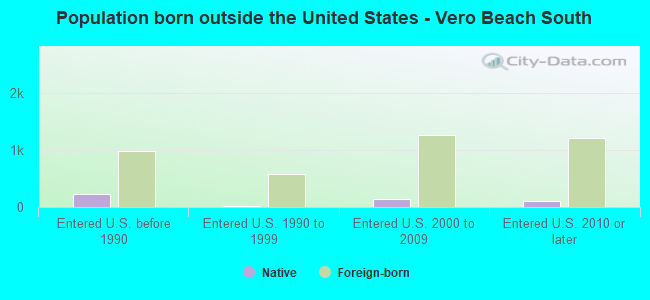
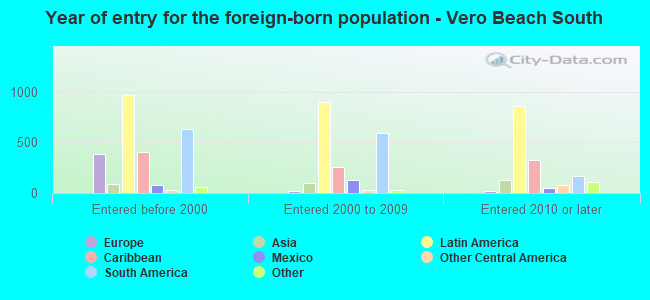
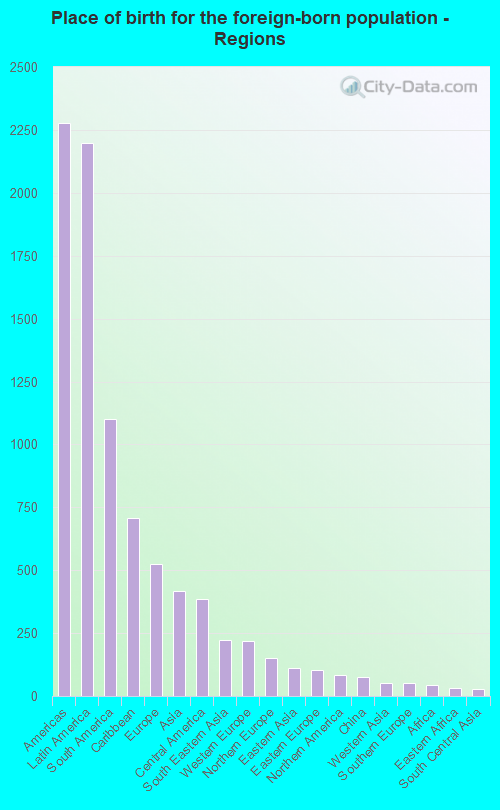
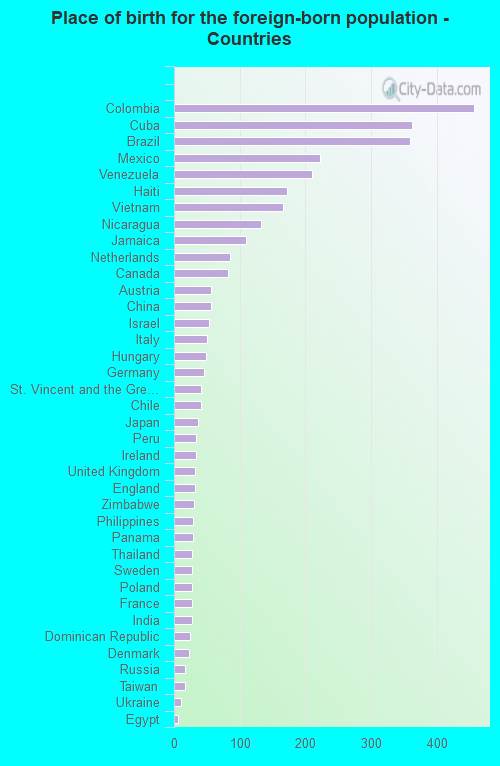
According to 2022 data, the most numerous races in Vero Beach South, FL are White alone (23,534 residents), Hispanic (4,551 residents), and Black alone (1,205 residents). 84.3% of Vero Beach South residents speak English at home. 10.5% of Vero Beach South, FL residents are foreign-born (7.0% born in Latin America, 1.7% born in Europe, 1.3% born in Asia), which is 100.5% less than the foreign-born rate of 21.0% across the entire state of Florida.
Race distribution in Vero Beach South
2000 2022
10,458,509 65.4% White alone 2,682,715 16.8% Hispanic 2,264,268 14.2% Black alone 261,693 1.6% Asian alone 236,954 1.5% Two or more races 42,358 0.3% American Indian alone 28,994 0.2% Other race alone 6,887 0.04% Native Hawaiian and Other
11,309,403 50.8% White alone 6,025,039 27.1% Hispanic 3,241,015 14.6% Black alone 861,630 3.9% Two or more races 623,692 2.8% Asian alone 152,054 0.7% Other race alone 22,504 0.1% American Indian alone 9,486 0.04% Native Hawaiian and Other
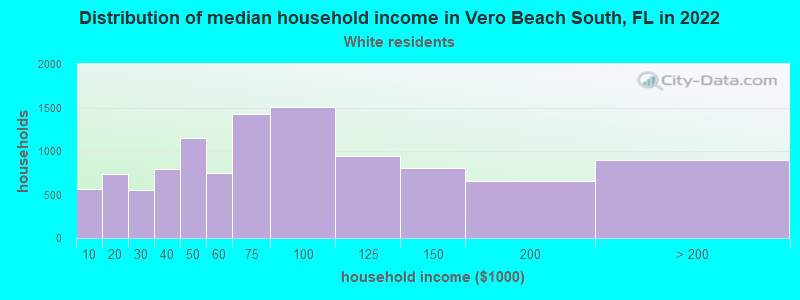
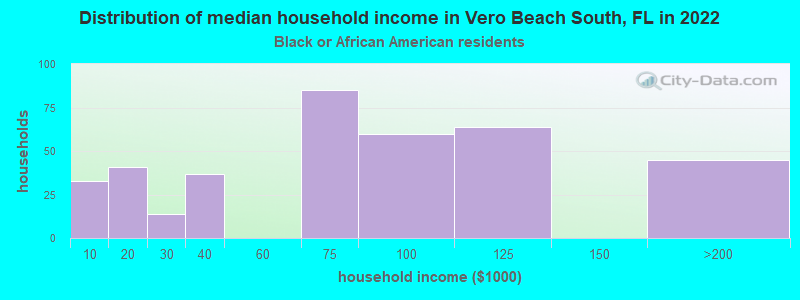
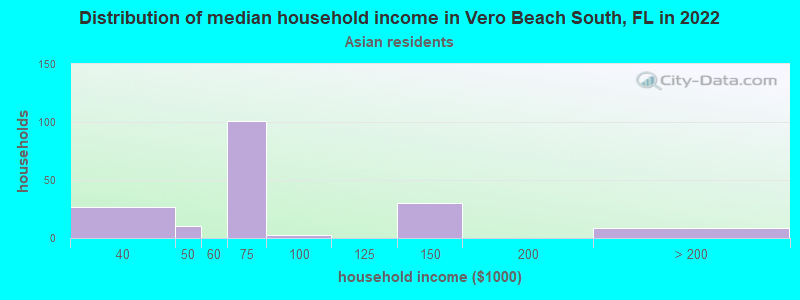
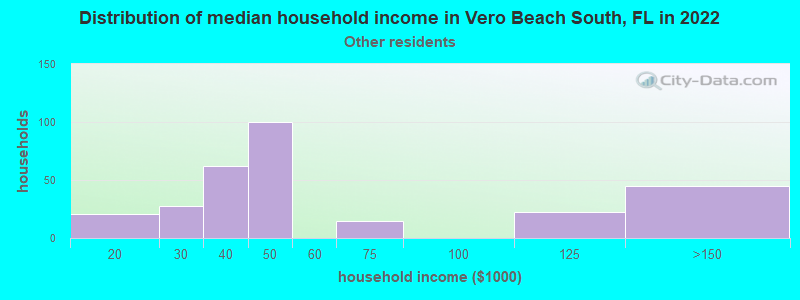
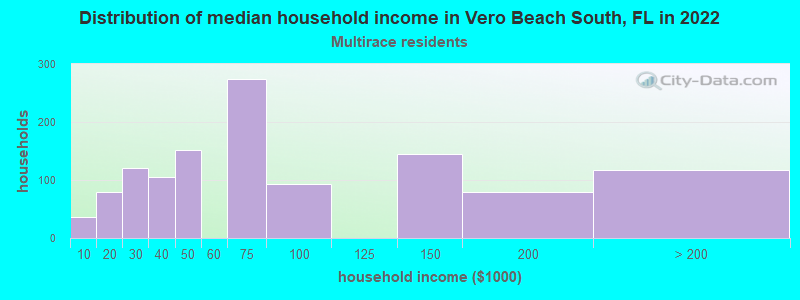
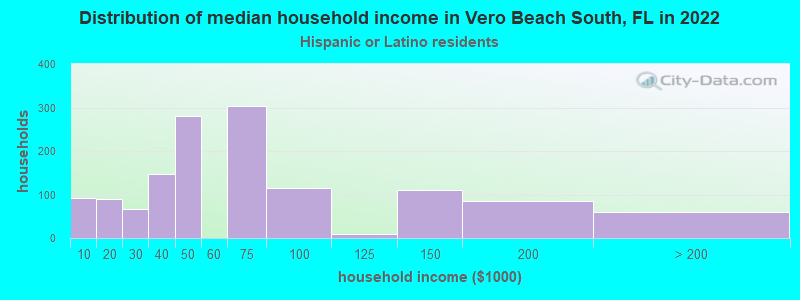
Income and house value in Vero Beach South Median household income in 2022 $70,655 White non-Hispanic householders$67,835 Black householders$63,278 Asian householders$62,265 Some other race householders$64,764 Two or more races householders$54,810 Hispanic or Latino race householdersMedian 2022 house value $359,427 White Non-Hispanic householders$214,395 Black or African American householders$510,024 American Indian or Alaska Native householders $299,708 Asian householders$370,926 Some other race householders$510,024 Two or more races householders$359,057 Hispanic or Latino householders
Median age by race in Vero Beach South
55.7 Median age for White residents51.7 59.3 34.4 Median age for Black or African American residents25.9 35.0 -598,566,307.6 Median age for American Indian / Alaska Native residents-611,418,047.3 -594,925,633.7 23.7 Median age for Asian residents19.2 22.3 -666,666,666.0 Median age for Native Hawaiian / Pacific Islander residents-666,666,666.0 -666,666,666.0 39.9 Median age for Other race residents25.2 41.0 38.1 Median age for Two or more races residents37.0 35.5 57.4 Median age for White alone residents52.7 59.5 31.9 Median age for Hispanic or Latino residents28.0 34.9
Owner/renter occupied households by race in Vero Beach South
House owners and renters - White residents 9,141 84.1% Owner occupied1,732 15.9% Renter occupiedHouse owners and renters - Black or African American residents 161 39.0% Owner occupied251 61.0% Renter occupiedHouse owners and renters - Asian residents 174 86.6% Owner occupied27 13.4% Renter occupiedHouse owners and renters - Other race residents 28 10.6% Owner occupied238 89.4% Renter occupiedHouse owners and renters - Two or more races residents 659 68.5% Owner occupied303 31.5% Renter occupiedHouse owners and renters - White alone residents 8,910 84.9% Owner occupied1,580 15.1% Renter occupiedHouse owners and renters - Hispanic or Latino residents 857 64.4% Owner occupied474 35.6% Renter occupied
Language usage in Vero Beach South
English speakers - Total 84.3% of residents of Vero Beach South speak English at home.
9.6% of residents speak Spanish at home 1,756 60.6% Speak English very well1,143 39.4% Speak English less than very well6.2% of residents speak other language at home 1,078 57.1% Speak English very well809 42.9% Speak English less than very well
English speakers - Born in the United States 96.0% of residents of Vero Beach South speak English at home.
3.1% of residents speak Spanish at home 382 67.9% Speak English very well181 32.1% Speak English less than very well1.2% of residents speak other language at home 181 80.4% Speak English very well44 19.6% Speak English less than very well
English speakers - Native, born elsewhere 62.5% of residents of Vero Beach South speak English at home.
39.6% of residents speak Spanish at home 134 58.5% Speak English very well95 41.5% Speak English less than very well5.0% of residents speak other language at home 29 100.0% Speak English very well
English speakers - Foreign-born 23.7% of residents of Vero Beach South speak English at home.
42.2% of residents speak Spanish at home 797 48.0% Speak English very well864 52.0% Speak English less than very well33.0% of residents speak other language at home 569 43.8% Speak English very well729 56.2% Speak English less than very well
White (Caucasian) - Speak only English Native:
97.1% (22,012)Foreign-born:
37.6% (386)
White (Caucasian) - Speak another language Native:
3.0% (679)Foreign-born:
57.5% (590)
Black or African American - Speak only English Native:
94.0% (787)Foreign-born:
95.0% (441)
Asian - Speak only English Native:
70.6% (242)Foreign-born:
29.7% (97)
Asian - Speak another language Native:
29.7% (102)Foreign-born:
70.1% (229)
Other race - Speak only English Native:
28.5% (161)Foreign-born:
6.9% (55)
Other race - Speak another language Native:
73.9% (418)Foreign-born:
90.6% (722)
Two or more races - Speak only English Native:
70.8% (1,469)Foreign-born:
4.9% (61)
Two or more races - Speak another language Native:
29.4% (610)Foreign-born:
95.1% (1,188)
White alone - Speak only English Native:
97.7% (21,660)Foreign-born:
54.0% (405)
White alone - Speak another language Native:
2.3% (510)Foreign-born:
42.7% (320)
Hispanic or Latino - Speak only English Native:
58.4% (1,422)Foreign-born:
2.5% (45)
Hispanic or Latino - Speak another language Native:
43.4% (1,056)Foreign-born:
98.0% (1,777)
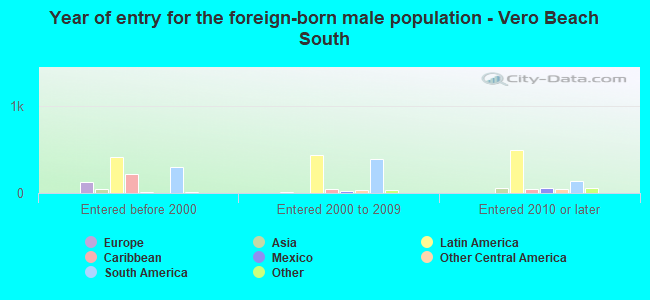
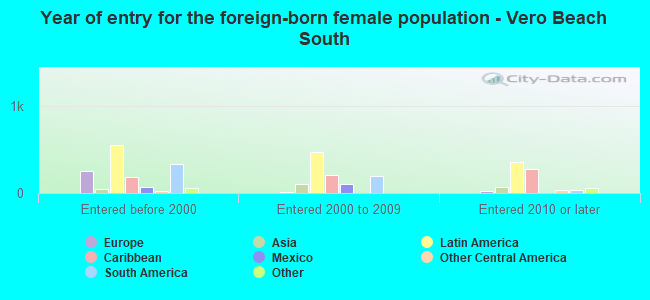
Foreign-born residents in Vero Beach South 3,263 residents are foreign born (7.0% Latin America , 1.7% Europe , 1.3% Asia ).
This city:
10.5%Florida:
21.1%
Marital status for residents in Vero Beach South Marital status - White (Caucasian) population 15 years and over
Males 32.4% Never married53.9% Now married1.1% Separated2.5% Widowed10.1% DivorcedFemales 18.9% Never married51.6% Now married0.9% Separated12.6% Widowed16.0% DivorcedWomen who gave birth in the past 12 months Now married:
90.0% (203)Unmarried:
10.0% (22)
Women who did not give birth in the past 12 months Now married:
48.3% (1,806)Unmarried:
51.7% (1,933)
Marital status - Black or African American population 15 years and over
Males 6.7% Never married77.3% Now married0.0% Separated0.0% Widowed16.0% DivorcedFemales 61.4% Never married27.6% Now married0.0% Separated0.0% Widowed11.0% DivorcedWomen who did not give birth in the past 12 months Now married:
22.8% (90)Unmarried:
77.2% (305)
Marital status - Asian population 15 years and over
Males 16.2% Never married78.4% Now married0.0% Separated5.4% Widowed0.0% DivorcedFemales 50.8% Never married43.8% Now married0.0% Separated3.3% Widowed2.2% DivorcedWomen who did not give birth in the past 12 months Now married:
36.1% (114)Unmarried:
63.9% (202)
Marital status - Other race population 15 years and over
Males 26.3% Never married48.7% Now married25.0% Separated0.0% Widowed0.0% DivorcedFemales 24.9% Never married58.3% Now married0.0% Separated0.0% Widowed16.9% DivorcedWomen who gave birth in the past 12 months Now married:
100.0% (122)Unmarried:
0.0% (0)
Women who did not give birth in the past 12 months Now married:
32.7% (119)Unmarried:
67.3% (245)
Marital status - Two or more races population 15 years and over
Males 46.9% Never married40.8% Now married0.0% Separated0.0% Widowed12.3% DivorcedFemales 37.5% Never married34.2% Now married0.0% Separated4.5% Widowed23.8% DivorcedWomen who gave birth in the past 12 months Now married:
34.5% (15)Unmarried:
65.5% (29)
Women who did not give birth in the past 12 months Now married:
32.0% (271)Unmarried:
68.0% (576)
Marital status - White alone, not Hispanic / Latino population 15 years and over
Males 31.7% Never married54.1% Now married1.2% Separated2.7% Widowed10.3% DivorcedFemales 18.9% Never married51.1% Now married0.7% Separated13.1% Widowed16.2% DivorcedWomen who gave birth in the past 12 months Now married:
88.9% (180)Unmarried:
11.1% (23)
Women who did not give birth in the past 12 months Now married:
47.1% (1,653)Unmarried:
52.9% (1,859)
Marital status - Hispanic or Latino population 15 years and over
Males 43.2% Never married49.3% Now married0.0% Separated0.0% Widowed7.5% DivorcedFemales 19.6% Never married55.9% Now married1.5% Separated1.5% Widowed21.5% DivorcedWomen who gave birth in the past 12 months Now married:
86.2% (127)Unmarried:
13.8% (20)
Women who did not give birth in the past 12 months Now married:
55.4% (384)Unmarried:
44.6% (310)
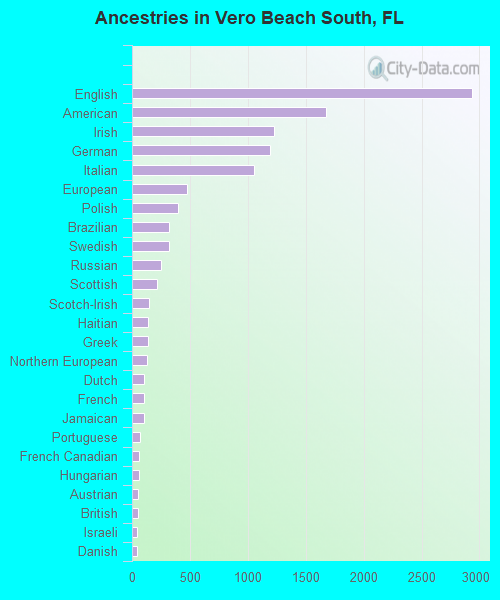
Ancestries in Vero Beach South
2,936 18.6% English1,675 10.6% American1,227 7.8% Irish1,192 7.6% German1,056 6.7% Italian479 3.0% European398 2.5% Polish323 2.0% Brazilian323 2.0% Swedish252 1.6% Russian216 1.4% Scottish149 0.9% Scotch-Irish140 0.9% Haitian139 0.9% Greek126 0.8% Northern European107 0.7% Dutch105 0.7% French101 0.6% Jamaican72 0.5% Portuguese63 0.4% French Canadian58 0.4% Hungarian55 0.3% Austrian55 0.3% British43 0.3% Israeli42 0.3% Danish37 0.2% Albanian37 0.2% Slovak32 0.2% Norwegian32 0.2% Cape Verdean30 0.2% Czech28 0.2% Swiss23 0.1% Armenian20 0.1% African19 0.1% Celtic18 0.1% Czechoslovakian16 0.1% Lebanese11 0.07% Croatian10 0.06% Eastern European10 0.06% Ukrainian8 0.05% Belgian8 0.05% Lithuanian7 0.04% Canadian7 0.04% Scandinavian4 0.03% Pennsylvania German
Geographical mobility in Vero Beach South Same house 1 year ago 21,177 87.8% White (Caucasian)893 78.6% Black or African American672 91.4% Asian1,277 74.8% Other race3,306 96.4% Two or more races20,478 87.6% White alone, not Hispanic / Latino4,010 90.4% Hispanic or LatinoMoved within same county 865 3.6% White / Caucasian87 7.7% Black or African American294 17.2% Other race31 0.9% Two or more races851 3.6% White alone, not Hispanic / Latino97 2.2% Hispanic or LatinoMoved within same state 1,093 4.5% White / Caucasian64 5.6% Black or African American67 9.2% Asian18 1.1% Other race42 1.2% Two or more races1,094 4.7% White alone, not Hispanic / Latino41 0.9% Hispanic or LatinoMoved from different state 982 4.1% White / Caucasian11 0.9% Black or African American7 78.3% American Indian / Alaska Native73 4.3% Other race138 4.0% Two or more races947 4.0% White alone, not Hispanic / Latino130 2.9% Hispanic or LatinoMoved from abroad 95 8.3% Black or African American
Children Nativity (place of birth) in Vero Beach South
Children under 6 years - Living with two parents Both parents native 410 100.0% NativeBoth parents foreign-born 220 88.6% Native28 11.4% Foreign-bornOne native, one foreign-born parent 125 100.0% NativeChildren under 6 years - Living with one parent Native parent 437 100.0% NativeForeign-born parent 83 100.0% NativeChildren 6 to 17 years - Living with two parents Both parents native 929 100.0% NativeBoth parents foreign-born 542 92.1% Native47 7.9% Foreign-bornOne native, one foreign-born parent 189 100.0% NativeChildren 6 to 17 years - Living with one parent Native parent 727 100.0% NativeForeign-born parent 371 50.5% Native363 49.5% Foreign-born
Grandparents responsible for own grandchildren in Vero Beach South
Grandparents (30 to 59 years) White / Caucasian 31 17.2% Responsible for grandchildren148 82.8% Not responsible for grandchildrenBlack or African American 11 100.0% Not responsible for grandchildrenTwo or more races 62 100.0% Not responsible for grandchildrenWhite alone, not Hispanic / Latino 51 25.6% Responsible for grandchildren148 74.4% Not responsible for grandchildrenHispanic or Latino 29 100.0% Not responsible for grandchildrenGrandparents (60 years and over) White / Caucasian 116 20.1% Responsible for grandchildren462 79.9% Not responsible for grandchildrenBlack or African American 17 100.0% Responsible for grandchildrenTwo or more races 77 100.0% Not responsible for grandchildrenWhite alone, not Hispanic / Latino 127 21.1% Responsible for grandchildren475 78.9% Not responsible for grandchildrenHispanic or Latino 45 100.0% Not responsible for grandchildren