Races in Venice, Florida (FL) Detailed Stats
Data:
Races - White alone (%)
Races - White alone (% change since 2000)
Races - Black alone (%)
Races - Black alone (% change since 2000)
Races - American Indian alone (%)
Races - American Indian alone (% change since 2000)
Races - Asian alone (%)
Races - Asian alone (% change since 2000)
Races - Hispanic (%)
Races - Hispanic (% change since 2000)
Races - Native Hawaiian and Other Pacific Islander alone (%)
Races - Native Hawaiian and Other Pacific Islander alone (% change since 2000)
Races - Two or more races(%)
Races - Two or more races(% change since 2000)
Races - Other race alone (%)
Races - Other race alone (% change since 2000)
Racial diversity
Place of birth - Born in state of residence (%)
Place of birth - Born in state of residence (%) - White
Place of birth - Born in state of residence (%) - Black or African American
Place of birth - Born in state of residence (%) - Asian
Place of birth - Born in state of residence (%) - Hispanic or Latino
Place of birth - Born in state of residence (%) - American Indian and Alaska Native
Place of birth - Born in state of residence (%) - Multirace
Place of birth - Born in state of residence (%) - Other Race
Place of birth - Born in other state (%)
Place of birth - Born in other state (%) - White
Place of birth - Born in other state (%) - Black or African American
Place of birth - Born in other state (%) - Asian
Place of birth - Born in other state (%) - Hispanic or Latino
Place of birth - Born in other state (%) - American Indian and Alaska Native
Place of birth - Born in other state (%) - Multirace
Place of birth - Born in other state (%) - Other Race
Place of birth - Native, outside of US (%)
Place of birth - Native, outside of US (%) - White
Place of birth - Native, outside of US (%) - Black or African American
Place of birth - Native, outside of US (%) - Asian
Place of birth - Native, outside of US (%) - Hispanic or Latino
Place of birth - Native, outside of US (%) - American Indian and Alaska Native
Place of birth - Native, outside of US (%) - Multirace
Place of birth - Native, outside of US (%) - Other Race
Place of birth - Foreign born (%)
Place of birth - Foreign born (%) - White
Place of birth - Foreign born (%) - Black or African American
Place of birth - Foreign born (%) - Asian
Place of birth - Foreign born (%) - Hispanic or Latino
Place of birth - Foreign born (%) - American Indian and Alaska Native
Place of birth - Foreign born (%) - Multirace
Place of birth - Foreign born (%) - Other Race
Residents speaking English at home (%)
Residents speaking English at home - Born in the United States (%)
Residents speaking English at home - Native, born elsewhere (%)
Residents speaking English at home - Foreign born (%)
Residents speaking Spanish at home (%)
Residents speaking Spanish at home - Born in the United States (%)
Residents speaking Spanish at home - Native, born elsewhere (%)
Residents speaking Spanish at home - Foreign born (%)
Residents speaking other language at home (%)
Residents speaking other language at home - Born in the United States (%)
Residents speaking other language at home - Native, born elsewhere (%)
Residents speaking other language at home - Foreign born (%)
Marital status - Never married (%)
Marital status - Now married (%)
Marital status - Separated (%)
Marital status - Widowed (%)
Marital status - Divorced (%)
Ancestries Reported - Arab (%)
Ancestries Reported - Czech (%)
Ancestries Reported - Danish (%)
Ancestries Reported - Dutch (%)
Ancestries Reported - English (%)
Ancestries Reported - French (%)
Ancestries Reported - French Canadian (%)
Ancestries Reported - German (%)
Ancestries Reported - Greek (%)
Ancestries Reported - Hungarian (%)
Ancestries Reported - Irish (%)
Ancestries Reported - Italian (%)
Ancestries Reported - Lithuanian (%)
Ancestries Reported - Norwegian (%)
Ancestries Reported - Polish (%)
Ancestries Reported - Portuguese (%)
Ancestries Reported - Russian (%)
Ancestries Reported - Scotch-Irish (%)
Ancestries Reported - Scottish (%)
Ancestries Reported - Slovak (%)
Ancestries Reported - Subsaharan African (%)
Ancestries Reported - Swedish (%)
Ancestries Reported - Swiss (%)
Ancestries Reported - Ukrainian (%)
Ancestries Reported - United States (%)
Ancestries Reported - Welsh (%)
Ancestries Reported - West Indian (%)
Ancestries Reported - Other (%)
Geographical mobility - Same house 1 year ago (%)
Geographical mobility - Same house 1 year ago (%) - White
Geographical mobility - Same house 1 year ago (%) - Black or African American
Geographical mobility - Same house 1 year ago (%) - Asian
Geographical mobility - Same house 1 year ago (%) - Hispanic or Latino
Geographical mobility - Same house 1 year ago (%) - American Indian and Alaska Native
Geographical mobility - Same house 1 year ago (%) - Multirace
Geographical mobility - Same house 1 year ago (%) - Other Race
Geographical mobility - Moved within same county (%)
Geographical mobility - Moved within same county (%) - White
Geographical mobility - Moved within same county (%) - Black or African American
Geographical mobility - Moved within same county (%) - Asian
Geographical mobility - Moved within same county (%) - Hispanic or Latino
Geographical mobility - Moved within same county (%) - American Indian and Alaska Native
Geographical mobility - Moved within same county (%) - Multirace
Geographical mobility - Moved within same county (%) - Other Race
Geographical mobility - Moved from different county within same state (%)
Geographical mobility - Moved from different county within same state (%) - White
Geographical mobility - Moved from different county within same state (%) - Black or African American
Geographical mobility - Moved from different county within same state (%) - Asian
Geographical mobility - Moved from different county within same state (%) - Hispanic or Latino
Geographical mobility - Moved from different county within same state (%) - American Indian and Alaska Native
Geographical mobility - Moved from different county within same state (%) - Multirace
Geographical mobility - Moved from different county within same state (%) - Other Race
Geographical mobility - Moved from different state (%)
Geographical mobility - Moved from different state (%) - White
Geographical mobility - Moved from different state (%) - Black or African American
Geographical mobility - Moved from different state (%) - Asian
Geographical mobility - Moved from different state (%) - Hispanic or Latino
Geographical mobility - Moved from different state (%) - American Indian and Alaska Native
Geographical mobility - Moved from different state (%) - Multirace
Geographical mobility - Moved from different state (%) - Other Race
Geographical mobility - Moved from abroad (%)
Geographical mobility - Moved from abroad (%) - White
Geographical mobility - Moved from abroad (%) - Black or African American
Geographical mobility - Moved from abroad (%) - Asian
Geographical mobility - Moved from abroad (%) - Hispanic or Latino
Geographical mobility - Moved from abroad (%) - American Indian and Alaska Native
Geographical mobility - Moved from abroad (%) - Multirace
Geographical mobility - Moved from abroad (%) - Other Race
Place of birth for the foreign-born population - Ireland (%)
Place of birth for the foreign-born population - Denmark (%)
Place of birth for the foreign-born population - Norway (%)
Place of birth for the foreign-born population - Sweden (%)
Place of birth for the foreign-born population - United Kingdom (%)
Place of birth for the foreign-born population - England (%)
Place of birth for the foreign-born population - Scotland (%)
Place of birth for the foreign-born population - Other Northern Europe (%)
Place of birth for the foreign-born population - Austria (%)
Place of birth for the foreign-born population - Belgium (%)
Place of birth for the foreign-born population - France (%)
Place of birth for the foreign-born population - Germany (%)
Place of birth for the foreign-born population - Netherlands (%)
Place of birth for the foreign-born population - Switzerland (%)
Place of birth for the foreign-born population - Other Western Europe (%)
Place of birth for the foreign-born population - Greece (%)
Place of birth for the foreign-born population - Italy (%)
Place of birth for the foreign-born population - Portugal (%)
Place of birth for the foreign-born population - Spain (%)
Place of birth for the foreign-born population - Other Southern Europe (%)
Place of birth for the foreign-born population - Albania (%)
Place of birth for the foreign-born population - Belarus (%)
Place of birth for the foreign-born population - Bosnia and Herzegovina (%)
Place of birth for the foreign-born population - Bulgaria (%)
Place of birth for the foreign-born population - Croatia (%)
Place of birth for the foreign-born population - Czechoslovakia (%)
Place of birth for the foreign-born population - Hungary (%)
Place of birth for the foreign-born population - Latvia (%)
Place of birth for the foreign-born population - Lithuania (%)
Place of birth for the foreign-born population - North Macedonia (Macedonia) (%)
Place of birth for the foreign-born population - Moldova (%)
Place of birth for the foreign-born population - Poland (%)
Place of birth for the foreign-born population - Romania (%)
Place of birth for the foreign-born population - Russia (%)
Place of birth for the foreign-born population - Serbia (%)
Place of birth for the foreign-born population - Ukraine (%)
Place of birth for the foreign-born population - Other Eastern Europe (%)
Place of birth for the foreign-born population - China (%)
Place of birth for the foreign-born population - Hong Kong (%)
Place of birth for the foreign-born population - Taiwan (%)
Place of birth for the foreign-born population - Japan (%)
Place of birth for the foreign-born population - Korea (%)
Place of birth for the foreign-born population - Other Eastern Asia (%)
Place of birth for the foreign-born population - Afghanistan (%)
Place of birth for the foreign-born population - Bangladesh (%)
Place of birth for the foreign-born population - India (%)
Place of birth for the foreign-born population - Iran (%)
Place of birth for the foreign-born population - Kazakhstan (%)
Place of birth for the foreign-born population - Nepal (%)
Place of birth for the foreign-born population - Pakistan (%)
Place of birth for the foreign-born population - Sri Lanka (%)
Place of birth for the foreign-born population - Uzbekistan (%)
Place of birth for the foreign-born population - Other South Central Asia (%)
Place of birth for the foreign-born population - Burma (%)
Place of birth for the foreign-born population - Cambodia (%)
Place of birth for the foreign-born population - Indonesia (%)
Place of birth for the foreign-born population - Laos (%)
Place of birth for the foreign-born population - Malaysia (%)
Place of birth for the foreign-born population - Philippines (%)
Place of birth for the foreign-born population - Singapore (%)
Place of birth for the foreign-born population - Thailand (%)
Place of birth for the foreign-born population - Vietnam (%)
Place of birth for the foreign-born population - Other South Eastern Asia (%)
Place of birth for the foreign-born population - Armenia (%)
Place of birth for the foreign-born population - Iraq (%)
Place of birth for the foreign-born population - Israel (%)
Place of birth for the foreign-born population - Jordan (%)
Place of birth for the foreign-born population - Kuwait (%)
Place of birth for the foreign-born population - Lebanon (%)
Place of birth for the foreign-born population - Saudi Arabia (%)
Place of birth for the foreign-born population - Syria (%)
Place of birth for the foreign-born population - Turkey (%)
Place of birth for the foreign-born population - Yemen (%)
Place of birth for the foreign-born population - Other Western Asia (%)
Place of birth for the foreign-born population - Eritrea (%)
Place of birth for the foreign-born population - Ethiopia (%)
Place of birth for the foreign-born population - Kenya (%)
Place of birth for the foreign-born population - Somalia (%)
Place of birth for the foreign-born population - Uganda (%)
Place of birth for the foreign-born population - Zimbabwe (%)
Place of birth for the foreign-born population - Other Eastern Africa (%)
Place of birth for the foreign-born population - Cameroon (%)
Place of birth for the foreign-born population - Congo (%)
Place of birth for the foreign-born population - Democratic Republic of Congo (Zaire) (%)
Place of birth for the foreign-born population - Other Middle Africa (%)
Place of birth for the foreign-born population - Egypt (%)
Place of birth for the foreign-born population - Morocco (%)
Place of birth for the foreign-born population - Sudan (%)
Place of birth for the foreign-born population - Other Northern Africa (%)
Place of birth for the foreign-born population - South Africa (%)
Place of birth for the foreign-born population - Other Southern Africa (%)
Place of birth for the foreign-born population - Cabo Verde (%)
Place of birth for the foreign-born population - Ghana (%)
Place of birth for the foreign-born population - Liberia (%)
Place of birth for the foreign-born population - Nigeria (%)
Place of birth for the foreign-born population - Senegal (%)
Place of birth for the foreign-born population - Sierra Leone (%)
Place of birth for the foreign-born population - Other Western Africa (%)
Place of birth for the foreign-born population - Australia (%)
Place of birth for the foreign-born population - New Zealand (%)
Place of birth for the foreign-born population - Fiji (%)
Place of birth for the foreign-born population - Micronesia (%)
Place of birth for the foreign-born population - Bahamas (%)
Place of birth for the foreign-born population - Barbados (%)
Place of birth for the foreign-born population - Cuba (%)
Place of birth for the foreign-born population - Dominica (%)
Place of birth for the foreign-born population - Dominican Republic (%)
Place of birth for the foreign-born population - Grenada (%)
Place of birth for the foreign-born population - Haiti (%)
Place of birth for the foreign-born population - Jamaica (%)
Place of birth for the foreign-born population - St. Vincent and the Grenadines (%)
Place of birth for the foreign-born population - Trinidad and Tobago (%)
Place of birth for the foreign-born population - West Indies (%)
Place of birth for the foreign-born population - Other Caribbean (%)
Place of birth for the foreign-born population - Belize (%)
Place of birth for the foreign-born population - Costa Rica (%)
Place of birth for the foreign-born population - El Salvador (%)
Place of birth for the foreign-born population - Guatemala (%)
Place of birth for the foreign-born population - Honduras (%)
Place of birth for the foreign-born population - Mexico (%)
Place of birth for the foreign-born population - Nicaragua (%)
Place of birth for the foreign-born population - Panama (%)
Place of birth for the foreign-born population - Other Central America (%)
Place of birth for the foreign-born population - Argentina (%)
Place of birth for the foreign-born population - Bolivia (%)
Place of birth for the foreign-born population - Brazil (%)
Place of birth for the foreign-born population - Chile (%)
Place of birth for the foreign-born population - Colombia (%)
Place of birth for the foreign-born population - Ecuador (%)
Place of birth for the foreign-born population - Guyana (%)
Place of birth for the foreign-born population - Peru (%)
Place of birth for the foreign-born population - Uruguay (%)
Place of birth for the foreign-born population - Venezuela (%)
Place of birth for the foreign-born population - Other South America (%)
Place of birth for the foreign-born population - Canada (%)
Place of birth for the foreign-born population - Other Northern America (%)
Place of birth for the foreign-born population - Other (%)
City of Venice hosting new Flood Zone Map open house on Feb. 12th! (0 replies)Beertopia, Parrish Heritage Days, Art in the Park, Gamble Plantation Open House & more, all this weekend! (2 replies)Venice Florida - Annual house/condo rental looking for boat lift rental also (2 replies)Irish Celtic Festival, Palmetto Heritage Festival, Festival of the Arts, Paul Anka & Baseball, all this weekend! (0 replies)Gem Jewelry & Bead Show, Special Olympics Paddle Competition, Opera Open House, Wrestling & More, all this weekend! (0 replies)DeSoto Heritage Grand Parade, SRQ Comic-Con, Rowing Championships, BIG Car Show, Tattoo Expo & more, all this weekend! (1 reply)
Latest news about races in Venice, FL collected exclusively by city-data.com from local newspapers, TV, and radio stations
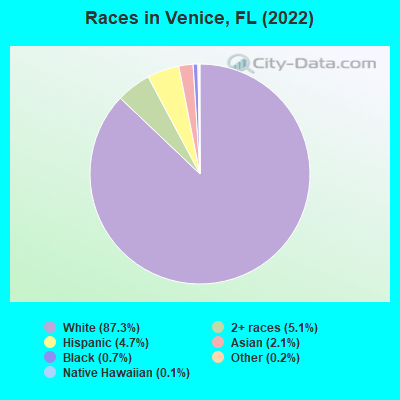
According to 2022 data, the most numerous races in Venice, FL are White alone (23,618 residents), Hispanic (1,264 residents), and Black alone (201 residents). 87.0% of Venice residents speak English at home. 11.7% of Venice, FL residents are foreign-born (6.0% born in Europe, 2.1% born in Asia, 1.9% born in Latin America, 1.5% born in North America), which is 78.7% less than the foreign-born rate of 21.0% across the entire state of Florida.
Race distribution in Venice
2000 2022
10,458,509 65.4% White alone 2,682,715 16.8% Hispanic 2,264,268 14.2% Black alone 261,693 1.6% Asian alone 236,954 1.5% Two or more races 42,358 0.3% American Indian alone 28,994 0.2% Other race alone 6,887 0.04% Native Hawaiian and Other
11,309,403 50.8% White alone 6,025,039 27.1% Hispanic 3,241,015 14.6% Black alone 861,630 3.9% Two or more races 623,692 2.8% Asian alone 152,054 0.7% Other race alone 22,504 0.1% American Indian alone 9,486 0.04% Native Hawaiian and Other
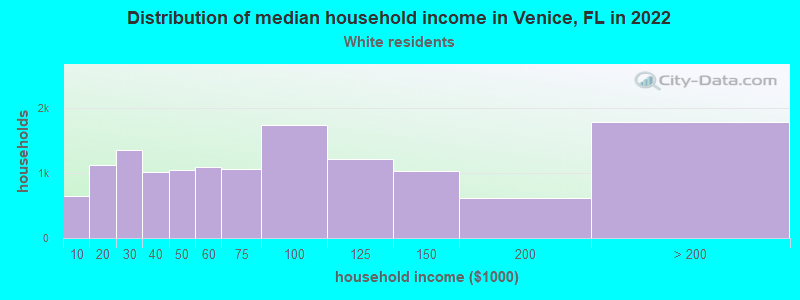
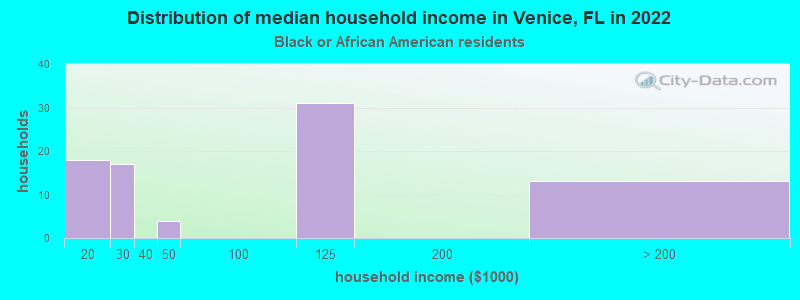
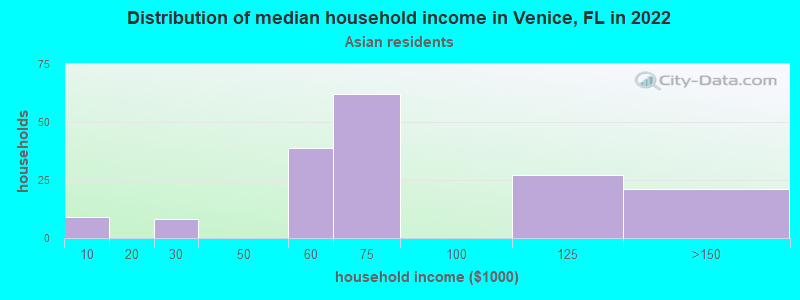
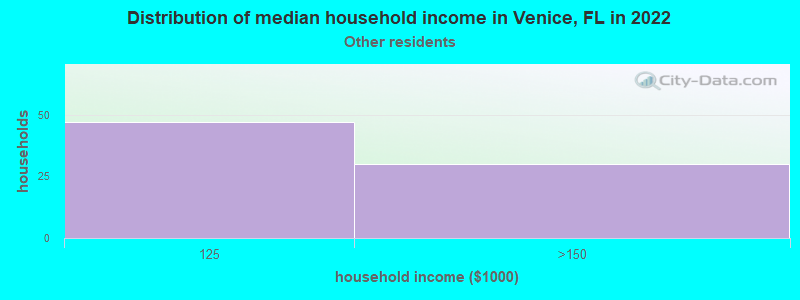
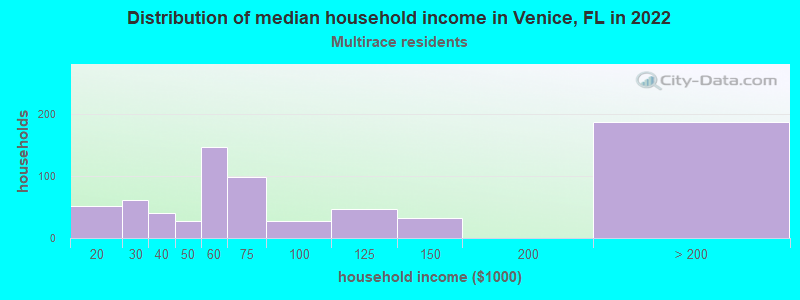
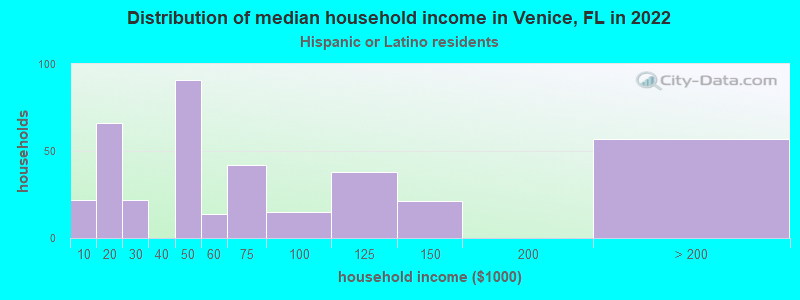
Income and house value in Venice Median household income in 2022 $70,070 White non-Hispanic householders$88,822 Asian householders$144,476 Some other race householders$53,327 Two or more races householders$61,826 Hispanic or Latino race householdersMedian 2022 house value $566,748 White Non-Hispanic householders $210,667 Asian householders$805,613 Some other race householdersover $1,000,000 Hispanic or Latino householders
Median age by race in Venice
71.2 Median age for White residents71.5 70.7 51.4 Median age for Black or African American residents47.7 60.3 108.4 Median age for American Indian / Alaska Native residents-856,941,507.2 -594,925,633.7 63.9 Median age for Asian residents71.2 63.2 71.9 Median age for Native Hawaiian / Pacific Islander residents90.3 -443,298,968.6 44.0 Median age for Other race residents40.5 57.8 49.7 Median age for Two or more races residents38.6 52.0 70.5 Median age for White alone residents70.6 70.3 51.0 Median age for Hispanic or Latino residents43.9 64.6
Owner/renter occupied households by race in Venice
House owners and renters - White residents 10,815 79.0% Owner occupied2,870 21.0% Renter occupiedHouse owners and renters - Black or African American residents 41 56.7% Owner occupied32 43.3% Renter occupiedHouse owners and renters - American Indian / Alaska Native residents 18 100.0% Renter occupiedHouse owners and renters - Asian residents 179 88.3% Owner occupied24 11.7% Renter occupiedHouse owners and renters - Native Hawaiian / Pacific Islander residents 7 100.0% Owner occupiedHouse owners and renters - Other race residents 59 69.3% Owner occupied26 30.7% Renter occupiedHouse owners and renters - Two or more races residents 678 81.7% Owner occupied152 18.3% Renter occupiedHouse owners and renters - White alone residents 10,805 78.3% Owner occupied2,993 21.7% Renter occupiedHouse owners and renters - Hispanic or Latino residents 274 77.9% Owner occupied78 22.1% Renter occupied
Language usage in Venice
English speakers - Total 87.0% of residents of Venice speak English at home.
4.0% of residents speak Spanish at home 846 79.6% Speak English very well217 20.4% Speak English less than very well9.1% of residents speak other language at home 1,636 67.0% Speak English very well807 33.0% Speak English less than very well
English speakers - Born in the United States 96.5% of residents of Venice speak English at home.
1.8% of residents speak Spanish at home 339 95.0% Speak English very well18 5.0% Speak English less than very well1.6% of residents speak other language at home 308 96.2% Speak English very well12 3.8% Speak English less than very well
English speakers - Native, born elsewhere 48.8% of residents of Venice speak English at home.
27.5% of residents speak Spanish at home 87 94.6% Speak English very well5 5.4% Speak English less than very well21.3% of residents speak other language at home 71 100.0% Speak English very well
English speakers - Foreign-born 33.7% of residents of Venice speak English at home.
13.3% of residents speak Spanish at home 275 57.2% Speak English very well206 42.8% Speak English less than very well54.2% of residents speak other language at home 1,151 58.7% Speak English very well810 41.3% Speak English less than very well
White (Caucasian) - Speak only English Native:
97.9% (20,606)Foreign-born:
45.9% (966)
White (Caucasian) - Speak another language Native:
2.3% (491)Foreign-born:
53.8% (1,132)
Black or African American - Speak only English Native:
92.6% (152)Foreign-born:
16.0% (6)
Asian - Speak only English Native:
24.1% (13)Foreign-born:
24.3% (132)
Asian - Speak another language Native:
69.9% (38)Foreign-born:
73.9% (402)
Other race - Speak another language Native:
53.5% (113)Foreign-born:
92.9% (131)
Two or more races - Speak only English Native:
73.5% (1,217)Foreign-born:
5.5% (33)
Two or more races - Speak another language Native:
24.9% (412)Foreign-born:
97.3% (582)
White alone - Speak only English Native:
97.4% (20,659)Foreign-born:
44.1% (1,041)
White alone - Speak another language Native:
2.6% (542)Foreign-born:
55.4% (1,308)
Hispanic or Latino - Speak only English Native:
52.2% (383)Foreign-born:
2.1% (10)
Hispanic or Latino - Speak another language Native:
46.2% (339)Foreign-born:
100.0% (468)
Foreign-born residents in Venice 3,178 residents are foreign born (6.0% Europe , 2.1% Asia , 1.9% Latin America , 1.5% North America ).
This city:
11.7%Florida:
21.1%
Marital status for residents in Venice Marital status - White (Caucasian) population 15 years and over
Males 14.6% Never married63.7% Now married1.7% Separated6.9% Widowed13.0% DivorcedFemales 12.6% Never married49.1% Now married0.1% Separated19.5% Widowed18.7% DivorcedWomen who gave birth in the past 12 months Now married:
100.0% (53)Unmarried:
0.0% (0)
Women who did not give birth in the past 12 months Now married:
21.3% (321)Unmarried:
78.7% (1,187)
Marital status - Black or African American population 15 years and over
Males 36.8% Never married50.0% Now married0.0% Separated6.6% Widowed6.6% DivorcedFemales 42.4% Never married0.0% Now married0.0% Separated0.0% Widowed57.6% DivorcedWomen who did not give birth in the past 12 months Now married:
0.0% (0)Unmarried:
100.0% (53)
Marital status - American Indian / Alaska Native population 15 years and over
Males 0.0% Never married100.0% Now married0.0% Separated0.0% Widowed0.0% DivorcedFemales 25.0% Never married75.0% Now married0.0% Separated0.0% Widowed0.0% DivorcedWomen who did not give birth in the past 12 months Now married:
0.0% (0)Unmarried:
100.0% (7)
Marital status - Asian population 15 years and over
Males 26.5% Never married70.0% Now married0.0% Separated0.0% Widowed3.5% DivorcedFemales 12.1% Never married85.2% Now married0.0% Separated2.6% Widowed0.0% DivorcedWomen who did not give birth in the past 12 months Now married:
67.5% (80)Unmarried:
32.5% (38)
Marital status - Native Hawaiian / Pacific Islander population 15 years and over
Males 0.0% Never married17.1% Now married0.0% Separated0.0% Widowed82.9% DivorcedFemales 0.0% Never married100.0% Now married0.0% Separated0.0% Widowed0.0% DivorcedMarital status - Other race population 15 years and over
Males 0.0% Never married61.6% Now married0.0% Separated0.0% Widowed38.4% DivorcedFemales 10.6% Never married89.4% Now married0.0% Separated0.0% Widowed0.0% DivorcedWomen who did not give birth in the past 12 months Now married:
69.6% (23)Unmarried:
30.4% (10)
Marital status - Two or more races population 15 years and over
Males 20.9% Never married73.0% Now married0.0% Separated4.9% Widowed1.2% DivorcedFemales 23.6% Never married59.5% Now married0.0% Separated9.7% Widowed7.2% DivorcedWomen who gave birth in the past 12 months Now married:
100.0% (37)Unmarried:
0.0% (0)
Women who did not give birth in the past 12 months Now married:
50.0% (300)Unmarried:
50.0% (300)
Marital status - White alone, not Hispanic / Latino population 15 years and over
Males 14.4% Never married63.8% Now married1.7% Separated7.0% Widowed13.1% DivorcedFemales 12.3% Never married49.7% Now married0.1% Separated19.1% Widowed18.8% DivorcedWomen who gave birth in the past 12 months Now married:
100.0% (55)Unmarried:
0.0% (0)
Women who did not give birth in the past 12 months Now married:
20.9% (314)Unmarried:
79.1% (1,185)
Marital status - Hispanic or Latino population 15 years and over
Males 23.2% Never married59.6% Now married0.0% Separated0.0% Widowed17.2% DivorcedFemales 15.8% Never married61.7% Now married0.0% Separated17.8% Widowed4.7% DivorcedWomen who gave birth in the past 12 months Now married:
100.0% (23)Unmarried:
0.0% (0)
Women who did not give birth in the past 12 months Now married:
63.8% (150)Unmarried:
36.2% (85)
Ancestries in Venice
2,348 17.0% American2,085 15.1% German1,754 12.7% English1,717 12.5% Italian1,263 9.2% Irish516 3.7% Polish397 2.9% European272 2.0% French177 1.3% Norwegian171 1.2% Dutch161 1.2% Canadian159 1.2% Hungarian151 1.1% Swedish148 1.1% Scotch-Irish133 1.0% South African123 0.9% Romanian115 0.8% British108 0.8% French Canadian106 0.8% Scottish102 0.7% Czech83 0.6% Eastern European55 0.4% Ukrainian54 0.4% Russian50 0.4% Iranian39 0.3% Lebanese33 0.2% Portuguese29 0.2% Finnish29 0.2% Belgian28 0.2% Bulgarian28 0.2% Austrian26 0.2% Palestinian26 0.2% Celtic24 0.2% Northern European24 0.2% Swiss21 0.2% Armenian17 0.1% Slovak14 0.1% Danish14 0.1% Czechoslovakian7 0.05% Serbian5 0.04% Syrian1 0.01% African
Geographical mobility in Venice Same house 1 year ago 19,583 84.1% White (Caucasian)137 69.7% Black or African American54 100.0% American Indian / Alaska Native439 78.2% Asian44 100.0% Native Hawaiian / Pacific Islander291 80.6% Other race2,299 90.6% Two or more races19,863 84.1% White alone, not Hispanic / Latino1,206 95.1% Hispanic or LatinoMoved within same county 1,174 5.0% White / Caucasian13 6.4% Black or African American42 7.4% Asian29 8.0% Other race45 1.8% Two or more races1,252 5.3% White alone, not Hispanic / Latino19 1.5% Hispanic or LatinoMoved within same state 806 3.5% White / Caucasian51 26.1% Black or African American24 6.7% Other race22 0.9% Two or more races793 3.4% White alone, not Hispanic / Latino40 3.2% Hispanic or LatinoMoved from different state 1,559 6.7% White / Caucasian78 14.0% Asian195 7.7% Two or more races1,515 6.4% White alone, not Hispanic / Latino45 3.6% Hispanic or LatinoMoved from abroad 226 1.0% White237 1.0% White alone, not Hispanic / Latino
Children Nativity (place of birth) in Venice
Children under 6 years - Living with two parents Both parents native 243 100.0% NativeOne native, one foreign-born parent 52 100.0% NativeChildren under 6 years - Living with one parent Native parent 73 100.0% NativeChildren 6 to 17 years - Living with two parents Both parents native 385 99.9% Native1 0.1% Foreign-bornBoth parents foreign-born 72 100.0% NativeOne native, one foreign-born parent 25 78.9% Native7 21.1% Foreign-bornChildren 6 to 17 years - Living with one parent Native parent 328 100.0% NativeForeign-born parent 115 54.4% Native96 45.6% Foreign-born
Grandparents responsible for own grandchildren in Venice
Grandparents (30 to 59 years) White / Caucasian 61 100.0% Responsible for grandchildrenTwo or more races 74 100.0% Not responsible for grandchildrenWhite alone, not Hispanic / Latino 64 100.0% Responsible for grandchildrenGrandparents (60 years and over) White / Caucasian 102 82.4% Responsible for grandchildren22 17.6% Not responsible for grandchildrenTwo or more races 55 70.5% Responsible for grandchildren23 29.5% Not responsible for grandchildrenWhite alone, not Hispanic / Latino 105 82.0% Responsible for grandchildren23 18.0% Not responsible for grandchildren