Races in Valrico, Florida (FL) Detailed Stats
Data:
Races - White alone (%)
Races - White alone (% change since 2000)
Races - Black alone (%)
Races - Black alone (% change since 2000)
Races - American Indian alone (%)
Races - American Indian alone (% change since 2000)
Races - Asian alone (%)
Races - Asian alone (% change since 2000)
Races - Hispanic (%)
Races - Hispanic (% change since 2000)
Races - Native Hawaiian and Other Pacific Islander alone (%)
Races - Native Hawaiian and Other Pacific Islander alone (% change since 2000)
Races - Two or more races(%)
Races - Two or more races(% change since 2000)
Races - Other race alone (%)
Races - Other race alone (% change since 2000)
Racial diversity
Place of birth - Born in state of residence (%)
Place of birth - Born in state of residence (%) - White
Place of birth - Born in state of residence (%) - Black or African American
Place of birth - Born in state of residence (%) - Asian
Place of birth - Born in state of residence (%) - Hispanic or Latino
Place of birth - Born in state of residence (%) - American Indian and Alaska Native
Place of birth - Born in state of residence (%) - Multirace
Place of birth - Born in state of residence (%) - Other Race
Place of birth - Born in other state (%)
Place of birth - Born in other state (%) - White
Place of birth - Born in other state (%) - Black or African American
Place of birth - Born in other state (%) - Asian
Place of birth - Born in other state (%) - Hispanic or Latino
Place of birth - Born in other state (%) - American Indian and Alaska Native
Place of birth - Born in other state (%) - Multirace
Place of birth - Born in other state (%) - Other Race
Place of birth - Native, outside of US (%)
Place of birth - Native, outside of US (%) - White
Place of birth - Native, outside of US (%) - Black or African American
Place of birth - Native, outside of US (%) - Asian
Place of birth - Native, outside of US (%) - Hispanic or Latino
Place of birth - Native, outside of US (%) - American Indian and Alaska Native
Place of birth - Native, outside of US (%) - Multirace
Place of birth - Native, outside of US (%) - Other Race
Place of birth - Foreign born (%)
Place of birth - Foreign born (%) - White
Place of birth - Foreign born (%) - Black or African American
Place of birth - Foreign born (%) - Asian
Place of birth - Foreign born (%) - Hispanic or Latino
Place of birth - Foreign born (%) - American Indian and Alaska Native
Place of birth - Foreign born (%) - Multirace
Place of birth - Foreign born (%) - Other Race
Residents speaking English at home (%)
Residents speaking English at home - Born in the United States (%)
Residents speaking English at home - Native, born elsewhere (%)
Residents speaking English at home - Foreign born (%)
Residents speaking Spanish at home (%)
Residents speaking Spanish at home - Born in the United States (%)
Residents speaking Spanish at home - Native, born elsewhere (%)
Residents speaking Spanish at home - Foreign born (%)
Residents speaking other language at home (%)
Residents speaking other language at home - Born in the United States (%)
Residents speaking other language at home - Native, born elsewhere (%)
Residents speaking other language at home - Foreign born (%)
Marital status - Never married (%)
Marital status - Now married (%)
Marital status - Separated (%)
Marital status - Widowed (%)
Marital status - Divorced (%)
Ancestries Reported - Arab (%)
Ancestries Reported - Czech (%)
Ancestries Reported - Danish (%)
Ancestries Reported - Dutch (%)
Ancestries Reported - English (%)
Ancestries Reported - French (%)
Ancestries Reported - French Canadian (%)
Ancestries Reported - German (%)
Ancestries Reported - Greek (%)
Ancestries Reported - Hungarian (%)
Ancestries Reported - Irish (%)
Ancestries Reported - Italian (%)
Ancestries Reported - Lithuanian (%)
Ancestries Reported - Norwegian (%)
Ancestries Reported - Polish (%)
Ancestries Reported - Portuguese (%)
Ancestries Reported - Russian (%)
Ancestries Reported - Scotch-Irish (%)
Ancestries Reported - Scottish (%)
Ancestries Reported - Slovak (%)
Ancestries Reported - Subsaharan African (%)
Ancestries Reported - Swedish (%)
Ancestries Reported - Swiss (%)
Ancestries Reported - Ukrainian (%)
Ancestries Reported - United States (%)
Ancestries Reported - Welsh (%)
Ancestries Reported - West Indian (%)
Ancestries Reported - Other (%)
Geographical mobility - Same house 1 year ago (%)
Geographical mobility - Same house 1 year ago (%) - White
Geographical mobility - Same house 1 year ago (%) - Black or African American
Geographical mobility - Same house 1 year ago (%) - Asian
Geographical mobility - Same house 1 year ago (%) - Hispanic or Latino
Geographical mobility - Same house 1 year ago (%) - American Indian and Alaska Native
Geographical mobility - Same house 1 year ago (%) - Multirace
Geographical mobility - Same house 1 year ago (%) - Other Race
Geographical mobility - Moved within same county (%)
Geographical mobility - Moved within same county (%) - White
Geographical mobility - Moved within same county (%) - Black or African American
Geographical mobility - Moved within same county (%) - Asian
Geographical mobility - Moved within same county (%) - Hispanic or Latino
Geographical mobility - Moved within same county (%) - American Indian and Alaska Native
Geographical mobility - Moved within same county (%) - Multirace
Geographical mobility - Moved within same county (%) - Other Race
Geographical mobility - Moved from different county within same state (%)
Geographical mobility - Moved from different county within same state (%) - White
Geographical mobility - Moved from different county within same state (%) - Black or African American
Geographical mobility - Moved from different county within same state (%) - Asian
Geographical mobility - Moved from different county within same state (%) - Hispanic or Latino
Geographical mobility - Moved from different county within same state (%) - American Indian and Alaska Native
Geographical mobility - Moved from different county within same state (%) - Multirace
Geographical mobility - Moved from different county within same state (%) - Other Race
Geographical mobility - Moved from different state (%)
Geographical mobility - Moved from different state (%) - White
Geographical mobility - Moved from different state (%) - Black or African American
Geographical mobility - Moved from different state (%) - Asian
Geographical mobility - Moved from different state (%) - Hispanic or Latino
Geographical mobility - Moved from different state (%) - American Indian and Alaska Native
Geographical mobility - Moved from different state (%) - Multirace
Geographical mobility - Moved from different state (%) - Other Race
Geographical mobility - Moved from abroad (%)
Geographical mobility - Moved from abroad (%) - White
Geographical mobility - Moved from abroad (%) - Black or African American
Geographical mobility - Moved from abroad (%) - Asian
Geographical mobility - Moved from abroad (%) - Hispanic or Latino
Geographical mobility - Moved from abroad (%) - American Indian and Alaska Native
Geographical mobility - Moved from abroad (%) - Multirace
Geographical mobility - Moved from abroad (%) - Other Race
Place of birth for the foreign-born population - Ireland (%)
Place of birth for the foreign-born population - Denmark (%)
Place of birth for the foreign-born population - Norway (%)
Place of birth for the foreign-born population - Sweden (%)
Place of birth for the foreign-born population - United Kingdom (%)
Place of birth for the foreign-born population - England (%)
Place of birth for the foreign-born population - Scotland (%)
Place of birth for the foreign-born population - Other Northern Europe (%)
Place of birth for the foreign-born population - Austria (%)
Place of birth for the foreign-born population - Belgium (%)
Place of birth for the foreign-born population - France (%)
Place of birth for the foreign-born population - Germany (%)
Place of birth for the foreign-born population - Netherlands (%)
Place of birth for the foreign-born population - Switzerland (%)
Place of birth for the foreign-born population - Other Western Europe (%)
Place of birth for the foreign-born population - Greece (%)
Place of birth for the foreign-born population - Italy (%)
Place of birth for the foreign-born population - Portugal (%)
Place of birth for the foreign-born population - Spain (%)
Place of birth for the foreign-born population - Other Southern Europe (%)
Place of birth for the foreign-born population - Albania (%)
Place of birth for the foreign-born population - Belarus (%)
Place of birth for the foreign-born population - Bosnia and Herzegovina (%)
Place of birth for the foreign-born population - Bulgaria (%)
Place of birth for the foreign-born population - Croatia (%)
Place of birth for the foreign-born population - Czechoslovakia (%)
Place of birth for the foreign-born population - Hungary (%)
Place of birth for the foreign-born population - Latvia (%)
Place of birth for the foreign-born population - Lithuania (%)
Place of birth for the foreign-born population - North Macedonia (Macedonia) (%)
Place of birth for the foreign-born population - Moldova (%)
Place of birth for the foreign-born population - Poland (%)
Place of birth for the foreign-born population - Romania (%)
Place of birth for the foreign-born population - Russia (%)
Place of birth for the foreign-born population - Serbia (%)
Place of birth for the foreign-born population - Ukraine (%)
Place of birth for the foreign-born population - Other Eastern Europe (%)
Place of birth for the foreign-born population - China (%)
Place of birth for the foreign-born population - Hong Kong (%)
Place of birth for the foreign-born population - Taiwan (%)
Place of birth for the foreign-born population - Japan (%)
Place of birth for the foreign-born population - Korea (%)
Place of birth for the foreign-born population - Other Eastern Asia (%)
Place of birth for the foreign-born population - Afghanistan (%)
Place of birth for the foreign-born population - Bangladesh (%)
Place of birth for the foreign-born population - India (%)
Place of birth for the foreign-born population - Iran (%)
Place of birth for the foreign-born population - Kazakhstan (%)
Place of birth for the foreign-born population - Nepal (%)
Place of birth for the foreign-born population - Pakistan (%)
Place of birth for the foreign-born population - Sri Lanka (%)
Place of birth for the foreign-born population - Uzbekistan (%)
Place of birth for the foreign-born population - Other South Central Asia (%)
Place of birth for the foreign-born population - Burma (%)
Place of birth for the foreign-born population - Cambodia (%)
Place of birth for the foreign-born population - Indonesia (%)
Place of birth for the foreign-born population - Laos (%)
Place of birth for the foreign-born population - Malaysia (%)
Place of birth for the foreign-born population - Philippines (%)
Place of birth for the foreign-born population - Singapore (%)
Place of birth for the foreign-born population - Thailand (%)
Place of birth for the foreign-born population - Vietnam (%)
Place of birth for the foreign-born population - Other South Eastern Asia (%)
Place of birth for the foreign-born population - Armenia (%)
Place of birth for the foreign-born population - Iraq (%)
Place of birth for the foreign-born population - Israel (%)
Place of birth for the foreign-born population - Jordan (%)
Place of birth for the foreign-born population - Kuwait (%)
Place of birth for the foreign-born population - Lebanon (%)
Place of birth for the foreign-born population - Saudi Arabia (%)
Place of birth for the foreign-born population - Syria (%)
Place of birth for the foreign-born population - Turkey (%)
Place of birth for the foreign-born population - Yemen (%)
Place of birth for the foreign-born population - Other Western Asia (%)
Place of birth for the foreign-born population - Eritrea (%)
Place of birth for the foreign-born population - Ethiopia (%)
Place of birth for the foreign-born population - Kenya (%)
Place of birth for the foreign-born population - Somalia (%)
Place of birth for the foreign-born population - Uganda (%)
Place of birth for the foreign-born population - Zimbabwe (%)
Place of birth for the foreign-born population - Other Eastern Africa (%)
Place of birth for the foreign-born population - Cameroon (%)
Place of birth for the foreign-born population - Congo (%)
Place of birth for the foreign-born population - Democratic Republic of Congo (Zaire) (%)
Place of birth for the foreign-born population - Other Middle Africa (%)
Place of birth for the foreign-born population - Egypt (%)
Place of birth for the foreign-born population - Morocco (%)
Place of birth for the foreign-born population - Sudan (%)
Place of birth for the foreign-born population - Other Northern Africa (%)
Place of birth for the foreign-born population - South Africa (%)
Place of birth for the foreign-born population - Other Southern Africa (%)
Place of birth for the foreign-born population - Cabo Verde (%)
Place of birth for the foreign-born population - Ghana (%)
Place of birth for the foreign-born population - Liberia (%)
Place of birth for the foreign-born population - Nigeria (%)
Place of birth for the foreign-born population - Senegal (%)
Place of birth for the foreign-born population - Sierra Leone (%)
Place of birth for the foreign-born population - Other Western Africa (%)
Place of birth for the foreign-born population - Australia (%)
Place of birth for the foreign-born population - New Zealand (%)
Place of birth for the foreign-born population - Fiji (%)
Place of birth for the foreign-born population - Micronesia (%)
Place of birth for the foreign-born population - Bahamas (%)
Place of birth for the foreign-born population - Barbados (%)
Place of birth for the foreign-born population - Cuba (%)
Place of birth for the foreign-born population - Dominica (%)
Place of birth for the foreign-born population - Dominican Republic (%)
Place of birth for the foreign-born population - Grenada (%)
Place of birth for the foreign-born population - Haiti (%)
Place of birth for the foreign-born population - Jamaica (%)
Place of birth for the foreign-born population - St. Vincent and the Grenadines (%)
Place of birth for the foreign-born population - Trinidad and Tobago (%)
Place of birth for the foreign-born population - West Indies (%)
Place of birth for the foreign-born population - Other Caribbean (%)
Place of birth for the foreign-born population - Belize (%)
Place of birth for the foreign-born population - Costa Rica (%)
Place of birth for the foreign-born population - El Salvador (%)
Place of birth for the foreign-born population - Guatemala (%)
Place of birth for the foreign-born population - Honduras (%)
Place of birth for the foreign-born population - Mexico (%)
Place of birth for the foreign-born population - Nicaragua (%)
Place of birth for the foreign-born population - Panama (%)
Place of birth for the foreign-born population - Other Central America (%)
Place of birth for the foreign-born population - Argentina (%)
Place of birth for the foreign-born population - Bolivia (%)
Place of birth for the foreign-born population - Brazil (%)
Place of birth for the foreign-born population - Chile (%)
Place of birth for the foreign-born population - Colombia (%)
Place of birth for the foreign-born population - Ecuador (%)
Place of birth for the foreign-born population - Guyana (%)
Place of birth for the foreign-born population - Peru (%)
Place of birth for the foreign-born population - Uruguay (%)
Place of birth for the foreign-born population - Venezuela (%)
Place of birth for the foreign-born population - Other South America (%)
Place of birth for the foreign-born population - Canada (%)
Place of birth for the foreign-born population - Other Northern America (%)
Place of birth for the foreign-born population - Other (%)
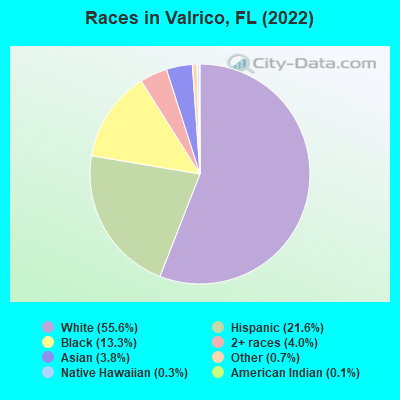
According to 2022 data, the most numerous races in Valrico, FL are White alone (22,093 residents), Hispanic (8,582 residents), and Black alone (5,277 residents). 75.5% of Valrico residents speak English at home. 14.9% of Valrico, FL residents are foreign-born (7.4% born in Latin America, 3.1% born in Asia, 2.1% born in Europe), which is 41.2% less than the foreign-born rate of 21.0% across the entire state of Florida.
Race distribution in Valrico
2000 2022
10,458,509 65.4% White alone 2,682,715 16.8% Hispanic 2,264,268 14.2% Black alone 261,693 1.6% Asian alone 236,954 1.5% Two or more races 42,358 0.3% American Indian alone 28,994 0.2% Other race alone 6,887 0.04% Native Hawaiian and Other
11,309,403 50.8% White alone 6,025,039 27.1% Hispanic 3,241,015 14.6% Black alone 861,630 3.9% Two or more races 623,692 2.8% Asian alone 152,054 0.7% Other race alone 22,504 0.1% American Indian alone 9,486 0.04% Native Hawaiian and Other
Income and house value in Valrico Median household income in 2022 $99,113 White non-Hispanic householders$98,509 Black householders$114,896 American Indian and Alaska Native householders$104,955 Asian householders$78,998 Some other race householders$103,635 Two or more races householders$82,000 Hispanic or Latino race householdersMedian 2022 house value $623,717 White Non-Hispanic householders$467,906 Black or African American householders over $1,000,000 Asian householders$434,281 Some other race householders$717,961 Two or more races householders$452,751 Hispanic or Latino householders
Median age by race in Valrico
50.8 Median age for White residents47.6 51.8 38.6 Median age for Black or African American residents50.1 31.5 24.4 Median age for American Indian / Alaska Native residents0.0 24.2 46.1 Median age for Asian residents44.6 51.4 65.0 Median age for Native Hawaiian / Pacific Islander residents-776,729,559.0 -490,118,576.6 34.0 Median age for Other race residents33.4 37.9 34.1 Median age for Two or more races residents40.9 30.9 50.6 Median age for White alone residents47.3 52.1 37.7 Median age for Hispanic or Latino residents38.0 37.7
Owner/renter occupied households by race in Valrico
House owners and renters - White residents 7,411 79.4% Owner occupied1,925 20.6% Renter occupiedHouse owners and renters - Black or African American residents 1,535 87.7% Owner occupied215 12.3% Renter occupiedHouse owners and renters - American Indian / Alaska Native residents 138 91.0% Owner occupied14 9.0% Renter occupiedHouse owners and renters - Asian residents 431 97.3% Owner occupied12 2.7% Renter occupiedHouse owners and renters - Native Hawaiian / Pacific Islander residents 52 100.0% Owner occupiedHouse owners and renters - Other race residents 301 66.7% Owner occupied151 33.3% Renter occupiedHouse owners and renters - Two or more races residents 1,888 77.9% Owner occupied535 22.1% Renter occupiedHouse owners and renters - White alone residents 7,371 79.8% Owner occupied1,861 20.2% Renter occupiedHouse owners and renters - Hispanic or Latino residents 1,863 72.3% Owner occupied714 27.7% Renter occupied
Language usage in Valrico
English speakers - Total 75.5% of residents of Valrico speak English at home.
13.8% of residents speak Spanish at home 3,324 62.8% Speak English very well1,973 37.2% Speak English less than very well10.8% of residents speak other language at home 3,504 84.8% Speak English very well627 15.2% Speak English less than very well
English speakers - Born in the United States 93.3% of residents of Valrico speak English at home.
5.4% of residents speak Spanish at home 895 89.9% Speak English very well101 10.1% Speak English less than very well1.6% of residents speak other language at home 233 77.4% Speak English very well68 22.6% Speak English less than very well
English speakers - Native, born elsewhere 40.1% of residents of Valrico speak English at home.
55.6% of residents speak Spanish at home 698 61.8% Speak English very well431 38.2% Speak English less than very well6.0% of residents speak other language at home 121 100.0% Speak English very well
English speakers - Foreign-born 24.4% of residents of Valrico speak English at home.
36.9% of residents speak Spanish at home 1,010 44.6% Speak English very well1,256 55.4% Speak English less than very well37.3% of residents speak other language at home 1,776 77.6% Speak English very well514 22.4% Speak English less than very well
White (Caucasian) - Speak only English Native:
98.2% (20,908)Foreign-born:
51.5% (445)
White (Caucasian) - Speak another language Native:
4.1% (862)Foreign-born:
59.9% (518)
Black or African American - Speak only English Native:
70.7% (2,809)Foreign-born:
44.1% (548)
Black or African American - Speak another language Native:
28.4% (1,128)Foreign-born:
55.9% (694)
American Indian / Alaska Native - Speak another language Native:
32.1% (40)Foreign-born:
100.0% (25)
Asian - Speak only English Native:
41.6% (141)Foreign-born:
14.1% (157)
Asian - Speak another language Native:
60.0% (204)Foreign-born:
85.9% (958)
Native Hawaiian / Pacific Islander - Speak only English Native:
87.6% (46)Foreign-born:
100.0% (33)
Other race - Speak only English Native:
44.4% (439)Foreign-born:
7.8% (47)
Other race - Speak another language Native:
56.5% (559)Foreign-born:
91.8% (560)
Two or more races - Speak only English Native:
61.6% (3,003)Foreign-born:
10.7% (241)
Two or more races - Speak another language Native:
37.7% (1,836)Foreign-born:
87.8% (1,980)
White alone - Speak only English Native:
98.0% (20,146)Foreign-born:
44.7% (482)
White alone - Speak another language Native:
2.1% (438)Foreign-born:
55.9% (603)
Hispanic or Latino - Speak only English Native:
51.2% (2,889)Foreign-born:
5.3% (123)
Hispanic or Latino - Speak another language Native:
50.4% (2,842)Foreign-born:
94.7% (2,211)
Foreign-born residents in Valrico 5,915 residents are foreign born (7.4% Latin America , 3.1% Asia , 2.1% Europe ).
This city:
14.9%Florida:
21.1%
Marital status for residents in Valrico Marital status - White (Caucasian) population 15 years and over
Males 29.7% Never married59.6% Now married0.5% Separated2.9% Widowed7.3% DivorcedFemales 22.0% Never married52.0% Now married0.8% Separated10.5% Widowed14.7% DivorcedWomen who gave birth in the past 12 months Now married:
85.2% (118)Unmarried:
14.8% (20)
Women who did not give birth in the past 12 months Now married:
47.5% (2,114)Unmarried:
52.5% (2,336)
Marital status - Black or African American population 15 years and over
Males 27.0% Never married65.3% Now married0.0% Separated1.5% Widowed6.2% DivorcedFemales 46.4% Never married38.0% Now married0.6% Separated5.8% Widowed9.2% DivorcedWomen who gave birth in the past 12 months Now married:
100.0% (39)Unmarried:
0.0% (0)
Women who did not give birth in the past 12 months Now married:
30.1% (558)Unmarried:
69.9% (1,297)
Marital status - American Indian / Alaska Native population 15 years and over
Males 55.6% Never married44.4% Now married0.0% Separated0.0% Widowed0.0% DivorcedFemales 18.3% Never married81.7% Now married0.0% Separated0.0% Widowed0.0% DivorcedWomen who gave birth in the past 12 months Now married:
100.0% (92)Unmarried:
0.0% (0)
Women who did not give birth in the past 12 months Now married:
51.4% (36)Unmarried:
48.6% (34)
Marital status - Asian population 15 years and over
Males 26.9% Never married61.3% Now married0.0% Separated0.0% Widowed11.7% DivorcedFemales 25.1% Never married61.4% Now married0.0% Separated8.5% Widowed5.0% DivorcedWomen who gave birth in the past 12 months Now married:
100.0% (11)Unmarried:
0.0% (0)
Women who did not give birth in the past 12 months Now married:
59.3% (173)Unmarried:
40.7% (119)
Marital status - Native Hawaiian / Pacific Islander population 15 years and over
Males 0.0% Never married100.0% Now married0.0% Separated0.0% Widowed0.0% DivorcedFemales 52.7% Never married47.3% Now married0.0% Separated0.0% Widowed0.0% DivorcedWomen who did not give birth in the past 12 months Now married:
0.0% (0)Unmarried:
100.0% (37)
Marital status - Other race population 15 years and over
Males 39.6% Never married53.0% Now married4.2% Separated0.0% Widowed3.2% DivorcedFemales 36.0% Never married29.7% Now married0.0% Separated12.9% Widowed21.4% DivorcedWomen who gave birth in the past 12 months Now married:
0.0% (0)Unmarried:
100.0% (80)
Women who did not give birth in the past 12 months Now married:
39.9% (202)Unmarried:
60.1% (303)
Marital status - Two or more races population 15 years and over
Males 31.9% Never married66.7% Now married0.0% Separated0.0% Widowed1.4% DivorcedFemales 23.3% Never married63.0% Now married5.1% Separated4.3% Widowed4.3% DivorcedWomen who gave birth in the past 12 months Now married:
54.2% (20)Unmarried:
45.8% (17)
Women who did not give birth in the past 12 months Now married:
62.0% (914)Unmarried:
38.0% (560)
Marital status - White alone, not Hispanic / Latino population 15 years and over
Males 27.8% Never married60.6% Now married0.5% Separated3.1% Widowed8.0% DivorcedFemales 20.7% Never married52.0% Now married0.6% Separated11.2% Widowed15.4% DivorcedWomen who gave birth in the past 12 months Now married:
83.1% (119)Unmarried:
16.9% (24)
Women who did not give birth in the past 12 months Now married:
48.2% (2,097)Unmarried:
51.8% (2,257)
Marital status - Hispanic or Latino population 15 years and over
Males 35.7% Never married61.4% Now married0.4% Separated0.6% Widowed1.9% DivorcedFemales 27.3% Never married53.6% Now married3.4% Separated6.3% Widowed9.4% DivorcedWomen who gave birth in the past 12 months Now married:
36.3% (34)Unmarried:
63.7% (60)
Women who did not give birth in the past 12 months Now married:
54.2% (1,096)Unmarried:
45.8% (925)
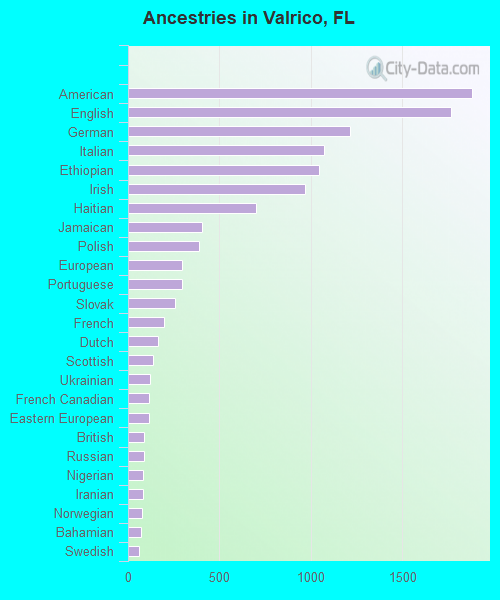
Ancestries in Valrico
1,879 9.2% American1,768 8.6% English1,213 5.9% German1,069 5.2% Italian1,043 5.1% Ethiopian965 4.7% Irish701 3.4% Haitian404 2.0% Jamaican388 1.9% Polish296 1.4% European293 1.4% Portuguese256 1.3% Slovak198 1.0% French163 0.8% Dutch139 0.7% Scottish121 0.6% Ukrainian115 0.6% French Canadian113 0.6% Eastern European90 0.4% British86 0.4% Russian83 0.4% Nigerian81 0.4% Iranian76 0.4% Norwegian70 0.3% Bahamian59 0.3% Swedish54 0.3% Scandinavian49 0.2% South African48 0.2% British West Indian42 0.2% African42 0.2% Hungarian40 0.2% Barbadian39 0.2% Danish38 0.2% Czech35 0.2% Brazilian35 0.2% Northern European34 0.2% Canadian33 0.2% U.S. Virgin Islander32 0.2% Greek29 0.1% Scotch-Irish28 0.1% Czechoslovakian27 0.1% Belgian26 0.1% Afghan15 0.07% Welsh14 0.07% Austrian13 0.06% Jordanian12 0.06% Australian12 0.06% Macedonian9 0.04% Yugoslavian8 0.04% Lithuanian8 0.04% Belizean6 0.03% Guyanese5 0.02% Armenian3 0.01% Lebanese
Geographical mobility in Valrico Same house 1 year ago 18,736 85.1% White (Caucasian)4,832 91.5% Black or African American90 53.0% American Indian / Alaska Native1,404 94.4% Asian1,228 73.6% Other race7,020 88.8% Two or more races18,660 84.6% White alone, not Hispanic / Latino7,514 88.2% Hispanic or LatinoMoved within same county 1,912 8.7% White / Caucasian304 5.8% Black or African American64 37.6% American Indian / Alaska Native71 4.8% Asian107 100.0% Native Hawaiian / Pacific Islander299 17.9% Other race154 2.0% Two or more races1,936 8.8% White alone, not Hispanic / Latino618 7.3% Hispanic or LatinoMoved within same state 277 1.3% White / Caucasian22 0.4% Black or African American83 1.0% Two or more races253 1.1% White alone, not Hispanic / Latino143 1.7% Hispanic or LatinoMoved from different state 963 4.4% White / Caucasian161 3.0% Black or African American13 0.9% Asian31 1.9% Other race648 8.2% Two or more races987 4.5% White alone, not Hispanic / Latino171 2.0% Hispanic or LatinoMoved from abroad 42 0.2% White33 0.6% Black or African American10 0.6% Asian31 1.9% Other race5 0.1% Two or more races73 0.3% White alone, not Hispanic / Latino23 0.3% Hispanic or Latino
Children Nativity (place of birth) in Valrico
Children under 6 years - Living with two parents Both parents native 1,169 100.0% NativeBoth parents foreign-born 248 92.7% Native20 7.3% Foreign-bornOne native, one foreign-born parent 130 100.0% NativeChildren under 6 years - Living with one parent Native parent 286 100.0% NativeForeign-born parent 54 100.0% NativeChildren 6 to 17 years - Living with two parents Both parents native 2,955 100.0% NativeBoth parents foreign-born 1,104 87.3% Native161 12.7% Foreign-bornOne native, one foreign-born parent 385 100.0% NativeChildren 6 to 17 years - Living with one parent Native parent 978 100.0% NativeForeign-born parent 84 54.5% Native70 45.5% Foreign-born
Grandparents responsible for own grandchildren in Valrico
Grandparents (30 to 59 years) White / Caucasian 26 36.2% Responsible for grandchildren47 63.8% Not responsible for grandchildrenBlack or African American 24 23.4% Responsible for grandchildren78 76.6% Not responsible for grandchildrenAsian 20 100.0% Not responsible for grandchildrenTwo or more races 83 76.0% Responsible for grandchildren26 24.0% Not responsible for grandchildrenWhite alone, not Hispanic / Latino 32 45.9% Responsible for grandchildren38 54.1% Not responsible for grandchildrenHispanic or Latino 48 75.7% Responsible for grandchildren15 24.3% Not responsible for grandchildrenGrandparents (60 years and over) White / Caucasian 177 45.4% Responsible for grandchildren213 54.6% Not responsible for grandchildrenBlack or African American 89 100.0% Not responsible for grandchildrenAsian 20 37.4% Responsible for grandchildren34 62.6% Not responsible for grandchildrenTwo or more races 2 2.1% Responsible for grandchildren111 97.9% Not responsible for grandchildrenWhite alone, not Hispanic / Latino 217 46.3% Responsible for grandchildren252 53.7% Not responsible for grandchildrenHispanic or Latino 28 26.2% Responsible for grandchildren80 73.8% Not responsible for grandchildren