Races in Valparaiso, Indiana (IN) Detailed Stats
Data:
Races - White alone (%)
Races - White alone (% change since 2000)
Races - Black alone (%)
Races - Black alone (% change since 2000)
Races - American Indian alone (%)
Races - American Indian alone (% change since 2000)
Races - Asian alone (%)
Races - Asian alone (% change since 2000)
Races - Hispanic (%)
Races - Hispanic (% change since 2000)
Races - Native Hawaiian and Other Pacific Islander alone (%)
Races - Native Hawaiian and Other Pacific Islander alone (% change since 2000)
Races - Two or more races(%)
Races - Two or more races(% change since 2000)
Races - Other race alone (%)
Races - Other race alone (% change since 2000)
Racial diversity
Place of birth - Born in state of residence (%)
Place of birth - Born in state of residence (%) - White
Place of birth - Born in state of residence (%) - Black or African American
Place of birth - Born in state of residence (%) - Asian
Place of birth - Born in state of residence (%) - Hispanic or Latino
Place of birth - Born in state of residence (%) - American Indian and Alaska Native
Place of birth - Born in state of residence (%) - Multirace
Place of birth - Born in state of residence (%) - Other Race
Place of birth - Born in other state (%)
Place of birth - Born in other state (%) - White
Place of birth - Born in other state (%) - Black or African American
Place of birth - Born in other state (%) - Asian
Place of birth - Born in other state (%) - Hispanic or Latino
Place of birth - Born in other state (%) - American Indian and Alaska Native
Place of birth - Born in other state (%) - Multirace
Place of birth - Born in other state (%) - Other Race
Place of birth - Native, outside of US (%)
Place of birth - Native, outside of US (%) - White
Place of birth - Native, outside of US (%) - Black or African American
Place of birth - Native, outside of US (%) - Asian
Place of birth - Native, outside of US (%) - Hispanic or Latino
Place of birth - Native, outside of US (%) - American Indian and Alaska Native
Place of birth - Native, outside of US (%) - Multirace
Place of birth - Native, outside of US (%) - Other Race
Place of birth - Foreign born (%)
Place of birth - Foreign born (%) - White
Place of birth - Foreign born (%) - Black or African American
Place of birth - Foreign born (%) - Asian
Place of birth - Foreign born (%) - Hispanic or Latino
Place of birth - Foreign born (%) - American Indian and Alaska Native
Place of birth - Foreign born (%) - Multirace
Place of birth - Foreign born (%) - Other Race
Residents speaking English at home (%)
Residents speaking English at home - Born in the United States (%)
Residents speaking English at home - Native, born elsewhere (%)
Residents speaking English at home - Foreign born (%)
Residents speaking Spanish at home (%)
Residents speaking Spanish at home - Born in the United States (%)
Residents speaking Spanish at home - Native, born elsewhere (%)
Residents speaking Spanish at home - Foreign born (%)
Residents speaking other language at home (%)
Residents speaking other language at home - Born in the United States (%)
Residents speaking other language at home - Native, born elsewhere (%)
Residents speaking other language at home - Foreign born (%)
Marital status - Never married (%)
Marital status - Now married (%)
Marital status - Separated (%)
Marital status - Widowed (%)
Marital status - Divorced (%)
Ancestries Reported - Arab (%)
Ancestries Reported - Czech (%)
Ancestries Reported - Danish (%)
Ancestries Reported - Dutch (%)
Ancestries Reported - English (%)
Ancestries Reported - French (%)
Ancestries Reported - French Canadian (%)
Ancestries Reported - German (%)
Ancestries Reported - Greek (%)
Ancestries Reported - Hungarian (%)
Ancestries Reported - Irish (%)
Ancestries Reported - Italian (%)
Ancestries Reported - Lithuanian (%)
Ancestries Reported - Norwegian (%)
Ancestries Reported - Polish (%)
Ancestries Reported - Portuguese (%)
Ancestries Reported - Russian (%)
Ancestries Reported - Scotch-Irish (%)
Ancestries Reported - Scottish (%)
Ancestries Reported - Slovak (%)
Ancestries Reported - Subsaharan African (%)
Ancestries Reported - Swedish (%)
Ancestries Reported - Swiss (%)
Ancestries Reported - Ukrainian (%)
Ancestries Reported - United States (%)
Ancestries Reported - Welsh (%)
Ancestries Reported - West Indian (%)
Ancestries Reported - Other (%)
Geographical mobility - Same house 1 year ago (%)
Geographical mobility - Same house 1 year ago (%) - White
Geographical mobility - Same house 1 year ago (%) - Black or African American
Geographical mobility - Same house 1 year ago (%) - Asian
Geographical mobility - Same house 1 year ago (%) - Hispanic or Latino
Geographical mobility - Same house 1 year ago (%) - American Indian and Alaska Native
Geographical mobility - Same house 1 year ago (%) - Multirace
Geographical mobility - Same house 1 year ago (%) - Other Race
Geographical mobility - Moved within same county (%)
Geographical mobility - Moved within same county (%) - White
Geographical mobility - Moved within same county (%) - Black or African American
Geographical mobility - Moved within same county (%) - Asian
Geographical mobility - Moved within same county (%) - Hispanic or Latino
Geographical mobility - Moved within same county (%) - American Indian and Alaska Native
Geographical mobility - Moved within same county (%) - Multirace
Geographical mobility - Moved within same county (%) - Other Race
Geographical mobility - Moved from different county within same state (%)
Geographical mobility - Moved from different county within same state (%) - White
Geographical mobility - Moved from different county within same state (%) - Black or African American
Geographical mobility - Moved from different county within same state (%) - Asian
Geographical mobility - Moved from different county within same state (%) - Hispanic or Latino
Geographical mobility - Moved from different county within same state (%) - American Indian and Alaska Native
Geographical mobility - Moved from different county within same state (%) - Multirace
Geographical mobility - Moved from different county within same state (%) - Other Race
Geographical mobility - Moved from different state (%)
Geographical mobility - Moved from different state (%) - White
Geographical mobility - Moved from different state (%) - Black or African American
Geographical mobility - Moved from different state (%) - Asian
Geographical mobility - Moved from different state (%) - Hispanic or Latino
Geographical mobility - Moved from different state (%) - American Indian and Alaska Native
Geographical mobility - Moved from different state (%) - Multirace
Geographical mobility - Moved from different state (%) - Other Race
Geographical mobility - Moved from abroad (%)
Geographical mobility - Moved from abroad (%) - White
Geographical mobility - Moved from abroad (%) - Black or African American
Geographical mobility - Moved from abroad (%) - Asian
Geographical mobility - Moved from abroad (%) - Hispanic or Latino
Geographical mobility - Moved from abroad (%) - American Indian and Alaska Native
Geographical mobility - Moved from abroad (%) - Multirace
Geographical mobility - Moved from abroad (%) - Other Race
Place of birth for the foreign-born population - Ireland (%)
Place of birth for the foreign-born population - Denmark (%)
Place of birth for the foreign-born population - Norway (%)
Place of birth for the foreign-born population - Sweden (%)
Place of birth for the foreign-born population - United Kingdom (%)
Place of birth for the foreign-born population - England (%)
Place of birth for the foreign-born population - Scotland (%)
Place of birth for the foreign-born population - Other Northern Europe (%)
Place of birth for the foreign-born population - Austria (%)
Place of birth for the foreign-born population - Belgium (%)
Place of birth for the foreign-born population - France (%)
Place of birth for the foreign-born population - Germany (%)
Place of birth for the foreign-born population - Netherlands (%)
Place of birth for the foreign-born population - Switzerland (%)
Place of birth for the foreign-born population - Other Western Europe (%)
Place of birth for the foreign-born population - Greece (%)
Place of birth for the foreign-born population - Italy (%)
Place of birth for the foreign-born population - Portugal (%)
Place of birth for the foreign-born population - Spain (%)
Place of birth for the foreign-born population - Other Southern Europe (%)
Place of birth for the foreign-born population - Albania (%)
Place of birth for the foreign-born population - Belarus (%)
Place of birth for the foreign-born population - Bosnia and Herzegovina (%)
Place of birth for the foreign-born population - Bulgaria (%)
Place of birth for the foreign-born population - Croatia (%)
Place of birth for the foreign-born population - Czechoslovakia (%)
Place of birth for the foreign-born population - Hungary (%)
Place of birth for the foreign-born population - Latvia (%)
Place of birth for the foreign-born population - Lithuania (%)
Place of birth for the foreign-born population - North Macedonia (Macedonia) (%)
Place of birth for the foreign-born population - Moldova (%)
Place of birth for the foreign-born population - Poland (%)
Place of birth for the foreign-born population - Romania (%)
Place of birth for the foreign-born population - Russia (%)
Place of birth for the foreign-born population - Serbia (%)
Place of birth for the foreign-born population - Ukraine (%)
Place of birth for the foreign-born population - Other Eastern Europe (%)
Place of birth for the foreign-born population - China (%)
Place of birth for the foreign-born population - Hong Kong (%)
Place of birth for the foreign-born population - Taiwan (%)
Place of birth for the foreign-born population - Japan (%)
Place of birth for the foreign-born population - Korea (%)
Place of birth for the foreign-born population - Other Eastern Asia (%)
Place of birth for the foreign-born population - Afghanistan (%)
Place of birth for the foreign-born population - Bangladesh (%)
Place of birth for the foreign-born population - India (%)
Place of birth for the foreign-born population - Iran (%)
Place of birth for the foreign-born population - Kazakhstan (%)
Place of birth for the foreign-born population - Nepal (%)
Place of birth for the foreign-born population - Pakistan (%)
Place of birth for the foreign-born population - Sri Lanka (%)
Place of birth for the foreign-born population - Uzbekistan (%)
Place of birth for the foreign-born population - Other South Central Asia (%)
Place of birth for the foreign-born population - Burma (%)
Place of birth for the foreign-born population - Cambodia (%)
Place of birth for the foreign-born population - Indonesia (%)
Place of birth for the foreign-born population - Laos (%)
Place of birth for the foreign-born population - Malaysia (%)
Place of birth for the foreign-born population - Philippines (%)
Place of birth for the foreign-born population - Singapore (%)
Place of birth for the foreign-born population - Thailand (%)
Place of birth for the foreign-born population - Vietnam (%)
Place of birth for the foreign-born population - Other South Eastern Asia (%)
Place of birth for the foreign-born population - Armenia (%)
Place of birth for the foreign-born population - Iraq (%)
Place of birth for the foreign-born population - Israel (%)
Place of birth for the foreign-born population - Jordan (%)
Place of birth for the foreign-born population - Kuwait (%)
Place of birth for the foreign-born population - Lebanon (%)
Place of birth for the foreign-born population - Saudi Arabia (%)
Place of birth for the foreign-born population - Syria (%)
Place of birth for the foreign-born population - Turkey (%)
Place of birth for the foreign-born population - Yemen (%)
Place of birth for the foreign-born population - Other Western Asia (%)
Place of birth for the foreign-born population - Eritrea (%)
Place of birth for the foreign-born population - Ethiopia (%)
Place of birth for the foreign-born population - Kenya (%)
Place of birth for the foreign-born population - Somalia (%)
Place of birth for the foreign-born population - Uganda (%)
Place of birth for the foreign-born population - Zimbabwe (%)
Place of birth for the foreign-born population - Other Eastern Africa (%)
Place of birth for the foreign-born population - Cameroon (%)
Place of birth for the foreign-born population - Congo (%)
Place of birth for the foreign-born population - Democratic Republic of Congo (Zaire) (%)
Place of birth for the foreign-born population - Other Middle Africa (%)
Place of birth for the foreign-born population - Egypt (%)
Place of birth for the foreign-born population - Morocco (%)
Place of birth for the foreign-born population - Sudan (%)
Place of birth for the foreign-born population - Other Northern Africa (%)
Place of birth for the foreign-born population - South Africa (%)
Place of birth for the foreign-born population - Other Southern Africa (%)
Place of birth for the foreign-born population - Cabo Verde (%)
Place of birth for the foreign-born population - Ghana (%)
Place of birth for the foreign-born population - Liberia (%)
Place of birth for the foreign-born population - Nigeria (%)
Place of birth for the foreign-born population - Senegal (%)
Place of birth for the foreign-born population - Sierra Leone (%)
Place of birth for the foreign-born population - Other Western Africa (%)
Place of birth for the foreign-born population - Australia (%)
Place of birth for the foreign-born population - New Zealand (%)
Place of birth for the foreign-born population - Fiji (%)
Place of birth for the foreign-born population - Micronesia (%)
Place of birth for the foreign-born population - Bahamas (%)
Place of birth for the foreign-born population - Barbados (%)
Place of birth for the foreign-born population - Cuba (%)
Place of birth for the foreign-born population - Dominica (%)
Place of birth for the foreign-born population - Dominican Republic (%)
Place of birth for the foreign-born population - Grenada (%)
Place of birth for the foreign-born population - Haiti (%)
Place of birth for the foreign-born population - Jamaica (%)
Place of birth for the foreign-born population - St. Vincent and the Grenadines (%)
Place of birth for the foreign-born population - Trinidad and Tobago (%)
Place of birth for the foreign-born population - West Indies (%)
Place of birth for the foreign-born population - Other Caribbean (%)
Place of birth for the foreign-born population - Belize (%)
Place of birth for the foreign-born population - Costa Rica (%)
Place of birth for the foreign-born population - El Salvador (%)
Place of birth for the foreign-born population - Guatemala (%)
Place of birth for the foreign-born population - Honduras (%)
Place of birth for the foreign-born population - Mexico (%)
Place of birth for the foreign-born population - Nicaragua (%)
Place of birth for the foreign-born population - Panama (%)
Place of birth for the foreign-born population - Other Central America (%)
Place of birth for the foreign-born population - Argentina (%)
Place of birth for the foreign-born population - Bolivia (%)
Place of birth for the foreign-born population - Brazil (%)
Place of birth for the foreign-born population - Chile (%)
Place of birth for the foreign-born population - Colombia (%)
Place of birth for the foreign-born population - Ecuador (%)
Place of birth for the foreign-born population - Guyana (%)
Place of birth for the foreign-born population - Peru (%)
Place of birth for the foreign-born population - Uruguay (%)
Place of birth for the foreign-born population - Venezuela (%)
Place of birth for the foreign-born population - Other South America (%)
Place of birth for the foreign-born population - Canada (%)
Place of birth for the foreign-born population - Other Northern America (%)
Place of birth for the foreign-born population - Other (%)
Latest news about races in Valparaiso, IN collected exclusively by city-data.com from local newspapers, TV, and radio stations
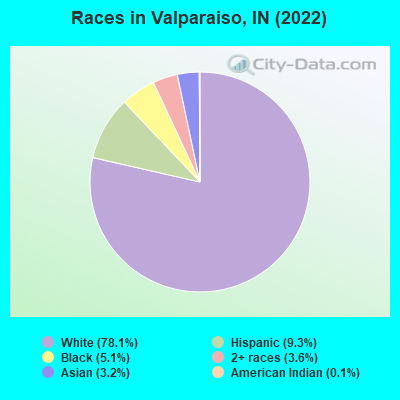
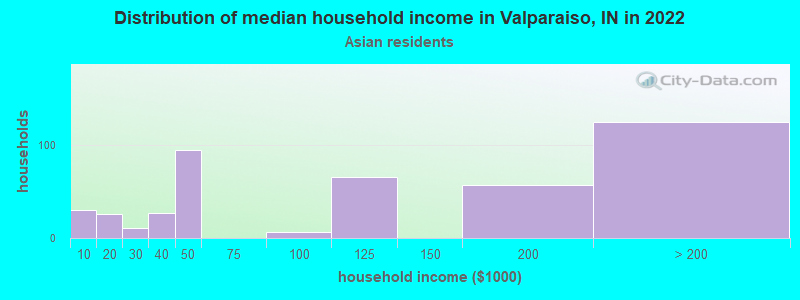
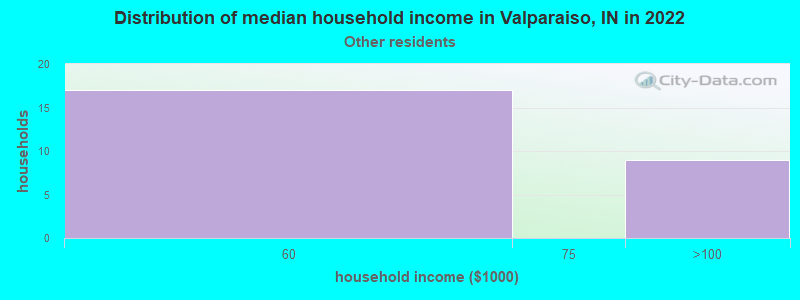
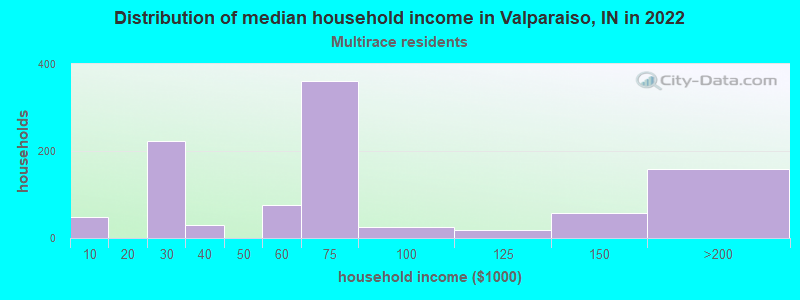
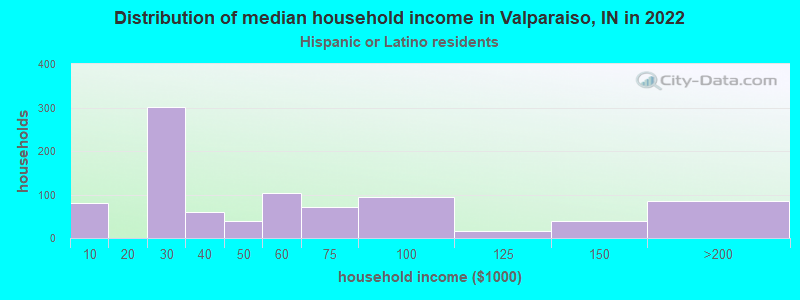
According to 2022 data, the most numerous races in Valparaiso, IN are White alone (26,777 residents), Black alone (1,734 residents), and Hispanic (3,188 residents). 90.9% of Valparaiso residents speak English at home. 7.2% of Valparaiso, IN residents are foreign-born (3.0% born in Asia, 1.8% born in Latin America, 1.4% born in Europe), which is 16.6% greater than the foreign-born rate of 6.0% across the entire state of Indiana.
Race distribution in Valparaiso
2000 2022
5,219,373 85.8% White alone 505,462 8.3% Black alone 214,536 3.5% Hispanic 61,115 1.0% Two or more races 58,424 1.0% Asian alone 13,654 0.2% American Indian alone 6,348 0.1% Other race alone 1,573 0.03% Native Hawaiian and Other
5,192,455 76.0% White alone 628,054 9.2% Black alone 534,528 7.8% Hispanic 263,242 3.9% Two or more races 172,880 2.5% Asian alone 33,467 0.5% Other race alone 5,866 0.09% American Indian alone 2,545 0.04% Native Hawaiian and Other
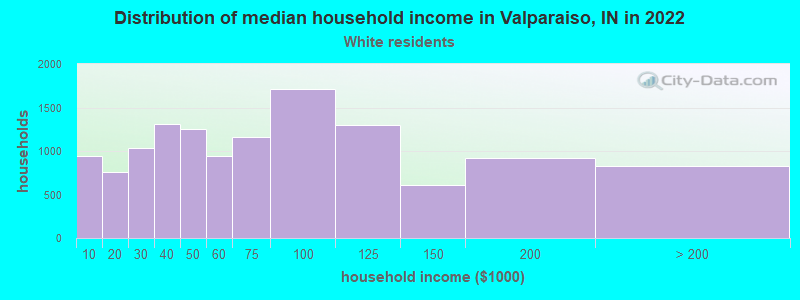
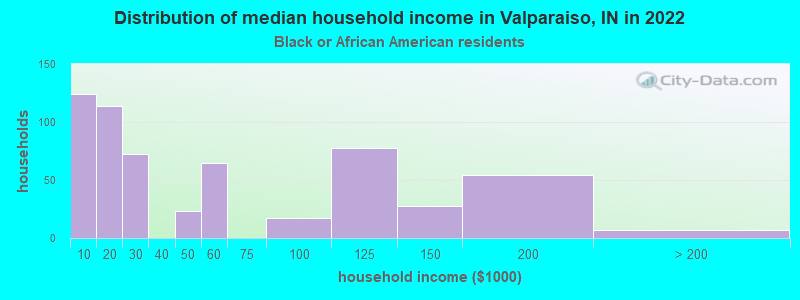
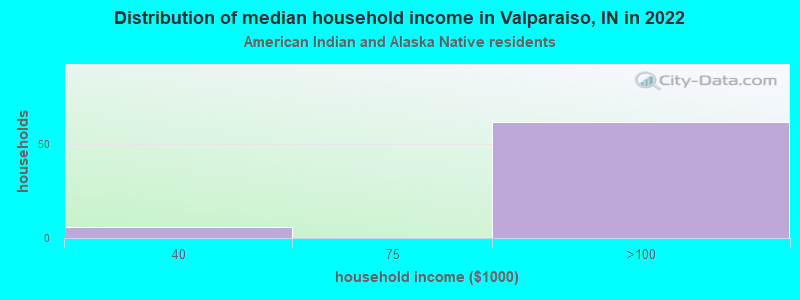
Income and house value in Valparaiso Median household income in 2022 $61,981 White non-Hispanic householders$44,002 Black householders$69,100 Two or more races householders$43,059 Hispanic or Latino race householdersMedian 2022 house value $252,613 White Non-Hispanic householders$287,773 Black or African American householders $348,886 Asian householders$276,472 Some other race householders$276,890 Two or more races householders$317,911 Hispanic or Latino householders
Median age by race in Valparaiso
39.4 Median age for White residents38.1 40.1 26.1 Median age for Black or African American residents24.6 27.9 41.7 Median age for American Indian / Alaska Native residents-654,255,318.5 36.1 36.3 Median age for Asian residents32.2 39.6 -666,666,666.0 Median age for Native Hawaiian / Pacific Islander residents-666,666,666.0 -666,666,666.0 25.7 Median age for Other race residents24.5 25.4 30.9 Median age for Two or more races residents27.6 39.0 40.0 Median age for White alone residents38.5 42.7 24.6 Median age for Hispanic or Latino residents27.9 25.4
Owner/renter occupied households by race in Valparaiso
House owners and renters - White residents 7,427 60.0% Owner occupied4,954 40.0% Renter occupiedHouse owners and renters - Black or African American residents 77 11.9% Owner occupied572 88.1% Renter occupiedHouse owners and renters - American Indian / Alaska Native residents 58 100.0% Renter occupiedHouse owners and renters - Asian residents 204 64.8% Owner occupied111 35.2% Renter occupiedHouse owners and renters - Other race residents 38 100.0% Owner occupiedHouse owners and renters - Two or more races residents 617 65.2% Owner occupied330 34.8% Renter occupiedHouse owners and renters - White alone residents 7,290 59.8% Owner occupied4,901 40.2% Renter occupiedHouse owners and renters - Hispanic or Latino residents 380 42.5% Owner occupied513 57.5% Renter occupied
Language usage in Valparaiso
English speakers - Total 90.9% of residents of Valparaiso speak English at home.
5.2% of residents speak Spanish at home 1,356 80.8% Speak English very well323 19.2% Speak English less than very well3.6% of residents speak other language at home 808 68.3% Speak English very well375 31.7% Speak English less than very well
English speakers - Born in the United States 92.5% of residents of Valparaiso speak English at home.
4.9% of residents speak Spanish at home 529 99.1% Speak English very well5 0.9% Speak English less than very well2.2% of residents speak other language at home 224 94.5% Speak English very well13 5.5% Speak English less than very well
English speakers - Native, born elsewhere 66.0% of residents of Valparaiso speak English at home.
10.0% of residents speak Spanish at home 15 100.0% Speak English very well
English speakers - Foreign-born 26.7% of residents of Valparaiso speak English at home.
25.5% of residents speak Spanish at home 300 56.6% Speak English very well230 43.4% Speak English less than very well47.3% of residents speak other language at home 607 61.9% Speak English very well374 38.1% Speak English less than very well
White (Caucasian) - Speak only English Native:
97.8% (25,256)Foreign-born:
53.7% (299)
White (Caucasian) - Speak another language Native:
2.2% (566)Foreign-born:
46.6% (259)
Black or African American - Speak only English Native:
98.5% (1,368)Foreign-born:
32.9% (67)
Black or African American - Speak another language Native:
1.3% (18)Foreign-born:
59.0% (121)
American Indian / Alaska Native - Speak only English Native:
84.9% (54)Foreign-born:
10.5% (5)
Asian - Speak only English Native:
56.7% (78)Foreign-born:
17.6% (159)
Asian - Speak another language Native:
91.8% (126)Foreign-born:
81.6% (736)
Other race - Speak only English Native:
66.2% (202)Foreign-born:
49.0% (38)
Other race - Speak another language Native:
34.1% (104)Foreign-born:
35.4% (27)
Two or more races - Speak another language Native:
24.1% (589)Foreign-born:
100.0% (329)
White alone - Speak only English Native:
98.9% (24,906)Foreign-born:
61.8% (281)
White alone - Speak another language Native:
1.1% (271)Foreign-born:
40.0% (182)
Hispanic or Latino - Speak only English Native:
63.5% (1,372)Foreign-born:
24.1% (143)
Hispanic or Latino - Speak another language Native:
38.6% (836)Foreign-born:
90.7% (537)
Foreign-born residents in Valparaiso 2,467 residents are foreign born (3.0% Asia , 1.8% Latin America , 1.4% Europe ).
This city:
7.2%Indiana:
5.6%
Marital status for residents in Valparaiso Marital status - White (Caucasian) population 15 years and over
Males 37.4% Never married46.3% Now married1.5% Separated3.2% Widowed11.7% DivorcedFemales 32.8% Never married41.2% Now married1.4% Separated12.5% Widowed12.0% DivorcedWomen who gave birth in the past 12 months Now married:
100.0% (258)Unmarried:
0.0% (0)
Women who did not give birth in the past 12 months Now married:
33.4% (2,294)Unmarried:
66.6% (4,575)
Marital status - Black or African American population 15 years and over
Males 64.9% Never married28.1% Now married0.0% Separated1.3% Widowed5.8% DivorcedFemales 67.5% Never married11.4% Now married0.7% Separated6.3% Widowed14.0% DivorcedWomen who gave birth in the past 12 months Now married:
100.0% (19)Unmarried:
0.0% (0)
Women who did not give birth in the past 12 months Now married:
8.1% (46)Unmarried:
91.9% (523)
Marital status - American Indian / Alaska Native population 15 years and over
Males 0.0% Never married100.0% Now married0.0% Separated0.0% Widowed0.0% DivorcedFemales 59.1% Never married40.9% Now married0.0% Separated0.0% Widowed0.0% DivorcedWomen who did not give birth in the past 12 months Now married:
40.9% (21)Unmarried:
59.1% (31)
Marital status - Asian population 15 years and over
Males 46.0% Never married45.8% Now married0.0% Separated0.0% Widowed8.1% DivorcedFemales 20.0% Never married32.6% Now married0.0% Separated25.7% Widowed21.7% DivorcedWomen who gave birth in the past 12 months Now married:
100.0% (17)Unmarried:
0.0% (0)
Women who did not give birth in the past 12 months Now married:
35.4% (100)Unmarried:
64.6% (182)
Marital status - Other race population 15 years and over
Males 56.3% Never married34.5% Now married0.0% Separated0.0% Widowed9.2% DivorcedFemales 51.3% Never married48.7% Now married0.0% Separated0.0% Widowed0.0% DivorcedWomen who did not give birth in the past 12 months Now married:
42.3% (53)Unmarried:
57.7% (73)
Marital status - Two or more races population 15 years and over
Males 42.8% Never married51.9% Now married0.0% Separated1.4% Widowed3.9% DivorcedFemales 41.4% Never married47.2% Now married2.1% Separated6.3% Widowed3.0% DivorcedWomen who did not give birth in the past 12 months Now married:
48.3% (548)Unmarried:
51.7% (587)
Marital status - White alone, not Hispanic / Latino population 15 years and over
Males 36.3% Never married47.7% Now married1.5% Separated3.3% Widowed11.2% DivorcedFemales 32.2% Never married40.8% Now married1.5% Separated12.9% Widowed12.6% DivorcedWomen who gave birth in the past 12 months Now married:
100.0% (204)Unmarried:
0.0% (0)
Women who did not give birth in the past 12 months Now married:
32.7% (2,152)Unmarried:
67.3% (4,427)
Marital status - Hispanic or Latino population 15 years and over
Males 53.0% Never married32.8% Now married0.0% Separated0.5% Widowed13.7% DivorcedFemales 50.2% Never married40.0% Now married0.0% Separated7.2% Widowed2.6% DivorcedWomen who gave birth in the past 12 months Now married:
100.0% (90)Unmarried:
0.0% (0)
Women who did not give birth in the past 12 months Now married:
32.8% (344)Unmarried:
67.2% (704)
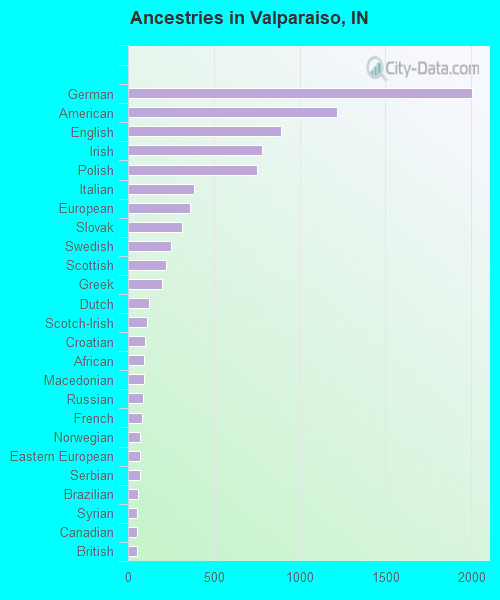
Ancestries in Valparaiso
2,003 14.3% German1,215 8.7% American894 6.4% English782 5.6% Irish751 5.3% Polish387 2.8% Italian359 2.6% European313 2.2% Slovak252 1.8% Swedish219 1.6% Scottish197 1.4% Greek120 0.9% Dutch113 0.8% Scotch-Irish101 0.7% Croatian95 0.7% African93 0.7% Macedonian88 0.6% Russian79 0.6% French72 0.5% Norwegian70 0.5% Eastern European69 0.5% Serbian57 0.4% Brazilian55 0.4% Syrian52 0.4% Canadian52 0.4% British49 0.3% Welsh46 0.3% Lithuanian46 0.3% Danish44 0.3% Ukrainian43 0.3% Hungarian43 0.3% Romanian39 0.3% French Canadian34 0.2% Nigerian33 0.2% Turkish28 0.2% Swiss27 0.2% Czech15 0.1% Belgian14 0.10% Lebanese14 0.10% Bulgarian12 0.09% Scandinavian10 0.07% Yugoslavian9 0.06% Palestinian7 0.05% Ugandan6 0.04% Czechoslovakian4 0.03% Bahamian
Geographical mobility in Valparaiso Same house 1 year ago 22,045 80.0% White (Caucasian)1,801 95.8% Black or African American80 62.2% American Indian / Alaska Native896 77.2% Asian243 62.6% Other race2,453 85.4% Two or more races21,379 80.6% White alone, not Hispanic / Latino2,459 78.0% Hispanic or LatinoMoved within same county 4,146 15.0% White / Caucasian16 0.9% Black or African American24 18.6% American Indian / Alaska Native131 11.3% Asian132 34.0% Other race187 6.5% Two or more races3,700 14.0% White alone, not Hispanic / Latino518 16.5% Hispanic or LatinoMoved within same state 785 2.8% White / Caucasian68 3.6% Black or African American12 9.0% American Indian / Alaska Native67 5.8% Asian63 2.2% Two or more races765 2.9% White alone, not Hispanic / Latino79 2.5% Hispanic or LatinoMoved from different state 665 2.4% White / Caucasian36 1.9% Black or African American15 1.3% Asian172 6.0% Two or more races1,465 5.5% White alone, not Hispanic / Latino144 4.6% Hispanic or LatinoMoved from abroad 105 0.4% White28 2.4% Asian105 0.4% White alone, not Hispanic / Latino
Children Nativity (place of birth) in Valparaiso
Children under 6 years - Living with two parents Both parents native 1,211 100.0% NativeBoth parents foreign-born 266 100.0% NativeOne native, one foreign-born parent 76 100.0% NativeChildren under 6 years - Living with one parent Native parent 426 100.0% NativeForeign-born parent 13 100.0% Foreign-bornChildren 6 to 17 years - Living with two parents Both parents native 2,616 100.0% NativeBoth parents foreign-born 305 80.3% Native75 19.7% Foreign-bornOne native, one foreign-born parent 98 100.0% NativeChildren 6 to 17 years - Living with one parent Native parent 1,061 98.9% Native12 1.1% Foreign-bornForeign-born parent 25 74.3% Native9 25.7% Foreign-born
Grandparents responsible for own grandchildren in Valparaiso
Grandparents (30 to 59 years) White / Caucasian 14 28.8% Responsible for grandchildren34 71.2% Not responsible for grandchildrenBlack or African American 32 100.0% Not responsible for grandchildrenWhite alone, not Hispanic / Latino 9 34.1% Responsible for grandchildren17 65.9% Not responsible for grandchildrenHispanic or Latino 6 23.5% Responsible for grandchildren21 76.5% Not responsible for grandchildrenGrandparents (60 years and over) White / Caucasian 36 63.4% Responsible for grandchildren21 36.6% Not responsible for grandchildrenWhite alone, not Hispanic / Latino 30 58.5% Responsible for grandchildren21 41.5% Not responsible for grandchildrenHispanic or Latino 3 100.0% Responsible for grandchildren