Races in Valdosta, Georgia (GA) Detailed Stats
Data:
Races - White alone (%)
Races - White alone (% change since 2000)
Races - Black alone (%)
Races - Black alone (% change since 2000)
Races - American Indian alone (%)
Races - American Indian alone (% change since 2000)
Races - Asian alone (%)
Races - Asian alone (% change since 2000)
Races - Hispanic (%)
Races - Hispanic (% change since 2000)
Races - Native Hawaiian and Other Pacific Islander alone (%)
Races - Native Hawaiian and Other Pacific Islander alone (% change since 2000)
Races - Two or more races(%)
Races - Two or more races(% change since 2000)
Races - Other race alone (%)
Races - Other race alone (% change since 2000)
Racial diversity
Place of birth - Born in state of residence (%)
Place of birth - Born in state of residence (%) - White
Place of birth - Born in state of residence (%) - Black or African American
Place of birth - Born in state of residence (%) - Asian
Place of birth - Born in state of residence (%) - Hispanic or Latino
Place of birth - Born in state of residence (%) - American Indian and Alaska Native
Place of birth - Born in state of residence (%) - Multirace
Place of birth - Born in state of residence (%) - Other Race
Place of birth - Born in other state (%)
Place of birth - Born in other state (%) - White
Place of birth - Born in other state (%) - Black or African American
Place of birth - Born in other state (%) - Asian
Place of birth - Born in other state (%) - Hispanic or Latino
Place of birth - Born in other state (%) - American Indian and Alaska Native
Place of birth - Born in other state (%) - Multirace
Place of birth - Born in other state (%) - Other Race
Place of birth - Native, outside of US (%)
Place of birth - Native, outside of US (%) - White
Place of birth - Native, outside of US (%) - Black or African American
Place of birth - Native, outside of US (%) - Asian
Place of birth - Native, outside of US (%) - Hispanic or Latino
Place of birth - Native, outside of US (%) - American Indian and Alaska Native
Place of birth - Native, outside of US (%) - Multirace
Place of birth - Native, outside of US (%) - Other Race
Place of birth - Foreign born (%)
Place of birth - Foreign born (%) - White
Place of birth - Foreign born (%) - Black or African American
Place of birth - Foreign born (%) - Asian
Place of birth - Foreign born (%) - Hispanic or Latino
Place of birth - Foreign born (%) - American Indian and Alaska Native
Place of birth - Foreign born (%) - Multirace
Place of birth - Foreign born (%) - Other Race
Residents speaking English at home (%)
Residents speaking English at home - Born in the United States (%)
Residents speaking English at home - Native, born elsewhere (%)
Residents speaking English at home - Foreign born (%)
Residents speaking Spanish at home (%)
Residents speaking Spanish at home - Born in the United States (%)
Residents speaking Spanish at home - Native, born elsewhere (%)
Residents speaking Spanish at home - Foreign born (%)
Residents speaking other language at home (%)
Residents speaking other language at home - Born in the United States (%)
Residents speaking other language at home - Native, born elsewhere (%)
Residents speaking other language at home - Foreign born (%)
Marital status - Never married (%)
Marital status - Now married (%)
Marital status - Separated (%)
Marital status - Widowed (%)
Marital status - Divorced (%)
Ancestries Reported - Arab (%)
Ancestries Reported - Czech (%)
Ancestries Reported - Danish (%)
Ancestries Reported - Dutch (%)
Ancestries Reported - English (%)
Ancestries Reported - French (%)
Ancestries Reported - French Canadian (%)
Ancestries Reported - German (%)
Ancestries Reported - Greek (%)
Ancestries Reported - Hungarian (%)
Ancestries Reported - Irish (%)
Ancestries Reported - Italian (%)
Ancestries Reported - Lithuanian (%)
Ancestries Reported - Norwegian (%)
Ancestries Reported - Polish (%)
Ancestries Reported - Portuguese (%)
Ancestries Reported - Russian (%)
Ancestries Reported - Scotch-Irish (%)
Ancestries Reported - Scottish (%)
Ancestries Reported - Slovak (%)
Ancestries Reported - Subsaharan African (%)
Ancestries Reported - Swedish (%)
Ancestries Reported - Swiss (%)
Ancestries Reported - Ukrainian (%)
Ancestries Reported - United States (%)
Ancestries Reported - Welsh (%)
Ancestries Reported - West Indian (%)
Ancestries Reported - Other (%)
Geographical mobility - Same house 1 year ago (%)
Geographical mobility - Same house 1 year ago (%) - White
Geographical mobility - Same house 1 year ago (%) - Black or African American
Geographical mobility - Same house 1 year ago (%) - Asian
Geographical mobility - Same house 1 year ago (%) - Hispanic or Latino
Geographical mobility - Same house 1 year ago (%) - American Indian and Alaska Native
Geographical mobility - Same house 1 year ago (%) - Multirace
Geographical mobility - Same house 1 year ago (%) - Other Race
Geographical mobility - Moved within same county (%)
Geographical mobility - Moved within same county (%) - White
Geographical mobility - Moved within same county (%) - Black or African American
Geographical mobility - Moved within same county (%) - Asian
Geographical mobility - Moved within same county (%) - Hispanic or Latino
Geographical mobility - Moved within same county (%) - American Indian and Alaska Native
Geographical mobility - Moved within same county (%) - Multirace
Geographical mobility - Moved within same county (%) - Other Race
Geographical mobility - Moved from different county within same state (%)
Geographical mobility - Moved from different county within same state (%) - White
Geographical mobility - Moved from different county within same state (%) - Black or African American
Geographical mobility - Moved from different county within same state (%) - Asian
Geographical mobility - Moved from different county within same state (%) - Hispanic or Latino
Geographical mobility - Moved from different county within same state (%) - American Indian and Alaska Native
Geographical mobility - Moved from different county within same state (%) - Multirace
Geographical mobility - Moved from different county within same state (%) - Other Race
Geographical mobility - Moved from different state (%)
Geographical mobility - Moved from different state (%) - White
Geographical mobility - Moved from different state (%) - Black or African American
Geographical mobility - Moved from different state (%) - Asian
Geographical mobility - Moved from different state (%) - Hispanic or Latino
Geographical mobility - Moved from different state (%) - American Indian and Alaska Native
Geographical mobility - Moved from different state (%) - Multirace
Geographical mobility - Moved from different state (%) - Other Race
Geographical mobility - Moved from abroad (%)
Geographical mobility - Moved from abroad (%) - White
Geographical mobility - Moved from abroad (%) - Black or African American
Geographical mobility - Moved from abroad (%) - Asian
Geographical mobility - Moved from abroad (%) - Hispanic or Latino
Geographical mobility - Moved from abroad (%) - American Indian and Alaska Native
Geographical mobility - Moved from abroad (%) - Multirace
Geographical mobility - Moved from abroad (%) - Other Race
Place of birth for the foreign-born population - Ireland (%)
Place of birth for the foreign-born population - Denmark (%)
Place of birth for the foreign-born population - Norway (%)
Place of birth for the foreign-born population - Sweden (%)
Place of birth for the foreign-born population - United Kingdom (%)
Place of birth for the foreign-born population - England (%)
Place of birth for the foreign-born population - Scotland (%)
Place of birth for the foreign-born population - Other Northern Europe (%)
Place of birth for the foreign-born population - Austria (%)
Place of birth for the foreign-born population - Belgium (%)
Place of birth for the foreign-born population - France (%)
Place of birth for the foreign-born population - Germany (%)
Place of birth for the foreign-born population - Netherlands (%)
Place of birth for the foreign-born population - Switzerland (%)
Place of birth for the foreign-born population - Other Western Europe (%)
Place of birth for the foreign-born population - Greece (%)
Place of birth for the foreign-born population - Italy (%)
Place of birth for the foreign-born population - Portugal (%)
Place of birth for the foreign-born population - Spain (%)
Place of birth for the foreign-born population - Other Southern Europe (%)
Place of birth for the foreign-born population - Albania (%)
Place of birth for the foreign-born population - Belarus (%)
Place of birth for the foreign-born population - Bosnia and Herzegovina (%)
Place of birth for the foreign-born population - Bulgaria (%)
Place of birth for the foreign-born population - Croatia (%)
Place of birth for the foreign-born population - Czechoslovakia (%)
Place of birth for the foreign-born population - Hungary (%)
Place of birth for the foreign-born population - Latvia (%)
Place of birth for the foreign-born population - Lithuania (%)
Place of birth for the foreign-born population - North Macedonia (Macedonia) (%)
Place of birth for the foreign-born population - Moldova (%)
Place of birth for the foreign-born population - Poland (%)
Place of birth for the foreign-born population - Romania (%)
Place of birth for the foreign-born population - Russia (%)
Place of birth for the foreign-born population - Serbia (%)
Place of birth for the foreign-born population - Ukraine (%)
Place of birth for the foreign-born population - Other Eastern Europe (%)
Place of birth for the foreign-born population - China (%)
Place of birth for the foreign-born population - Hong Kong (%)
Place of birth for the foreign-born population - Taiwan (%)
Place of birth for the foreign-born population - Japan (%)
Place of birth for the foreign-born population - Korea (%)
Place of birth for the foreign-born population - Other Eastern Asia (%)
Place of birth for the foreign-born population - Afghanistan (%)
Place of birth for the foreign-born population - Bangladesh (%)
Place of birth for the foreign-born population - India (%)
Place of birth for the foreign-born population - Iran (%)
Place of birth for the foreign-born population - Kazakhstan (%)
Place of birth for the foreign-born population - Nepal (%)
Place of birth for the foreign-born population - Pakistan (%)
Place of birth for the foreign-born population - Sri Lanka (%)
Place of birth for the foreign-born population - Uzbekistan (%)
Place of birth for the foreign-born population - Other South Central Asia (%)
Place of birth for the foreign-born population - Burma (%)
Place of birth for the foreign-born population - Cambodia (%)
Place of birth for the foreign-born population - Indonesia (%)
Place of birth for the foreign-born population - Laos (%)
Place of birth for the foreign-born population - Malaysia (%)
Place of birth for the foreign-born population - Philippines (%)
Place of birth for the foreign-born population - Singapore (%)
Place of birth for the foreign-born population - Thailand (%)
Place of birth for the foreign-born population - Vietnam (%)
Place of birth for the foreign-born population - Other South Eastern Asia (%)
Place of birth for the foreign-born population - Armenia (%)
Place of birth for the foreign-born population - Iraq (%)
Place of birth for the foreign-born population - Israel (%)
Place of birth for the foreign-born population - Jordan (%)
Place of birth for the foreign-born population - Kuwait (%)
Place of birth for the foreign-born population - Lebanon (%)
Place of birth for the foreign-born population - Saudi Arabia (%)
Place of birth for the foreign-born population - Syria (%)
Place of birth for the foreign-born population - Turkey (%)
Place of birth for the foreign-born population - Yemen (%)
Place of birth for the foreign-born population - Other Western Asia (%)
Place of birth for the foreign-born population - Eritrea (%)
Place of birth for the foreign-born population - Ethiopia (%)
Place of birth for the foreign-born population - Kenya (%)
Place of birth for the foreign-born population - Somalia (%)
Place of birth for the foreign-born population - Uganda (%)
Place of birth for the foreign-born population - Zimbabwe (%)
Place of birth for the foreign-born population - Other Eastern Africa (%)
Place of birth for the foreign-born population - Cameroon (%)
Place of birth for the foreign-born population - Congo (%)
Place of birth for the foreign-born population - Democratic Republic of Congo (Zaire) (%)
Place of birth for the foreign-born population - Other Middle Africa (%)
Place of birth for the foreign-born population - Egypt (%)
Place of birth for the foreign-born population - Morocco (%)
Place of birth for the foreign-born population - Sudan (%)
Place of birth for the foreign-born population - Other Northern Africa (%)
Place of birth for the foreign-born population - South Africa (%)
Place of birth for the foreign-born population - Other Southern Africa (%)
Place of birth for the foreign-born population - Cabo Verde (%)
Place of birth for the foreign-born population - Ghana (%)
Place of birth for the foreign-born population - Liberia (%)
Place of birth for the foreign-born population - Nigeria (%)
Place of birth for the foreign-born population - Senegal (%)
Place of birth for the foreign-born population - Sierra Leone (%)
Place of birth for the foreign-born population - Other Western Africa (%)
Place of birth for the foreign-born population - Australia (%)
Place of birth for the foreign-born population - New Zealand (%)
Place of birth for the foreign-born population - Fiji (%)
Place of birth for the foreign-born population - Micronesia (%)
Place of birth for the foreign-born population - Bahamas (%)
Place of birth for the foreign-born population - Barbados (%)
Place of birth for the foreign-born population - Cuba (%)
Place of birth for the foreign-born population - Dominica (%)
Place of birth for the foreign-born population - Dominican Republic (%)
Place of birth for the foreign-born population - Grenada (%)
Place of birth for the foreign-born population - Haiti (%)
Place of birth for the foreign-born population - Jamaica (%)
Place of birth for the foreign-born population - St. Vincent and the Grenadines (%)
Place of birth for the foreign-born population - Trinidad and Tobago (%)
Place of birth for the foreign-born population - West Indies (%)
Place of birth for the foreign-born population - Other Caribbean (%)
Place of birth for the foreign-born population - Belize (%)
Place of birth for the foreign-born population - Costa Rica (%)
Place of birth for the foreign-born population - El Salvador (%)
Place of birth for the foreign-born population - Guatemala (%)
Place of birth for the foreign-born population - Honduras (%)
Place of birth for the foreign-born population - Mexico (%)
Place of birth for the foreign-born population - Nicaragua (%)
Place of birth for the foreign-born population - Panama (%)
Place of birth for the foreign-born population - Other Central America (%)
Place of birth for the foreign-born population - Argentina (%)
Place of birth for the foreign-born population - Bolivia (%)
Place of birth for the foreign-born population - Brazil (%)
Place of birth for the foreign-born population - Chile (%)
Place of birth for the foreign-born population - Colombia (%)
Place of birth for the foreign-born population - Ecuador (%)
Place of birth for the foreign-born population - Guyana (%)
Place of birth for the foreign-born population - Peru (%)
Place of birth for the foreign-born population - Uruguay (%)
Place of birth for the foreign-born population - Venezuela (%)
Place of birth for the foreign-born population - Other South America (%)
Place of birth for the foreign-born population - Canada (%)
Place of birth for the foreign-born population - Other Northern America (%)
Place of birth for the foreign-born population - Other (%)
Latest news about races in Valdosta, GA collected exclusively by city-data.com from local newspapers, TV, and radio stations
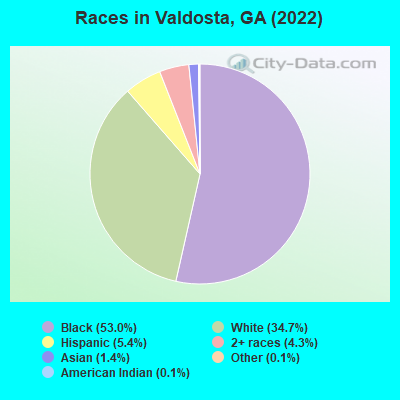
According to 2022 data, the most numerous races in Valdosta, GA are White alone (19,437 residents), Black alone (29,683 residents), and Hispanic (3,013 residents). 94.6% of Valdosta residents speak English at home. 3.1% of Valdosta, GA residents are foreign-born (1.3% born in Latin America, 1.0% born in Asia, 0.3% born in Europe), which is 223.1% less than the foreign-born rate of 10.0% across the entire state of Georgia.
Race distribution in Valdosta
2000 2022
5,128,661 62.6% White alone 2,331,465 28.5% Black alone 435,227 5.3% Hispanic 171,513 2.1% Asian alone 87,364 1.1% Two or more races 17,670 0.2% American Indian alone 11,275 0.1% Other race alone 3,278 0.04% Native Hawaiian and Other
5,415,657 49.6% White alone 3,349,240 30.7% Black alone 1,132,604 10.4% Hispanic 479,156 4.4% Asian alone 462,923 4.2% Two or more races 54,416 0.5% Other race alone 11,923 0.1% American Indian alone 6,957 0.06% Native Hawaiian and Other
Income and house value in Valdosta Median household income in 2022 $57,206 White non-Hispanic householders$38,461 Black householders$16,804 American Indian and Alaska Native householders$108,459 Asian householders$29,962 Some other race householders$66,141 Two or more races householders$49,935 Hispanic or Latino race householdersMedian 2022 house value $213,688 White Non-Hispanic householders$112,137 Black or African American householders$405,122 American Indian or Alaska Native householders $162,049 Asian householders$118,835 Some other race householders$300,547 Two or more races householders$177,821 Hispanic or Latino householders
Median age by race in Valdosta
34.9 Median age for White residents32.0 36.0 27.5 Median age for Black or African American residents24.7 31.2 19.0 Median age for American Indian / Alaska Native residents19.3 15.6 21.4 Median age for Asian residents25.3 34.4 22.4 Median age for Native Hawaiian / Pacific Islander residents-693,227,090.9 26.4 29.4 Median age for Other race residents29.6 29.3 26.4 Median age for Two or more races residents26.1 24.7 36.0 Median age for White alone residents32.0 38.6 25.4 Median age for Hispanic or Latino residents25.4 25.9
Owner/renter occupied households by race in Valdosta
House owners and renters - White residents 5,014 55.2% Owner occupied4,071 44.8% Renter occupiedHouse owners and renters - Black or African American residents 3,635 31.6% Owner occupied7,872 68.4% Renter occupiedHouse owners and renters - American Indian / Alaska Native residents 37 46.4% Owner occupied42 53.6% Renter occupiedHouse owners and renters - Asian residents 158 48.2% Owner occupied170 51.8% Renter occupiedHouse owners and renters - Native Hawaiian / Pacific Islander residents 30 70.1% Owner occupied13 29.9% Renter occupiedHouse owners and renters - Other race residents 78 23.8% Owner occupied251 76.2% Renter occupiedHouse owners and renters - Two or more races residents 399 31.2% Owner occupied878 68.8% Renter occupiedHouse owners and renters - White alone residents 4,996 56.9% Owner occupied3,781 43.1% Renter occupiedHouse owners and renters - Hispanic or Latino residents 292 26.6% Owner occupied803 73.4% Renter occupied
Language usage in Valdosta
English speakers - Total 94.6% of residents of Valdosta speak English at home.
3.0% of residents speak Spanish at home 1,103 70.8% Speak English very well454 29.2% Speak English less than very well2.5% of residents speak other language at home 1,048 78.8% Speak English very well282 21.2% Speak English less than very well
English speakers - Born in the United States 95.4% of residents of Valdosta speak English at home.
3.1% of residents speak Spanish at home 543 89.2% Speak English very well66 10.8% Speak English less than very well2.5% of residents speak other language at home 449 94.1% Speak English very well28 5.9% Speak English less than very well
English speakers - Native, born elsewhere 72.4% of residents of Valdosta speak English at home.
26.6% of residents speak Spanish at home 85 83.3% Speak English very well17 16.7% Speak English less than very well4.4% of residents speak other language at home 17 100.0% Speak English very well
English speakers - Foreign-born 33.2% of residents of Valdosta speak English at home.
29.8% of residents speak Spanish at home 235 43.2% Speak English very well309 56.8% Speak English less than very well37.6% of residents speak other language at home 435 63.2% Speak English very well253 36.8% Speak English less than very well
White (Caucasian) - Speak only English Native:
97.5% (18,488)Foreign-born:
79.8% (205)
White (Caucasian) - Speak another language Native:
2.3% (443)Foreign-born:
51.4% (132)
Black or African American - Speak only English Native:
99.0% (27,898)Foreign-born:
76.7% (226)
Black or African American - Speak another language Native:
0.9% (242)Foreign-born:
22.0% (65)
American Indian / Alaska Native - Speak another language Native:
32.0% (40)Foreign-born:
100.0% (31)
Asian - Speak only English Native:
100.0% (273)Foreign-born:
9.8% (52)
Other race - Speak only English Native:
30.2% (247)Foreign-born:
18.8% (36)
Other race - Speak another language Native:
70.0% (571)Foreign-born:
82.9% (156)
Two or more races - Speak only English Native:
82.7% (2,341)Foreign-born:
20.1% (85)
Two or more races - Speak another language Native:
17.3% (490)Foreign-born:
80.2% (339)
White alone - Speak only English Native:
97.9% (17,999)Foreign-born:
75.0% (220)
White alone - Speak another language Native:
2.2% (408)Foreign-born:
30.8% (90)
Hispanic or Latino - Speak only English Native:
64.0% (1,405)Foreign-born:
7.6% (50)
Hispanic or Latino - Speak another language Native:
35.8% (785)Foreign-born:
82.3% (542)
Foreign-born residents in Valdosta 1,732 residents are foreign born (1.3% Latin America , 1.0% Asia , 0.3% Europe ).
This city:
3.1%Georgia:
10.4%
Marital status for residents in Valdosta Marital status - White (Caucasian) population 15 years and over
Males 38.4% Never married46.9% Now married2.1% Separated5.1% Widowed7.5% DivorcedFemales 36.8% Never married37.7% Now married2.4% Separated9.3% Widowed13.9% DivorcedWomen who gave birth in the past 12 months Now married:
95.3% (296)Unmarried:
4.7% (15)
Women who did not give birth in the past 12 months Now married:
31.9% (1,698)Unmarried:
68.1% (3,619)
Marital status - Black or African American population 15 years and over
Males 62.1% Never married23.3% Now married2.2% Separated5.9% Widowed6.5% DivorcedFemales 52.7% Never married18.6% Now married3.8% Separated10.0% Widowed15.0% DivorcedWomen who gave birth in the past 12 months Now married:
16.0% (85)Unmarried:
84.0% (447)
Women who did not give birth in the past 12 months Now married:
19.7% (1,550)Unmarried:
80.3% (6,328)
Marital status - American Indian / Alaska Native population 15 years and over
Males 59.5% Never married33.8% Now married6.8% Separated0.0% Widowed0.0% DivorcedFemales 56.5% Never married17.4% Now married26.1% Separated0.0% Widowed0.0% DivorcedWomen who did not give birth in the past 12 months Now married:
43.5% (16)Unmarried:
56.5% (21)
Marital status - Asian population 15 years and over
Males 44.4% Never married53.0% Now married0.0% Separated2.6% Widowed0.0% DivorcedFemales 22.9% Never married70.8% Now married0.0% Separated2.8% Widowed3.5% DivorcedWomen who gave birth in the past 12 months Now married:
0.0% (0)Unmarried:
100.0% (46)
Women who did not give birth in the past 12 months Now married:
70.5% (171)Unmarried:
29.5% (71)
Marital status - Native Hawaiian / Pacific Islander population 15 years and over
Males 100.0% Never married0.0% Now married0.0% Separated0.0% Widowed0.0% DivorcedFemales 75.8% Never married24.2% Now married0.0% Separated0.0% Widowed0.0% DivorcedWomen who did not give birth in the past 12 months Now married:
0.0% (0)Unmarried:
100.0% (73)
Marital status - Other race population 15 years and over
Males 24.4% Never married65.5% Now married6.2% Separated0.0% Widowed3.9% DivorcedFemales 23.3% Never married53.2% Now married2.8% Separated16.1% Widowed4.7% DivorcedWomen who gave birth in the past 12 months Now married:
100.0% (38)Unmarried:
0.0% (0)
Women who did not give birth in the past 12 months Now married:
64.3% (187)Unmarried:
35.7% (104)
Marital status - Two or more races population 15 years and over
Males 49.5% Never married43.8% Now married0.0% Separated0.0% Widowed6.8% DivorcedFemales 35.4% Never married48.2% Now married3.2% Separated2.8% Widowed10.4% DivorcedWomen who gave birth in the past 12 months Now married:
35.5% (16)Unmarried:
64.5% (30)
Women who did not give birth in the past 12 months Now married:
49.0% (281)Unmarried:
51.0% (293)
Marital status - White alone, not Hispanic / Latino population 15 years and over
Males 38.3% Never married47.2% Now married2.1% Separated4.7% Widowed7.6% DivorcedFemales 35.9% Never married38.3% Now married2.1% Separated9.6% Widowed14.1% DivorcedWomen who gave birth in the past 12 months Now married:
100.0% (266)Unmarried:
0.0% (0)
Women who did not give birth in the past 12 months Now married:
32.8% (1,636)Unmarried:
67.2% (3,356)
Marital status - Hispanic or Latino population 15 years and over
Males 32.2% Never married59.2% Now married2.4% Separated4.0% Widowed2.2% DivorcedFemales 43.9% Never married40.4% Now married4.4% Separated4.4% Widowed6.9% DivorcedWomen who gave birth in the past 12 months Now married:
53.2% (86)Unmarried:
46.8% (76)
Women who did not give birth in the past 12 months Now married:
40.7% (370)Unmarried:
59.3% (538)
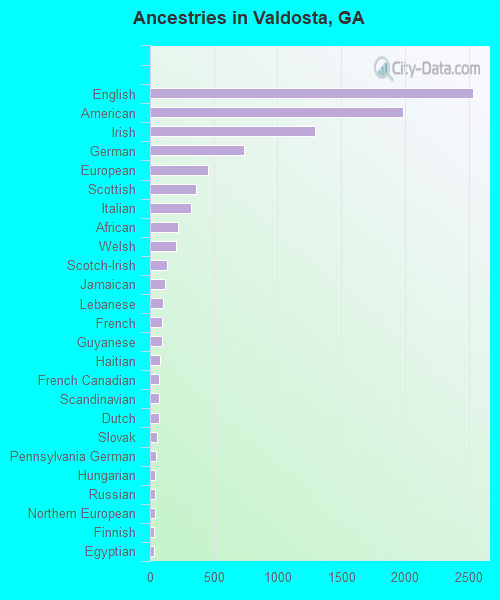
Ancestries in Valdosta
2,533 7.0% English1,987 5.5% American1,297 3.6% Irish739 2.0% German456 1.3% European359 1.0% Scottish324 0.9% Italian222 0.6% African201 0.6% Welsh134 0.4% Scotch-Irish114 0.3% Jamaican99 0.3% Lebanese95 0.3% French91 0.3% Guyanese80 0.2% Haitian71 0.2% French Canadian70 0.2% Scandinavian67 0.2% Dutch57 0.2% Slovak50 0.1% Pennsylvania German42 0.1% Hungarian37 0.1% Russian37 0.1% Northern European33 0.09% Finnish30 0.08% Egyptian28 0.08% Nigerian27 0.07% Greek25 0.07% Polish21 0.06% Eastern European19 0.05% Dutch West Indian18 0.05% Czech17 0.05% Austrian16 0.04% Portuguese16 0.04% Belizean8 0.02% Norwegian2 0.01% British2 0.01% Swiss2 0.01% Bahamian
Geographical mobility in Valdosta Same house 1 year ago 14,581 72.8% White (Caucasian)25,927 87.9% Black or African American163 88.5% American Indian / Alaska Native776 94.7% Asian121 91.6% Native Hawaiian / Pacific Islander657 62.3% Other race2,945 76.1% Two or more races14,048 72.7% White alone, not Hispanic / Latino2,278 77.7% Hispanic or LatinoMoved within same county 2,365 11.8% White / Caucasian2,158 7.3% Black or African American17 9.1% American Indian / Alaska Native25 18.5% Native Hawaiian / Pacific Islander146 13.9% Other race475 12.3% Two or more races2,338 12.1% White alone, not Hispanic / Latino123 4.2% Hispanic or LatinoMoved within same state 2,791 13.9% White / Caucasian1,288 4.4% Black or African American2 1.0% American Indian / Alaska Native123 11.7% Other race73 1.9% Two or more races2,622 13.6% White alone, not Hispanic / Latino408 13.9% Hispanic or LatinoMoved from different state 812 4.1% White / Caucasian730 2.5% Black or African American40 4.9% Asian54 5.1% Other race97 2.5% Two or more races854 4.4% White alone, not Hispanic / Latino115 3.9% Hispanic or LatinoMoved from abroad 181 0.9% White10 1.3% Asian77 7.3% Other race139 0.7% White alone, not Hispanic / Latino53 1.8% Hispanic or Latino
Children Nativity (place of birth) in Valdosta
Children under 6 years - Living with two parents Both parents native 1,598 100.0% NativeBoth parents foreign-born 118 100.0% NativeOne native, one foreign-born parent 160 100.0% NativeChildren under 6 years - Living with one parent Native parent 2,156 100.0% NativeForeign-born parent 16 100.0% NativeChildren 6 to 17 years - Living with two parents Both parents native 2,213 100.0% NativeBoth parents foreign-born 156 100.0% NativeOne native, one foreign-born parent 492 100.0% NativeChildren 6 to 17 years - Living with one parent Native parent 4,202 100.0% NativeForeign-born parent 87 55.5% Native70 44.5% Foreign-born
Grandparents responsible for own grandchildren in Valdosta
Grandparents (30 to 59 years) White / Caucasian 32 100.0% Not responsible for grandchildrenBlack or African American 155 51.6% Responsible for grandchildren146 48.4% Not responsible for grandchildrenTwo or more races 12 100.0% Not responsible for grandchildrenWhite alone, not Hispanic / Latino 34 100.0% Not responsible for grandchildrenGrandparents (60 years and over) White / Caucasian 21 28.4% Responsible for grandchildren54 71.6% Not responsible for grandchildrenBlack or African American 225 47.1% Responsible for grandchildren252 52.9% Not responsible for grandchildrenWhite alone, not Hispanic / Latino 22 27.4% Responsible for grandchildren57 72.6% Not responsible for grandchildren