Races in Unionville, North Carolina (NC) Detailed Stats
Data:
Races - White alone (%)
Races - White alone (% change since 2000)
Races - Black alone (%)
Races - Black alone (% change since 2000)
Races - American Indian alone (%)
Races - American Indian alone (% change since 2000)
Races - Asian alone (%)
Races - Asian alone (% change since 2000)
Races - Hispanic (%)
Races - Hispanic (% change since 2000)
Races - Native Hawaiian and Other Pacific Islander alone (%)
Races - Native Hawaiian and Other Pacific Islander alone (% change since 2000)
Races - Two or more races(%)
Races - Two or more races(% change since 2000)
Races - Other race alone (%)
Races - Other race alone (% change since 2000)
Racial diversity
Place of birth - Born in state of residence (%)
Place of birth - Born in state of residence (%) - White
Place of birth - Born in state of residence (%) - Black or African American
Place of birth - Born in state of residence (%) - Asian
Place of birth - Born in state of residence (%) - Hispanic or Latino
Place of birth - Born in state of residence (%) - American Indian and Alaska Native
Place of birth - Born in state of residence (%) - Multirace
Place of birth - Born in state of residence (%) - Other Race
Place of birth - Born in other state (%)
Place of birth - Born in other state (%) - White
Place of birth - Born in other state (%) - Black or African American
Place of birth - Born in other state (%) - Asian
Place of birth - Born in other state (%) - Hispanic or Latino
Place of birth - Born in other state (%) - American Indian and Alaska Native
Place of birth - Born in other state (%) - Multirace
Place of birth - Born in other state (%) - Other Race
Place of birth - Native, outside of US (%)
Place of birth - Native, outside of US (%) - White
Place of birth - Native, outside of US (%) - Black or African American
Place of birth - Native, outside of US (%) - Asian
Place of birth - Native, outside of US (%) - Hispanic or Latino
Place of birth - Native, outside of US (%) - American Indian and Alaska Native
Place of birth - Native, outside of US (%) - Multirace
Place of birth - Native, outside of US (%) - Other Race
Place of birth - Foreign born (%)
Place of birth - Foreign born (%) - White
Place of birth - Foreign born (%) - Black or African American
Place of birth - Foreign born (%) - Asian
Place of birth - Foreign born (%) - Hispanic or Latino
Place of birth - Foreign born (%) - American Indian and Alaska Native
Place of birth - Foreign born (%) - Multirace
Place of birth - Foreign born (%) - Other Race
Residents speaking English at home (%)
Residents speaking English at home - Born in the United States (%)
Residents speaking English at home - Native, born elsewhere (%)
Residents speaking English at home - Foreign born (%)
Residents speaking Spanish at home (%)
Residents speaking Spanish at home - Born in the United States (%)
Residents speaking Spanish at home - Native, born elsewhere (%)
Residents speaking Spanish at home - Foreign born (%)
Residents speaking other language at home (%)
Residents speaking other language at home - Born in the United States (%)
Residents speaking other language at home - Native, born elsewhere (%)
Residents speaking other language at home - Foreign born (%)
Marital status - Never married (%)
Marital status - Now married (%)
Marital status - Separated (%)
Marital status - Widowed (%)
Marital status - Divorced (%)
Ancestries Reported - Arab (%)
Ancestries Reported - Czech (%)
Ancestries Reported - Danish (%)
Ancestries Reported - Dutch (%)
Ancestries Reported - English (%)
Ancestries Reported - French (%)
Ancestries Reported - French Canadian (%)
Ancestries Reported - German (%)
Ancestries Reported - Greek (%)
Ancestries Reported - Hungarian (%)
Ancestries Reported - Irish (%)
Ancestries Reported - Italian (%)
Ancestries Reported - Lithuanian (%)
Ancestries Reported - Norwegian (%)
Ancestries Reported - Polish (%)
Ancestries Reported - Portuguese (%)
Ancestries Reported - Russian (%)
Ancestries Reported - Scotch-Irish (%)
Ancestries Reported - Scottish (%)
Ancestries Reported - Slovak (%)
Ancestries Reported - Subsaharan African (%)
Ancestries Reported - Swedish (%)
Ancestries Reported - Swiss (%)
Ancestries Reported - Ukrainian (%)
Ancestries Reported - United States (%)
Ancestries Reported - Welsh (%)
Ancestries Reported - West Indian (%)
Ancestries Reported - Other (%)
Geographical mobility - Same house 1 year ago (%)
Geographical mobility - Same house 1 year ago (%) - White
Geographical mobility - Same house 1 year ago (%) - Black or African American
Geographical mobility - Same house 1 year ago (%) - Asian
Geographical mobility - Same house 1 year ago (%) - Hispanic or Latino
Geographical mobility - Same house 1 year ago (%) - American Indian and Alaska Native
Geographical mobility - Same house 1 year ago (%) - Multirace
Geographical mobility - Same house 1 year ago (%) - Other Race
Geographical mobility - Moved within same county (%)
Geographical mobility - Moved within same county (%) - White
Geographical mobility - Moved within same county (%) - Black or African American
Geographical mobility - Moved within same county (%) - Asian
Geographical mobility - Moved within same county (%) - Hispanic or Latino
Geographical mobility - Moved within same county (%) - American Indian and Alaska Native
Geographical mobility - Moved within same county (%) - Multirace
Geographical mobility - Moved within same county (%) - Other Race
Geographical mobility - Moved from different county within same state (%)
Geographical mobility - Moved from different county within same state (%) - White
Geographical mobility - Moved from different county within same state (%) - Black or African American
Geographical mobility - Moved from different county within same state (%) - Asian
Geographical mobility - Moved from different county within same state (%) - Hispanic or Latino
Geographical mobility - Moved from different county within same state (%) - American Indian and Alaska Native
Geographical mobility - Moved from different county within same state (%) - Multirace
Geographical mobility - Moved from different county within same state (%) - Other Race
Geographical mobility - Moved from different state (%)
Geographical mobility - Moved from different state (%) - White
Geographical mobility - Moved from different state (%) - Black or African American
Geographical mobility - Moved from different state (%) - Asian
Geographical mobility - Moved from different state (%) - Hispanic or Latino
Geographical mobility - Moved from different state (%) - American Indian and Alaska Native
Geographical mobility - Moved from different state (%) - Multirace
Geographical mobility - Moved from different state (%) - Other Race
Geographical mobility - Moved from abroad (%)
Geographical mobility - Moved from abroad (%) - White
Geographical mobility - Moved from abroad (%) - Black or African American
Geographical mobility - Moved from abroad (%) - Asian
Geographical mobility - Moved from abroad (%) - Hispanic or Latino
Geographical mobility - Moved from abroad (%) - American Indian and Alaska Native
Geographical mobility - Moved from abroad (%) - Multirace
Geographical mobility - Moved from abroad (%) - Other Race
Place of birth for the foreign-born population - Ireland (%)
Place of birth for the foreign-born population - Denmark (%)
Place of birth for the foreign-born population - Norway (%)
Place of birth for the foreign-born population - Sweden (%)
Place of birth for the foreign-born population - United Kingdom (%)
Place of birth for the foreign-born population - England (%)
Place of birth for the foreign-born population - Scotland (%)
Place of birth for the foreign-born population - Other Northern Europe (%)
Place of birth for the foreign-born population - Austria (%)
Place of birth for the foreign-born population - Belgium (%)
Place of birth for the foreign-born population - France (%)
Place of birth for the foreign-born population - Germany (%)
Place of birth for the foreign-born population - Netherlands (%)
Place of birth for the foreign-born population - Switzerland (%)
Place of birth for the foreign-born population - Other Western Europe (%)
Place of birth for the foreign-born population - Greece (%)
Place of birth for the foreign-born population - Italy (%)
Place of birth for the foreign-born population - Portugal (%)
Place of birth for the foreign-born population - Spain (%)
Place of birth for the foreign-born population - Other Southern Europe (%)
Place of birth for the foreign-born population - Albania (%)
Place of birth for the foreign-born population - Belarus (%)
Place of birth for the foreign-born population - Bosnia and Herzegovina (%)
Place of birth for the foreign-born population - Bulgaria (%)
Place of birth for the foreign-born population - Croatia (%)
Place of birth for the foreign-born population - Czechoslovakia (%)
Place of birth for the foreign-born population - Hungary (%)
Place of birth for the foreign-born population - Latvia (%)
Place of birth for the foreign-born population - Lithuania (%)
Place of birth for the foreign-born population - North Macedonia (Macedonia) (%)
Place of birth for the foreign-born population - Moldova (%)
Place of birth for the foreign-born population - Poland (%)
Place of birth for the foreign-born population - Romania (%)
Place of birth for the foreign-born population - Russia (%)
Place of birth for the foreign-born population - Serbia (%)
Place of birth for the foreign-born population - Ukraine (%)
Place of birth for the foreign-born population - Other Eastern Europe (%)
Place of birth for the foreign-born population - China (%)
Place of birth for the foreign-born population - Hong Kong (%)
Place of birth for the foreign-born population - Taiwan (%)
Place of birth for the foreign-born population - Japan (%)
Place of birth for the foreign-born population - Korea (%)
Place of birth for the foreign-born population - Other Eastern Asia (%)
Place of birth for the foreign-born population - Afghanistan (%)
Place of birth for the foreign-born population - Bangladesh (%)
Place of birth for the foreign-born population - India (%)
Place of birth for the foreign-born population - Iran (%)
Place of birth for the foreign-born population - Kazakhstan (%)
Place of birth for the foreign-born population - Nepal (%)
Place of birth for the foreign-born population - Pakistan (%)
Place of birth for the foreign-born population - Sri Lanka (%)
Place of birth for the foreign-born population - Uzbekistan (%)
Place of birth for the foreign-born population - Other South Central Asia (%)
Place of birth for the foreign-born population - Burma (%)
Place of birth for the foreign-born population - Cambodia (%)
Place of birth for the foreign-born population - Indonesia (%)
Place of birth for the foreign-born population - Laos (%)
Place of birth for the foreign-born population - Malaysia (%)
Place of birth for the foreign-born population - Philippines (%)
Place of birth for the foreign-born population - Singapore (%)
Place of birth for the foreign-born population - Thailand (%)
Place of birth for the foreign-born population - Vietnam (%)
Place of birth for the foreign-born population - Other South Eastern Asia (%)
Place of birth for the foreign-born population - Armenia (%)
Place of birth for the foreign-born population - Iraq (%)
Place of birth for the foreign-born population - Israel (%)
Place of birth for the foreign-born population - Jordan (%)
Place of birth for the foreign-born population - Kuwait (%)
Place of birth for the foreign-born population - Lebanon (%)
Place of birth for the foreign-born population - Saudi Arabia (%)
Place of birth for the foreign-born population - Syria (%)
Place of birth for the foreign-born population - Turkey (%)
Place of birth for the foreign-born population - Yemen (%)
Place of birth for the foreign-born population - Other Western Asia (%)
Place of birth for the foreign-born population - Eritrea (%)
Place of birth for the foreign-born population - Ethiopia (%)
Place of birth for the foreign-born population - Kenya (%)
Place of birth for the foreign-born population - Somalia (%)
Place of birth for the foreign-born population - Uganda (%)
Place of birth for the foreign-born population - Zimbabwe (%)
Place of birth for the foreign-born population - Other Eastern Africa (%)
Place of birth for the foreign-born population - Cameroon (%)
Place of birth for the foreign-born population - Congo (%)
Place of birth for the foreign-born population - Democratic Republic of Congo (Zaire) (%)
Place of birth for the foreign-born population - Other Middle Africa (%)
Place of birth for the foreign-born population - Egypt (%)
Place of birth for the foreign-born population - Morocco (%)
Place of birth for the foreign-born population - Sudan (%)
Place of birth for the foreign-born population - Other Northern Africa (%)
Place of birth for the foreign-born population - South Africa (%)
Place of birth for the foreign-born population - Other Southern Africa (%)
Place of birth for the foreign-born population - Cabo Verde (%)
Place of birth for the foreign-born population - Ghana (%)
Place of birth for the foreign-born population - Liberia (%)
Place of birth for the foreign-born population - Nigeria (%)
Place of birth for the foreign-born population - Senegal (%)
Place of birth for the foreign-born population - Sierra Leone (%)
Place of birth for the foreign-born population - Other Western Africa (%)
Place of birth for the foreign-born population - Australia (%)
Place of birth for the foreign-born population - New Zealand (%)
Place of birth for the foreign-born population - Fiji (%)
Place of birth for the foreign-born population - Micronesia (%)
Place of birth for the foreign-born population - Bahamas (%)
Place of birth for the foreign-born population - Barbados (%)
Place of birth for the foreign-born population - Cuba (%)
Place of birth for the foreign-born population - Dominica (%)
Place of birth for the foreign-born population - Dominican Republic (%)
Place of birth for the foreign-born population - Grenada (%)
Place of birth for the foreign-born population - Haiti (%)
Place of birth for the foreign-born population - Jamaica (%)
Place of birth for the foreign-born population - St. Vincent and the Grenadines (%)
Place of birth for the foreign-born population - Trinidad and Tobago (%)
Place of birth for the foreign-born population - West Indies (%)
Place of birth for the foreign-born population - Other Caribbean (%)
Place of birth for the foreign-born population - Belize (%)
Place of birth for the foreign-born population - Costa Rica (%)
Place of birth for the foreign-born population - El Salvador (%)
Place of birth for the foreign-born population - Guatemala (%)
Place of birth for the foreign-born population - Honduras (%)
Place of birth for the foreign-born population - Mexico (%)
Place of birth for the foreign-born population - Nicaragua (%)
Place of birth for the foreign-born population - Panama (%)
Place of birth for the foreign-born population - Other Central America (%)
Place of birth for the foreign-born population - Argentina (%)
Place of birth for the foreign-born population - Bolivia (%)
Place of birth for the foreign-born population - Brazil (%)
Place of birth for the foreign-born population - Chile (%)
Place of birth for the foreign-born population - Colombia (%)
Place of birth for the foreign-born population - Ecuador (%)
Place of birth for the foreign-born population - Guyana (%)
Place of birth for the foreign-born population - Peru (%)
Place of birth for the foreign-born population - Uruguay (%)
Place of birth for the foreign-born population - Venezuela (%)
Place of birth for the foreign-born population - Other South America (%)
Place of birth for the foreign-born population - Canada (%)
Place of birth for the foreign-born population - Other Northern America (%)
Place of birth for the foreign-born population - Other (%)
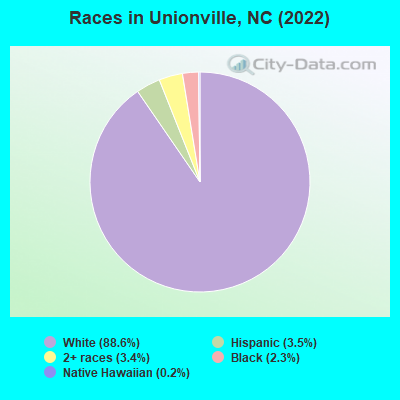
According to 2022 data, the most numerous races in Unionville, NC are White alone (6,154 residents), Black alone (161 residents), and Hispanic (246 residents). 94.4% of Unionville residents speak English at home. 1.7% of Unionville, NC residents are foreign-born , which is 366.8% less than the foreign-born rate of 8.0% across the entire state of North Carolina.
Race distribution in Unionville
2000 2022
5,647,155 70.2% White alone 1,723,301 21.4% Black alone 378,963 4.7% Hispanic 112,416 1.4% Asian alone 95,333 1.2% American Indian alone 79,965 1.0% Two or more races 9,015 0.1% Other race alone 3,165 0.04% Native Hawaiian and Other
6,497,519 60.7% White alone 2,155,650 20.1% Black alone 1,114,799 10.4% Hispanic 438,061 4.1% Two or more races 341,052 3.2% Asian alone 91,758 0.9% American Indian alone 50,180 0.5% Other race alone 9,954 0.09% Native Hawaiian and Other
Income and house value in Unionville Median household income in 2022 $81,312 White non-Hispanic householdersMedian 2022 house value $379,787 White Non-Hispanic householders$130,361 Black or African American householders
Median age by race in Unionville
41.5 Median age for White residents40.5 45.6 25.9 Median age for Black or African American residents21.5 -766,222,221.5 -708,962,738.5 Median age for American Indian / Alaska Native residents-577,885,390.9 -684,523,808.8 -683,893,194.8 Median age for Asian residents-710,992,907.1 -661,564,625.2 -560,606,060.0 Median age for Native Hawaiian / Pacific Islander residents-666,666,666.0 -559,017,940.9 11.0 Median age for Other race residents12.6 11.6 55.6 Median age for Two or more races residents47.5 61.8 40.7 Median age for White alone residents39.1 44.4 32.5 Median age for Hispanic or Latino residents54.4 13.8
Owner/renter occupied households by race in Unionville
House owners and renters - White residents 2,082 91.2% Owner occupied202 8.8% Renter occupiedHouse owners and renters - Black or African American residents 48 100.0% Owner occupiedHouse owners and renters - Other race residents 58 100.0% Renter occupiedHouse owners and renters - Two or more races residents 54 92.4% Owner occupied4 7.6% Renter occupiedHouse owners and renters - White alone residents 2,092 90.2% Owner occupied226 9.8% Renter occupiedHouse owners and renters - Hispanic or Latino residents 31 49.6% Owner occupied31 50.4% Renter occupied
Language usage in Unionville
English speakers - Total 94.4% of residents of Unionville speak English at home.
2.8% of residents speak Spanish at home 139 74.7% Speak English very well47 25.3% Speak English less than very well0.1% of residents speak other language at home 10 100.0% Speak English less than very well
English speakers - Born in the United States 98.5% of residents of Unionville speak English at home.
English speakers - Native, born elsewhere 10.0% of residents of Unionville speak English at home.
150.0% of residents speak Spanish at home 45 100.0% Speak English very well
English speakers - Foreign-born 50.0% of residents of Unionville speak English at home.
42.1% of residents speak Spanish at home 10 16.9% Speak English very well49 83.1% Speak English less than very well7.1% of residents speak other language at home 10 100.0% Speak English less than very well
White (Caucasian) - Speak only English Native:
100.0% (5,709)Foreign-born:
100.0% (37)
White (Caucasian) - Speak another language Native:
0.4% (20)Foreign-born:
15.1% (6)
Other race - Speak another language Native:
62.9% (144)Foreign-born:
100.0% (68)
Two or more races - Speak only English Native:
90.4% (206)Foreign-born:
52.1% (20)
Two or more races - Speak another language Native:
4.4% (10)Foreign-born:
44.5% (17)
White alone - Speak only English Native:
99.6% (5,819)Foreign-born:
41.7% (8)
White alone - Speak another language Native:
0.1% (8)Foreign-born:
56.2% (10)
Hispanic or Latino - Speak only English Native:
26.9% (40)Foreign-born:
48.1% (47)
Hispanic or Latino - Speak another language Native:
71.8% (106)Foreign-born:
59.5% (58)
Foreign-born residents in Unionville 119 residents are foreign born
This city:
1.7%North Carolina:
8.3%
Marital status for residents in Unionville Marital status - White (Caucasian) population 15 years and over
Males 31.5% Never married60.7% Now married0.0% Separated2.0% Widowed5.8% DivorcedFemales 19.4% Never married62.0% Now married0.0% Separated9.9% Widowed8.6% DivorcedWomen who did not give birth in the past 12 months Now married:
57.9% (689)Unmarried:
42.1% (502)
Marital status - Black or African American population 15 years and over
Males 97.4% Never married1.7% Now married0.0% Separated0.0% Widowed0.9% DivorcedFemales 0.0% Never married30.8% Now married0.0% Separated0.0% Widowed69.2% DivorcedWomen who did not give birth in the past 12 months Now married:
100.0% (14)Unmarried:
0.0% (0)
Marital status - Other race population 15 years and over
Males 0.0% Never married100.0% Now married0.0% Separated0.0% Widowed0.0% DivorcedFemales 64.1% Never married35.9% Now married0.0% Separated0.0% Widowed0.0% DivorcedWomen who did not give birth in the past 12 months Now married:
35.9% (19)Unmarried:
64.1% (34)
Marital status - Two or more races population 15 years and over
Males 0.0% Never married73.4% Now married9.4% Separated0.0% Widowed17.2% DivorcedFemales 0.0% Never married95.3% Now married0.0% Separated0.0% Widowed4.7% DivorcedWomen who did not give birth in the past 12 months Now married:
100.0% (60)Unmarried:
0.0% (0)
Marital status - White alone, not Hispanic / Latino population 15 years and over
Males 32.0% Never married60.2% Now married0.0% Separated2.1% Widowed5.8% DivorcedFemales 19.7% Never married61.6% Now married0.0% Separated10.0% Widowed8.7% DivorcedWomen who did not give birth in the past 12 months Now married:
56.9% (712)Unmarried:
43.1% (539)
Marital status - Hispanic or Latino population 15 years and over
Males 0.0% Never married81.4% Now married0.0% Separated0.0% Widowed18.6% DivorcedFemales 37.3% Never married62.7% Now married0.0% Separated0.0% Widowed0.0% DivorcedWomen who did not give birth in the past 12 months Now married:
62.7% (46)Unmarried:
37.3% (27)
Ancestries in Unionville
768 27.0% English590 20.7% American269 9.5% Irish204 7.2% Scotch-Irish79 2.8% German46 1.6% Italian29 1.0% European24 0.8% Polish15 0.5% Norwegian11 0.4% Portuguese9 0.3% Northern European9 0.3% Scottish8 0.3% Hungarian7 0.2% Swiss
Children Nativity (place of birth) in Unionville
Children under 6 years - Living with two parents Both parents native 268 100.0% NativeChildren under 6 years - Living with one parent Native parent 70 100.0% NativeChildren 6 to 17 years - Living with two parents Both parents native 1,163 100.0% NativeChildren 6 to 17 years - Living with one parent Native parent 91 100.0% NativeForeign-born parent 126 48.4% Native134 51.6% Foreign-born
Place of birth for residents in Unionville 102 Americas102 Latin America52 Central America34 South America15 Europe15 Eastern Europe14 Caribbean1 Asia1 Eastern Asia
Grandparents responsible for own grandchildren in Unionville
Grandparents (30 to 59 years) White / Caucasian 52 100.0% Not responsible for grandchildrenWhite alone, not Hispanic / Latino 57 100.0% Not responsible for grandchildrenGrandparents (60 years and over) White / Caucasian 20 57.5% Responsible for grandchildren15 42.5% Not responsible for grandchildrenWhite alone, not Hispanic / Latino 20 74.6% Responsible for grandchildren7 25.4% Not responsible for grandchildren