Races in Tumalo, Oregon (OR) Detailed Stats
Ancestries, Foreign-born residents, place of birth

Data:
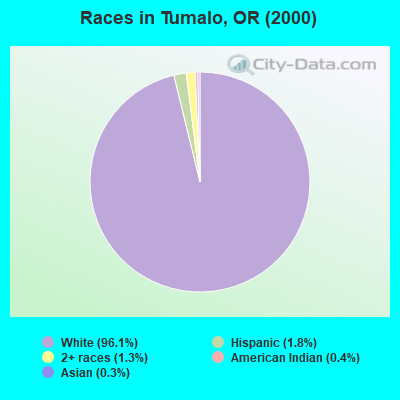
Race distribution in Tumalo

- 5,09696.1%White alone
- 941.8%Hispanic
- 671.3%Two or more races
- 220.4%American Indian alone
- 170.3%Asian alone
- 50.09%Black alone
- 20.04%Other race alone
- 20.04%Native Hawaiian and Other
Pacific Islander alone
2000
2022
-
- 2,857,61683.5%White alone
- 275,3148.0%Hispanic
- 100,3332.9%Asian alone
- 82,7332.4%Two or more races
- 53,3251.6%Black alone
- 40,1301.2%American Indian alone
- 7,3980.2%Native Hawaiian and Other
Pacific Islander alone
- 4,5500.1%Other race alone
-
- 3,037,57171.6%White alone
- 609,53814.4%Hispanic
- 252,7446.0%Two or more races
- 191,2834.5%Asian alone
- 78,2281.8%Black alone
- 29,3990.7%American Indian alone
- 25,7310.6%Other race alone
- 15,6430.4%Native Hawaiian and Other
Pacific Islander alone
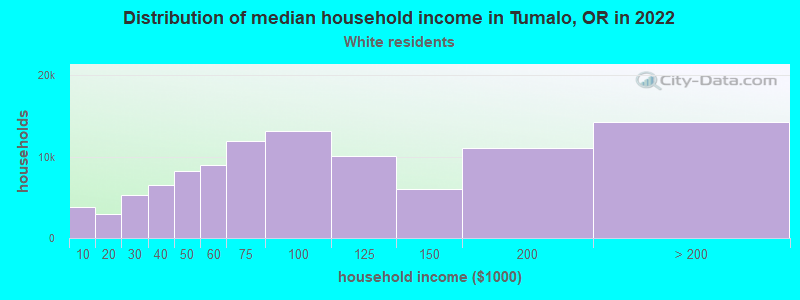
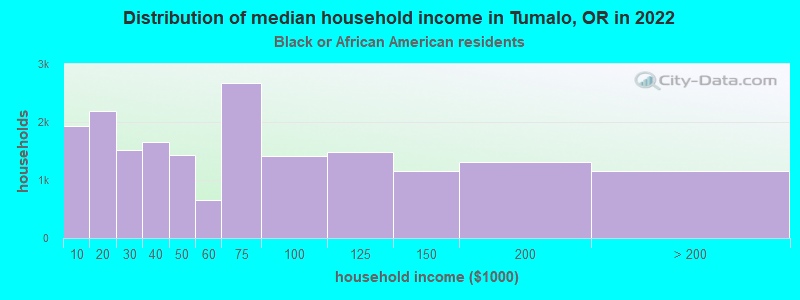
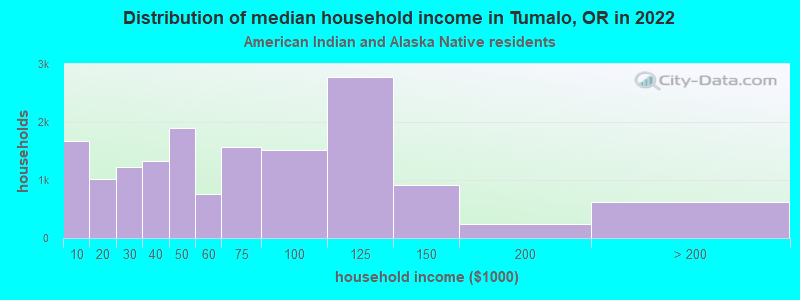
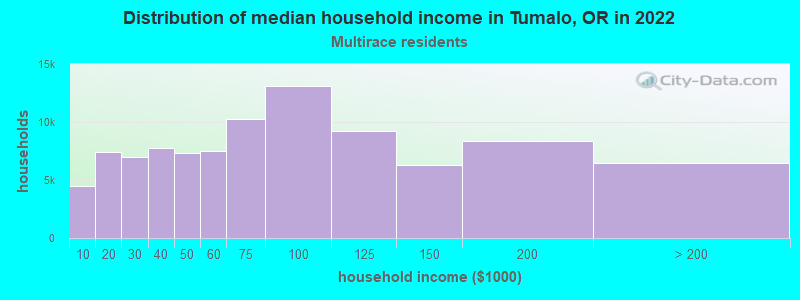
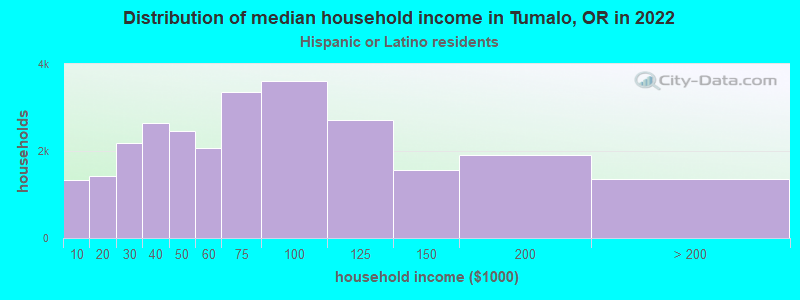
Income and house value in Tumalo
- Median household income in 2022
- $108,775White non-Hispanic householders
- $92,686Two or more races householders
- $22,772Hispanic or Latino race householders
- Median 2022 house value
- over $1,000,000White Non-Hispanic householders
- $707,889American Indian or Alaska Native householders
- $930,638Two or more races householders
- $839,084Hispanic or Latino householders