Races in Troy, Ohio (OH) Detailed Stats
Ancestries, Foreign-born residents, place of birth
Settings
X


Recent posts about races in Troy, Ohio on our local forum with over 2,400,000 registered users:
 | Help with school information in Troy or Lima (0 replies) |
| Looking into moving to Troy- which neighborhoods? (12 replies) |
| Troy Ohio and surrounding towns (19 replies) |
| Tipp or Troy (8 replies) |
| Moving Back to Dayton Area, Need Some Advice (51 replies) |
| 25 Best US Cities for Millenials - yay Dayton, Cincy and Columbus! (43 replies) |
Latest news about races in Troy, OH collected exclusively by city-data.com from local newspapers, TV, and radio stations
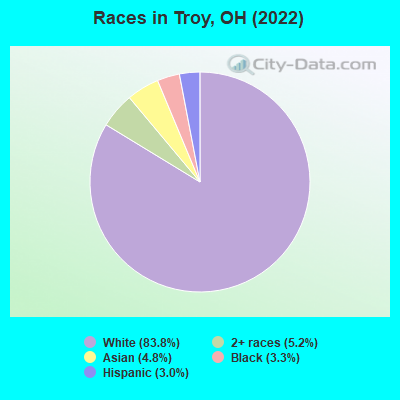
According to 2022 data, the most numerous races in Troy, OH are White alone (22,176 residents), Black alone (863 residents), and Two or more races (1,378 residents). 93.4% of Troy residents speak English at home. 5.8% of Troy, OH residents are foreign-born (3.7% born in Asia, 0.8% born in Latin America), which is 31.0% greater than the foreign-born rate of 4.0% across the entire state of Ohio.
Race distribution in Troy
2000
2022

- 20,03691.1%White alone
- 1,0464.8%Black alone
- 3601.6%Asian alone
- 3041.4%Two or more races
- 1700.8%Hispanic
- 350.2%Other race alone
- 460.2%American Indian alone
- 20.01%Native Hawaiian and Other
Pacific Islander alone

-
- 22,17683.8%White alone
- 1,3785.2%Two or more races
- 1,2614.8%Asian alone
- 8633.3%Black alone
- 7933.0%Hispanic
- 80.03%Other race alone
2000
2022
-
- 9,538,11184.0%White alone
- 1,290,66211.4%Black alone
- 217,1231.9%Hispanic
- 137,7701.2%Two or more races
- 131,6701.2%Asian alone
- 21,9850.2%American Indian alone
- 13,4830.1%Other race alone
- 2,3360.02%Native Hawaiian and Other
Pacific Islander alone

-
- 8,948,79376.1%White alone
- 1,401,40311.9%Black alone
- 529,2914.5%Two or more races
- 517,2324.4%Hispanic
- 293,3872.5%Asian alone
- 52,8050.4%Other race alone
- 9,7850.08%American Indian alone
- 3,3620.03%Native Hawaiian and Other
Pacific Islander alone

Income and house value in Troy
- Median household income in 2022
- $68,891White non-Hispanic householders
- $29,032Black householders
- over $200,000Asian householders
- $114,937Two or more races householders
- $111,533Hispanic or Latino race householders
- Median 2022 house value
- $186,064White Non-Hispanic householders
- $157,439Black or African American householders
- $226,554American Indian or Alaska Native householders
- $275,519Asian householders
- $165,349Some other race householders
- $154,238Two or more races householders
- $214,878Hispanic or Latino householders
Household income for White non-Hispanic householders

Household income for Black householders

Household income for Asian householders

Household income for Some other race householders

Household income for Two or more races householders

Household income for Hispanic or Latino race householders

Median age by race in Troy
- 40.0Median age for White residents
- 38.3Males
- 41.7Females
- 63.6Median age for Black or African American residents
- 60.0Males
- 79.5Females
- -676,818,950.3Median age for American Indian / Alaska Native residents
- -685,185,184.5Males
- -658,163,264.6Females
- 35.2Median age for Asian residents
- 47.5Males
- 23.9Females
- -666,666,666.0Median age for Native Hawaiian / Pacific Islander residents
- -666,666,666.0Males
- -666,666,666.0Females
- 38.4Median age for Other race residents
- -691,275,167.1Males
- 38.6Females
- 18.1Median age for Two or more races residents
- 23.2Males
- 12.4Females
- 39.8Median age for White alone residents
- 38.4Males
- 41.5Females
- 19.8Median age for Hispanic or Latino residents
- 25.9Males
- 17.5Females
Owner/renter occupied households by race in Troy
- House owners and renters - White residents
- 6,71867.9%Owner occupied
- 3,18232.1%Renter occupied
- House owners and renters - Black or African American residents
- 15121.3%Owner occupied
- 55978.7%Renter occupied
- House owners and renters - Asian residents
- 21650.4%Owner occupied
- 21249.6%Renter occupied
- House owners and renters - Other race residents
- 4280.9%Owner occupied
- 1019.1%Renter occupied
- House owners and renters - Two or more races residents
- 10947.7%Owner occupied
- 11952.3%Renter occupied
- House owners and renters - White alone residents
- 6,66367.5%Owner occupied
- 3,21232.5%Renter occupied
- House owners and renters - Hispanic or Latino residents
- 20580.8%Owner occupied
- 4919.2%Renter occupied
Language usage in Troy
- English speakers - Total
- 93.4% of residents of Troy speak English at home.
- 1.5% of residents speak Spanish at home
- 33389.0%Speak English very well
- 4111.0%Speak English less than very well
- 5.0% of residents speak other language at home
- 43434.6%Speak English very well
- 82165.4%Speak English less than very well
- English speakers - Born in the United States
- 98.0% of residents of Troy speak English at home.
- 1.3% of residents speak Spanish at home
- 63100.0%Speak English very well
- 0.6% of residents speak other language at home
- 2382.1%Speak English very well
- 517.9%Speak English less than very well
- English speakers - Native, born elsewhere
- 71.6% of residents of Troy speak English at home.
- 3.8% of residents speak Spanish at home
- 7100.0%Speak English very well
- 24.0% of residents speak other language at home
- 44100.0%Speak English very well
- English speakers - Foreign-born
- 17.8% of residents of Troy speak English at home.
- 12.8% of residents speak Spanish at home
- 194100.0%Speak English very well
- 67.8% of residents speak other language at home
- 24323.6%Speak English very well
- 78776.4%Speak English less than very well
White (Caucasian) - Speak only English
| Native: | 99.2% (21,311) |
| Foreign-born: | 100.0% (208) |
White (Caucasian) - Speak another language
| Native: | 0.8% (172) |
| Foreign-born: | 32.0% (66) |
Black or African American - Speak only English
| Native: | 99.8% (753) |
| Foreign-born: | 50.0% (36) |
Asian - Speak only English
| Native: | 16.5% (39) |
| Foreign-born: | 6.6% (63) |
Asian - Speak another language
| Native: | 82.3% (196) |
| Foreign-born: | 92.1% (878) |
Two or more races - Speak another language
| Native: | 5.4% (89) |
| Foreign-born: | 100.0% (193) |
White alone - Speak only English
| Native: | 99.1% (20,754) |
| Foreign-born: | 89.2% (178) |
White alone - Speak another language
| Native: | 0.9% (186) |
| Foreign-born: | 12.2% (24) |
Hispanic or Latino - Speak another language
| Native: | 20.8% (99) |
| Foreign-born: | 100.0% (204) |
Foreign-born residents in Troy
1,556 residents are foreign born (3.7% Asia, 0.8% Latin America).
| This city: | 5.8% |
| Ohio: | 4.9% |


Marital status for residents in Troy
Marital status - White (Caucasian) population 15 years and over
- Males
- 33.9%Never married
- 53.1%Now married
- 0.7%Separated
- 3.8%Widowed
- 8.5%Divorced
- Females
- 22.9%Never married
- 48.3%Now married
- 1.9%Separated
- 9.2%Widowed
- 17.7%Divorced
Women who gave birth in the past 12 months
| Now married: | 68.6% (262) |
| Unmarried: | 31.4% (120) |
Women who did not give birth in the past 12 months
| Now married: | 50.0% (2,438) |
| Unmarried: | 50.0% (2,439) |
Marital status - Black or African American population 15 years and over
- Males
- 33.1%Never married
- 59.7%Now married
- 0.0%Separated
- 0.0%Widowed
- 7.2%Divorced
- Females
- 43.2%Never married
- 36.5%Now married
- 0.0%Separated
- 7.1%Widowed
- 13.2%Divorced
Women who did not give birth in the past 12 months
| Now married: | 0.0% (0) |
| Unmarried: | 100.0% (124) |
Marital status - Asian population 15 years and over
- Males
- 10.0%Never married
- 90.0%Now married
- 0.0%Separated
- 0.0%Widowed
- 0.0%Divorced
- Females
- 4.8%Never married
- 89.7%Now married
- 0.0%Separated
- 5.4%Widowed
- 0.0%Divorced
Women who gave birth in the past 12 months
| Now married: | 100.0% (72) |
| Unmarried: | 0.0% (0) |
Women who did not give birth in the past 12 months
| Now married: | 92.6% (311) |
| Unmarried: | 7.4% (25) |
Marital status - Other race population 15 years and over
- Males
- 100.0%Never married
- 0.0%Now married
- 0.0%Separated
- 0.0%Widowed
- 0.0%Divorced
- Females
- 15.8%Never married
- 84.2%Now married
- 0.0%Separated
- 0.0%Widowed
- 0.0%Divorced
Women who did not give birth in the past 12 months
| Now married: | 84.2% (42) |
| Unmarried: | 15.8% (8) |
Marital status - Two or more races population 15 years and over
- Males
- 68.3%Never married
- 24.6%Now married
- 0.0%Separated
- 3.5%Widowed
- 3.5%Divorced
- Females
- 54.0%Never married
- 39.8%Now married
- 6.2%Separated
- 0.0%Widowed
- 0.0%Divorced
Women who gave birth in the past 12 months
| Now married: | 12.7% (12) |
| Unmarried: | 87.3% (83) |
Women who did not give birth in the past 12 months
| Now married: | 48.7% (220) |
| Unmarried: | 51.3% (232) |
Marital status - White alone, not Hispanic / Latino population 15 years and over
- Males
- 33.6%Never married
- 53.3%Now married
- 0.7%Separated
- 3.8%Widowed
- 8.6%Divorced
- Females
- 23.0%Never married
- 48.2%Now married
- 1.9%Separated
- 9.2%Widowed
- 17.7%Divorced
Women who gave birth in the past 12 months
| Now married: | 68.6% (264) |
| Unmarried: | 31.4% (121) |
Women who did not give birth in the past 12 months
| Now married: | 49.7% (2,433) |
| Unmarried: | 50.3% (2,464) |
Marital status - Hispanic or Latino population 15 years and over
- Males
- 40.6%Never married
- 58.4%Now married
- 0.0%Separated
- 0.0%Widowed
- 1.0%Divorced
- Females
- 14.8%Never married
- 85.2%Now married
- 0.0%Separated
- 0.0%Widowed
- 0.0%Divorced
Women who did not give birth in the past 12 months
| Now married: | 85.2% (189) |
| Unmarried: | 14.8% (33) |
Ancestries in Troy

- 2,98524.0%German
- 1,86115.0%English
- 1,66613.4%American
- 9127.3%Irish
- 3532.8%European
- 1881.5%French
- 1711.4%Scottish
- 1431.2%Italian
- 1140.9%Scotch-Irish
- 1020.8%Welsh
- 830.7%Polish
- 780.6%Portuguese
- 590.5%French Canadian
- 570.5%Russian
- 310.2%African
- 280.2%Ethiopian
- 270.2%Swiss
- 230.2%Hungarian
- 190.2%British
- 170.1%Danish
- 170.1%Romanian
- 150.1%Norwegian
- 150.1%Scandinavian
- 150.1%Swedish
- 140.1%Pennsylvania German
- 130.1%Eastern European
- 100.08%Serbian
- 90.07%Celtic
- 90.07%Ukrainian
- 80.06%Czechoslovakian
- 50.04%Greek
- 50.04%Lithuanian

Geographical mobility in Troy

- Same house 1 year ago
- 20,68192.9%White (Caucasian)
- 65375.9%Black or African American
- 1,19194.6%Asian
- 3244.2%Other race
- 1,95591.3%Two or more races
- 20,54592.8%White alone, not Hispanic / Latino
- 74493.7%Hispanic or Latino

-
- Moved within same county
- 8513.8%White / Caucasian
- 13515.7%Black or African American
- 645.1%Asian
- 3548.6%Other race
- 1416.6%Two or more races
- 8713.9%White alone, not Hispanic / Latino
- 293.7%Hispanic or Latino

-
- Moved within same state
- 4712.1%White / Caucasian
- 617.1%Black or African American
- 50.2%Two or more races
- 4742.1%White alone, not Hispanic / Latino

-
- Moved from different state
- 3211.4%White / Caucasian
- 110.8%Asian
- 60.3%Two or more races
- 3071.4%White alone, not Hispanic / Latino
- 202.5%Hispanic or Latino

-
- Moved from abroad
- 870.4%White
- 50.6%Black or African American
- 60.5%Asian
- 823.8%Two or more races
- 960.4%White alone, not Hispanic / Latino

Children Nativity (place of birth) in Troy
Place of birth for residents in Troy
![Place of birth for the foreign-born population - Regions]()
- 991Asia
- 597Eastern Asia
- 288Americas
- 258South Central Asia
- 228Latin America
- 184Central America
- 147Europe
- 135South Eastern Asia
- 129Africa
- 109Eastern Africa
- 94Eastern Europe
- 62China
- 60Northern America
- 53Southern Europe
- 31Caribbean
- 19Western Africa
- 12South America

![Place of birth for the foreign-born population - Countries]()
- 535Japan
- 258India
- 112Mexico
- 95Philippines
- 71Honduras
- 60Canada
- 58Russia
- 53Portugal
- 48Tanzania
- 39Thailand
- 36Ethiopia
- 31China
- 31Jamaica
- 30Hong Kong
- 26Poland
- 24Kenya
- 19Nigeria
- 12Colombia
- 9Serbia

Grandparents responsible for own grandchildren in Troy
Zip codes: 45373.