Races in Trinity, Florida (FL) Detailed Stats
Data:
Races - White alone (%)
Races - White alone (% change since 2000)
Races - Black alone (%)
Races - Black alone (% change since 2000)
Races - American Indian alone (%)
Races - American Indian alone (% change since 2000)
Races - Asian alone (%)
Races - Asian alone (% change since 2000)
Races - Hispanic (%)
Races - Hispanic (% change since 2000)
Races - Native Hawaiian and Other Pacific Islander alone (%)
Races - Native Hawaiian and Other Pacific Islander alone (% change since 2000)
Races - Two or more races(%)
Races - Two or more races(% change since 2000)
Races - Other race alone (%)
Races - Other race alone (% change since 2000)
Racial diversity
Place of birth - Born in state of residence (%)
Place of birth - Born in state of residence (%) - White
Place of birth - Born in state of residence (%) - Black or African American
Place of birth - Born in state of residence (%) - Asian
Place of birth - Born in state of residence (%) - Hispanic or Latino
Place of birth - Born in state of residence (%) - American Indian and Alaska Native
Place of birth - Born in state of residence (%) - Multirace
Place of birth - Born in state of residence (%) - Other Race
Place of birth - Born in other state (%)
Place of birth - Born in other state (%) - White
Place of birth - Born in other state (%) - Black or African American
Place of birth - Born in other state (%) - Asian
Place of birth - Born in other state (%) - Hispanic or Latino
Place of birth - Born in other state (%) - American Indian and Alaska Native
Place of birth - Born in other state (%) - Multirace
Place of birth - Born in other state (%) - Other Race
Place of birth - Native, outside of US (%)
Place of birth - Native, outside of US (%) - White
Place of birth - Native, outside of US (%) - Black or African American
Place of birth - Native, outside of US (%) - Asian
Place of birth - Native, outside of US (%) - Hispanic or Latino
Place of birth - Native, outside of US (%) - American Indian and Alaska Native
Place of birth - Native, outside of US (%) - Multirace
Place of birth - Native, outside of US (%) - Other Race
Place of birth - Foreign born (%)
Place of birth - Foreign born (%) - White
Place of birth - Foreign born (%) - Black or African American
Place of birth - Foreign born (%) - Asian
Place of birth - Foreign born (%) - Hispanic or Latino
Place of birth - Foreign born (%) - American Indian and Alaska Native
Place of birth - Foreign born (%) - Multirace
Place of birth - Foreign born (%) - Other Race
Residents speaking English at home (%)
Residents speaking English at home - Born in the United States (%)
Residents speaking English at home - Native, born elsewhere (%)
Residents speaking English at home - Foreign born (%)
Residents speaking Spanish at home (%)
Residents speaking Spanish at home - Born in the United States (%)
Residents speaking Spanish at home - Native, born elsewhere (%)
Residents speaking Spanish at home - Foreign born (%)
Residents speaking other language at home (%)
Residents speaking other language at home - Born in the United States (%)
Residents speaking other language at home - Native, born elsewhere (%)
Residents speaking other language at home - Foreign born (%)
Marital status - Never married (%)
Marital status - Now married (%)
Marital status - Separated (%)
Marital status - Widowed (%)
Marital status - Divorced (%)
Ancestries Reported - Arab (%)
Ancestries Reported - Czech (%)
Ancestries Reported - Danish (%)
Ancestries Reported - Dutch (%)
Ancestries Reported - English (%)
Ancestries Reported - French (%)
Ancestries Reported - French Canadian (%)
Ancestries Reported - German (%)
Ancestries Reported - Greek (%)
Ancestries Reported - Hungarian (%)
Ancestries Reported - Irish (%)
Ancestries Reported - Italian (%)
Ancestries Reported - Lithuanian (%)
Ancestries Reported - Norwegian (%)
Ancestries Reported - Polish (%)
Ancestries Reported - Portuguese (%)
Ancestries Reported - Russian (%)
Ancestries Reported - Scotch-Irish (%)
Ancestries Reported - Scottish (%)
Ancestries Reported - Slovak (%)
Ancestries Reported - Subsaharan African (%)
Ancestries Reported - Swedish (%)
Ancestries Reported - Swiss (%)
Ancestries Reported - Ukrainian (%)
Ancestries Reported - United States (%)
Ancestries Reported - Welsh (%)
Ancestries Reported - West Indian (%)
Ancestries Reported - Other (%)
Geographical mobility - Same house 1 year ago (%)
Geographical mobility - Same house 1 year ago (%) - White
Geographical mobility - Same house 1 year ago (%) - Black or African American
Geographical mobility - Same house 1 year ago (%) - Asian
Geographical mobility - Same house 1 year ago (%) - Hispanic or Latino
Geographical mobility - Same house 1 year ago (%) - American Indian and Alaska Native
Geographical mobility - Same house 1 year ago (%) - Multirace
Geographical mobility - Same house 1 year ago (%) - Other Race
Geographical mobility - Moved within same county (%)
Geographical mobility - Moved within same county (%) - White
Geographical mobility - Moved within same county (%) - Black or African American
Geographical mobility - Moved within same county (%) - Asian
Geographical mobility - Moved within same county (%) - Hispanic or Latino
Geographical mobility - Moved within same county (%) - American Indian and Alaska Native
Geographical mobility - Moved within same county (%) - Multirace
Geographical mobility - Moved within same county (%) - Other Race
Geographical mobility - Moved from different county within same state (%)
Geographical mobility - Moved from different county within same state (%) - White
Geographical mobility - Moved from different county within same state (%) - Black or African American
Geographical mobility - Moved from different county within same state (%) - Asian
Geographical mobility - Moved from different county within same state (%) - Hispanic or Latino
Geographical mobility - Moved from different county within same state (%) - American Indian and Alaska Native
Geographical mobility - Moved from different county within same state (%) - Multirace
Geographical mobility - Moved from different county within same state (%) - Other Race
Geographical mobility - Moved from different state (%)
Geographical mobility - Moved from different state (%) - White
Geographical mobility - Moved from different state (%) - Black or African American
Geographical mobility - Moved from different state (%) - Asian
Geographical mobility - Moved from different state (%) - Hispanic or Latino
Geographical mobility - Moved from different state (%) - American Indian and Alaska Native
Geographical mobility - Moved from different state (%) - Multirace
Geographical mobility - Moved from different state (%) - Other Race
Geographical mobility - Moved from abroad (%)
Geographical mobility - Moved from abroad (%) - White
Geographical mobility - Moved from abroad (%) - Black or African American
Geographical mobility - Moved from abroad (%) - Asian
Geographical mobility - Moved from abroad (%) - Hispanic or Latino
Geographical mobility - Moved from abroad (%) - American Indian and Alaska Native
Geographical mobility - Moved from abroad (%) - Multirace
Geographical mobility - Moved from abroad (%) - Other Race
Place of birth for the foreign-born population - Ireland (%)
Place of birth for the foreign-born population - Denmark (%)
Place of birth for the foreign-born population - Norway (%)
Place of birth for the foreign-born population - Sweden (%)
Place of birth for the foreign-born population - United Kingdom (%)
Place of birth for the foreign-born population - England (%)
Place of birth for the foreign-born population - Scotland (%)
Place of birth for the foreign-born population - Other Northern Europe (%)
Place of birth for the foreign-born population - Austria (%)
Place of birth for the foreign-born population - Belgium (%)
Place of birth for the foreign-born population - France (%)
Place of birth for the foreign-born population - Germany (%)
Place of birth for the foreign-born population - Netherlands (%)
Place of birth for the foreign-born population - Switzerland (%)
Place of birth for the foreign-born population - Other Western Europe (%)
Place of birth for the foreign-born population - Greece (%)
Place of birth for the foreign-born population - Italy (%)
Place of birth for the foreign-born population - Portugal (%)
Place of birth for the foreign-born population - Spain (%)
Place of birth for the foreign-born population - Other Southern Europe (%)
Place of birth for the foreign-born population - Albania (%)
Place of birth for the foreign-born population - Belarus (%)
Place of birth for the foreign-born population - Bosnia and Herzegovina (%)
Place of birth for the foreign-born population - Bulgaria (%)
Place of birth for the foreign-born population - Croatia (%)
Place of birth for the foreign-born population - Czechoslovakia (%)
Place of birth for the foreign-born population - Hungary (%)
Place of birth for the foreign-born population - Latvia (%)
Place of birth for the foreign-born population - Lithuania (%)
Place of birth for the foreign-born population - North Macedonia (Macedonia) (%)
Place of birth for the foreign-born population - Moldova (%)
Place of birth for the foreign-born population - Poland (%)
Place of birth for the foreign-born population - Romania (%)
Place of birth for the foreign-born population - Russia (%)
Place of birth for the foreign-born population - Serbia (%)
Place of birth for the foreign-born population - Ukraine (%)
Place of birth for the foreign-born population - Other Eastern Europe (%)
Place of birth for the foreign-born population - China (%)
Place of birth for the foreign-born population - Hong Kong (%)
Place of birth for the foreign-born population - Taiwan (%)
Place of birth for the foreign-born population - Japan (%)
Place of birth for the foreign-born population - Korea (%)
Place of birth for the foreign-born population - Other Eastern Asia (%)
Place of birth for the foreign-born population - Afghanistan (%)
Place of birth for the foreign-born population - Bangladesh (%)
Place of birth for the foreign-born population - India (%)
Place of birth for the foreign-born population - Iran (%)
Place of birth for the foreign-born population - Kazakhstan (%)
Place of birth for the foreign-born population - Nepal (%)
Place of birth for the foreign-born population - Pakistan (%)
Place of birth for the foreign-born population - Sri Lanka (%)
Place of birth for the foreign-born population - Uzbekistan (%)
Place of birth for the foreign-born population - Other South Central Asia (%)
Place of birth for the foreign-born population - Burma (%)
Place of birth for the foreign-born population - Cambodia (%)
Place of birth for the foreign-born population - Indonesia (%)
Place of birth for the foreign-born population - Laos (%)
Place of birth for the foreign-born population - Malaysia (%)
Place of birth for the foreign-born population - Philippines (%)
Place of birth for the foreign-born population - Singapore (%)
Place of birth for the foreign-born population - Thailand (%)
Place of birth for the foreign-born population - Vietnam (%)
Place of birth for the foreign-born population - Other South Eastern Asia (%)
Place of birth for the foreign-born population - Armenia (%)
Place of birth for the foreign-born population - Iraq (%)
Place of birth for the foreign-born population - Israel (%)
Place of birth for the foreign-born population - Jordan (%)
Place of birth for the foreign-born population - Kuwait (%)
Place of birth for the foreign-born population - Lebanon (%)
Place of birth for the foreign-born population - Saudi Arabia (%)
Place of birth for the foreign-born population - Syria (%)
Place of birth for the foreign-born population - Turkey (%)
Place of birth for the foreign-born population - Yemen (%)
Place of birth for the foreign-born population - Other Western Asia (%)
Place of birth for the foreign-born population - Eritrea (%)
Place of birth for the foreign-born population - Ethiopia (%)
Place of birth for the foreign-born population - Kenya (%)
Place of birth for the foreign-born population - Somalia (%)
Place of birth for the foreign-born population - Uganda (%)
Place of birth for the foreign-born population - Zimbabwe (%)
Place of birth for the foreign-born population - Other Eastern Africa (%)
Place of birth for the foreign-born population - Cameroon (%)
Place of birth for the foreign-born population - Congo (%)
Place of birth for the foreign-born population - Democratic Republic of Congo (Zaire) (%)
Place of birth for the foreign-born population - Other Middle Africa (%)
Place of birth for the foreign-born population - Egypt (%)
Place of birth for the foreign-born population - Morocco (%)
Place of birth for the foreign-born population - Sudan (%)
Place of birth for the foreign-born population - Other Northern Africa (%)
Place of birth for the foreign-born population - South Africa (%)
Place of birth for the foreign-born population - Other Southern Africa (%)
Place of birth for the foreign-born population - Cabo Verde (%)
Place of birth for the foreign-born population - Ghana (%)
Place of birth for the foreign-born population - Liberia (%)
Place of birth for the foreign-born population - Nigeria (%)
Place of birth for the foreign-born population - Senegal (%)
Place of birth for the foreign-born population - Sierra Leone (%)
Place of birth for the foreign-born population - Other Western Africa (%)
Place of birth for the foreign-born population - Australia (%)
Place of birth for the foreign-born population - New Zealand (%)
Place of birth for the foreign-born population - Fiji (%)
Place of birth for the foreign-born population - Micronesia (%)
Place of birth for the foreign-born population - Bahamas (%)
Place of birth for the foreign-born population - Barbados (%)
Place of birth for the foreign-born population - Cuba (%)
Place of birth for the foreign-born population - Dominica (%)
Place of birth for the foreign-born population - Dominican Republic (%)
Place of birth for the foreign-born population - Grenada (%)
Place of birth for the foreign-born population - Haiti (%)
Place of birth for the foreign-born population - Jamaica (%)
Place of birth for the foreign-born population - St. Vincent and the Grenadines (%)
Place of birth for the foreign-born population - Trinidad and Tobago (%)
Place of birth for the foreign-born population - West Indies (%)
Place of birth for the foreign-born population - Other Caribbean (%)
Place of birth for the foreign-born population - Belize (%)
Place of birth for the foreign-born population - Costa Rica (%)
Place of birth for the foreign-born population - El Salvador (%)
Place of birth for the foreign-born population - Guatemala (%)
Place of birth for the foreign-born population - Honduras (%)
Place of birth for the foreign-born population - Mexico (%)
Place of birth for the foreign-born population - Nicaragua (%)
Place of birth for the foreign-born population - Panama (%)
Place of birth for the foreign-born population - Other Central America (%)
Place of birth for the foreign-born population - Argentina (%)
Place of birth for the foreign-born population - Bolivia (%)
Place of birth for the foreign-born population - Brazil (%)
Place of birth for the foreign-born population - Chile (%)
Place of birth for the foreign-born population - Colombia (%)
Place of birth for the foreign-born population - Ecuador (%)
Place of birth for the foreign-born population - Guyana (%)
Place of birth for the foreign-born population - Peru (%)
Place of birth for the foreign-born population - Uruguay (%)
Place of birth for the foreign-born population - Venezuela (%)
Place of birth for the foreign-born population - Other South America (%)
Place of birth for the foreign-born population - Canada (%)
Place of birth for the foreign-born population - Other Northern America (%)
Place of birth for the foreign-born population - Other (%)
Latest news about races in Trinity, FL collected exclusively by city-data.com from local newspapers, TV, and radio stations
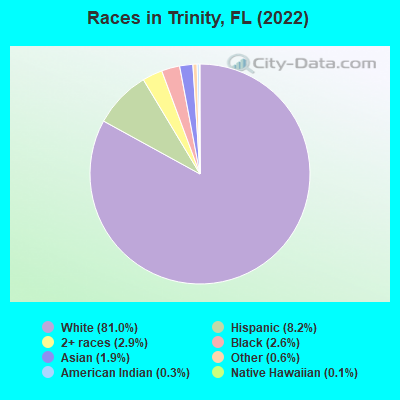
According to 2022 data, the most numerous races in Trinity, FL are White alone (16,182 residents), Hispanic (1,643 residents), and Black alone (512 residents). 85.4% of Trinity residents speak English at home. 13.4% of Trinity, FL residents are foreign-born (5.4% born in Africa, 3.1% born in Latin America, 2.5% born in Asia, 1.9% born in Europe), which is 57.0% less than the foreign-born rate of 21.0% across the entire state of Florida.
Race distribution in Trinity
2000 2022
10,458,509 65.4% White alone 2,682,715 16.8% Hispanic 2,264,268 14.2% Black alone 261,693 1.6% Asian alone 236,954 1.5% Two or more races 42,358 0.3% American Indian alone 28,994 0.2% Other race alone 6,887 0.04% Native Hawaiian and Other
11,309,403 50.8% White alone 6,025,039 27.1% Hispanic 3,241,015 14.6% Black alone 861,630 3.9% Two or more races 623,692 2.8% Asian alone 152,054 0.7% Other race alone 22,504 0.1% American Indian alone 9,486 0.04% Native Hawaiian and Other
Income and house value in Trinity Median household income in 2022 $108,172 White non-Hispanic householders$123,868 Black householders$145,953 Asian householders$108,775 Some other race householders$155,722 Two or more races householders$118,089 Hispanic or Latino race householdersMedian 2022 house value $507,739 White Non-Hispanic householders$388,936 Black or African American householders $549,037 Asian householders$487,939 Hispanic or Latino householders
Median age by race in Trinity
45.6 Median age for White residents45.6 45.6 35.7 Median age for Black or African American residents50.1 29.4 23.6 Median age for American Indian / Alaska Native residents20.7 23.1 53.5 Median age for Asian residents48.5 54.0 55.3 Median age for Native Hawaiian / Pacific Islander residents-858,307,848.3 -444,051,825.2 41.6 Median age for Other race residents59.0 38.8 23.8 Median age for Two or more races residents34.0 17.3 45.0 Median age for White alone residents44.4 46.1 34.4 Median age for Hispanic or Latino residents44.0 27.5
Owner/renter occupied households by race in Trinity
House owners and renters - White residents 5,351 85.9% Owner occupied880 14.1% Renter occupiedHouse owners and renters - Black or African American residents 231 73.7% Owner occupied83 26.3% Renter occupiedHouse owners and renters - American Indian / Alaska Native residents 14 42.4% Owner occupied20 57.6% Renter occupiedHouse owners and renters - Asian residents 130 92.1% Owner occupied11 7.9% Renter occupiedHouse owners and renters - Native Hawaiian / Pacific Islander residents 17 100.0% Owner occupiedHouse owners and renters - Other race residents 69 100.0% Owner occupiedHouse owners and renters - Two or more races residents 263 100.0% Owner occupiedHouse owners and renters - White alone residents 5,333 85.3% Owner occupied921 14.7% Renter occupiedHouse owners and renters - Hispanic or Latino residents 329 97.8% Owner occupied7 2.2% Renter occupied
Language usage in Trinity
English speakers - Total 85.4% of residents of Trinity speak English at home.
4.3% of residents speak Spanish at home 545 68.1% Speak English very well255 31.9% Speak English less than very well9.6% of residents speak other language at home 1,490 83.7% Speak English very well291 16.3% Speak English less than very well
English speakers - Born in the United States 96.2% of residents of Trinity speak English at home.
1.2% of residents speak Spanish at home 88 73.9% Speak English very well31 26.1% Speak English less than very well2.2% of residents speak other language at home 204 97.6% Speak English very well5 2.4% Speak English less than very well
English speakers - Native, born elsewhere 47.3% of residents of Trinity speak English at home.
41.9% of residents speak Spanish at home 59 44.7% Speak English very well73 55.3% Speak English less than very well
English speakers - Foreign-born 36.1% of residents of Trinity speak English at home.
14.4% of residents speak Spanish at home 329 75.5% Speak English very well107 24.5% Speak English less than very well49.5% of residents speak other language at home 1,203 80.0% Speak English very well300 20.0% Speak English less than very well
White (Caucasian) - Speak only English Native:
98.0% (13,025)Foreign-born:
42.4% (680)
White (Caucasian) - Speak another language Native:
2.8% (370)Foreign-born:
57.7% (924)
Black or African American - Speak only English Native:
99.0% (434)Foreign-born:
100.0% (41)
Asian - Speak only English Native:
89.5% (81)Foreign-born:
2.3% (7)
Asian - Speak another language Native:
20.4% (18)Foreign-born:
92.3% (283)
Native Hawaiian / Pacific Islander - Speak only English Native:
54.4% (21)Foreign-born:
100.0% (3)
Other race - Speak only English Native:
28.4% (46)Foreign-born:
50.4% (37)
Other race - Speak another language Native:
73.5% (118)Foreign-born:
49.9% (36)
Two or more races - Speak only English Native:
86.7% (942)Foreign-born:
23.7% (79)
Two or more races - Speak another language Native:
7.3% (80)Foreign-born:
71.5% (237)
White alone - Speak only English Native:
97.3% (12,968)Foreign-born:
40.1% (735)
White alone - Speak another language Native:
2.7% (364)Foreign-born:
59.6% (1,091)
Hispanic or Latino - Speak only English Native:
64.8% (600)Foreign-born:
11.5% (58)
Hispanic or Latino - Speak another language Native:
34.1% (315)Foreign-born:
86.2% (435)
Foreign-born residents in Trinity 2,671 residents are foreign born (5.4% Africa , 3.1% Latin America , 2.5% Asia , 1.9% Europe ).
This city:
13.4%Florida:
21.1%
Marital status for residents in Trinity Marital status - White (Caucasian) population 15 years and over
Males 27.3% Never married66.3% Now married0.6% Separated2.7% Widowed3.1% DivorcedFemales 18.4% Never married59.1% Now married0.6% Separated13.2% Widowed8.7% DivorcedWomen who gave birth in the past 12 months Now married:
59.6% (253)Unmarried:
40.4% (172)
Women who did not give birth in the past 12 months Now married:
52.5% (1,407)Unmarried:
47.5% (1,272)
Marital status - Black or African American population 15 years and over
Males 0.0% Never married65.7% Now married34.3% Separated0.0% Widowed0.0% DivorcedFemales 16.3% Never married69.1% Now married0.0% Separated0.0% Widowed14.6% DivorcedWomen who gave birth in the past 12 months Now married:
0.0% (0)Unmarried:
100.0% (18)
Women who did not give birth in the past 12 months Now married:
80.1% (148)Unmarried:
19.9% (37)
Marital status - American Indian / Alaska Native population 15 years and over
Males 30.2% Never married69.8% Now married0.0% Separated0.0% Widowed0.0% DivorcedFemales 45.8% Never married54.2% Now married0.0% Separated0.0% Widowed0.0% DivorcedWomen who did not give birth in the past 12 months Now married:
38.9% (23)Unmarried:
61.1% (36)
Marital status - Asian population 15 years and over
Males 14.7% Never married74.4% Now married0.0% Separated7.8% Widowed3.1% DivorcedFemales 6.6% Never married69.6% Now married7.2% Separated16.6% Widowed0.0% DivorcedWomen who did not give birth in the past 12 months Now married:
83.8% (64)Unmarried:
16.2% (12)
Marital status - Native Hawaiian / Pacific Islander population 15 years and over
Males 0.0% Never married100.0% Now married0.0% Separated0.0% Widowed0.0% DivorcedFemales 0.0% Never married100.0% Now married0.0% Separated0.0% Widowed0.0% DivorcedWomen who did not give birth in the past 12 months Now married:
100.0% (5)Unmarried:
0.0% (0)
Marital status - Other race population 15 years and over
Males 0.0% Never married100.0% Now married0.0% Separated0.0% Widowed0.0% DivorcedFemales 32.9% Never married60.8% Now married0.0% Separated0.0% Widowed6.3% DivorcedWomen who gave birth in the past 12 months Now married:
0.0% (0)Unmarried:
100.0% (23)
Women who did not give birth in the past 12 months Now married:
72.3% (60)Unmarried:
27.7% (23)
Marital status - Two or more races population 15 years and over
Males 13.7% Never married86.3% Now married0.0% Separated0.0% Widowed0.0% DivorcedFemales 57.3% Never married35.7% Now married0.0% Separated0.0% Widowed7.0% DivorcedWomen who gave birth in the past 12 months Now married:
0.0% (0)Unmarried:
100.0% (45)
Women who did not give birth in the past 12 months Now married:
13.7% (45)Unmarried:
86.3% (282)
Marital status - White alone, not Hispanic / Latino population 15 years and over
Males 27.9% Never married65.6% Now married0.6% Separated2.8% Widowed3.1% DivorcedFemales 18.4% Never married59.1% Now married0.7% Separated13.1% Widowed8.7% DivorcedWomen who gave birth in the past 12 months Now married:
57.3% (244)Unmarried:
42.7% (182)
Women who did not give birth in the past 12 months Now married:
52.5% (1,451)Unmarried:
47.5% (1,311)
Marital status - Hispanic or Latino population 15 years and over
Males 10.6% Never married88.3% Now married0.0% Separated0.0% Widowed1.1% DivorcedFemales 32.9% Never married51.2% Now married0.0% Separated6.7% Widowed9.1% DivorcedWomen who gave birth in the past 12 months Now married:
100.0% (28)Unmarried:
0.0% (0)
Women who did not give birth in the past 12 months Now married:
31.7% (80)Unmarried:
68.3% (173)
Ancestries in Trinity
2,584 27.5% American956 10.2% Irish855 9.1% Italian699 7.4% English658 7.0% Egyptian621 6.6% German197 2.1% Polish194 2.1% Greek187 2.0% European122 1.3% Lebanese114 1.2% Brazilian100 1.1% Russian87 0.9% Hungarian80 0.9% Dutch71 0.8% Scottish60 0.6% French44 0.5% Scotch-Irish42 0.4% Austrian30 0.3% Canadian29 0.3% French Canadian28 0.3% British28 0.3% Ukrainian27 0.3% Eastern European19 0.2% Welsh17 0.2% Israeli15 0.2% Danish15 0.2% Portuguese13 0.1% Slovak11 0.1% Belgian8 0.09% Slovene7 0.07% Northern European6 0.06% Swedish4 0.04% Norwegian
Children Nativity (place of birth) in Trinity
Children under 6 years - Living with two parents Both parents native 1,147 100.0% NativeBoth parents foreign-born 121 100.0% NativeOne native, one foreign-born parent 40 100.0% NativeChildren under 6 years - Living with one parent Native parent 95 100.0% NativeForeign-born parent 162 100.0% NativeChildren 6 to 17 years - Living with two parents Both parents native 1,855 100.0% NativeBoth parents foreign-born 204 79.9% Native51 20.1% Foreign-bornOne native, one foreign-born parent 209 81.5% Native48 18.5% Foreign-bornChildren 6 to 17 years - Living with one parent Native parent 318 63.7% Native181 36.3% Foreign-bornForeign-born parent 223 92.2% Native19 7.8% Foreign-born
Grandparents responsible for own grandchildren in Trinity
Grandparents (30 to 59 years) White / Caucasian 13 24.7% Responsible for grandchildren40 75.3% Not responsible for grandchildrenOther race 27 100.0% Responsible for grandchildrenWhite alone, not Hispanic / Latino 14 28.6% Responsible for grandchildren35 71.4% Not responsible for grandchildren
Grandparents (60 years and over) White / Caucasian 160 100.0% Not responsible for grandchildrenWhite alone, not Hispanic / Latino 152 100.0% Not responsible for grandchildren