Races in Trenton, New Jersey (NJ) Detailed Stats
Data:
Races - White alone (%)
Races - White alone (% change since 2000)
Races - Black alone (%)
Races - Black alone (% change since 2000)
Races - American Indian alone (%)
Races - American Indian alone (% change since 2000)
Races - Asian alone (%)
Races - Asian alone (% change since 2000)
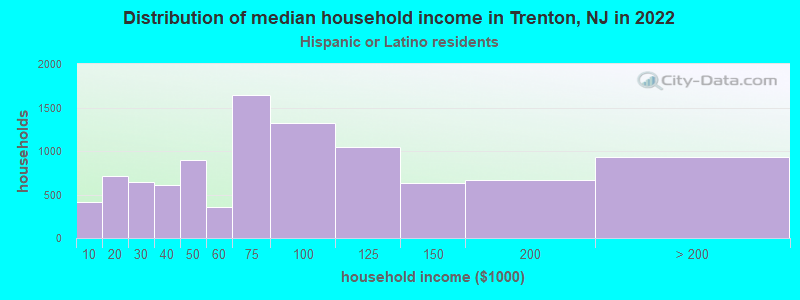
Races - Hispanic (%)
Races - Hispanic (% change since 2000)
Races - Native Hawaiian and Other Pacific Islander alone (%)
Races - Native Hawaiian and Other Pacific Islander alone (% change since 2000)
Races - Two or more races(%)
Races - Two or more races(% change since 2000)
Races - Other race alone (%)
Races - Other race alone (% change since 2000)
Racial diversity
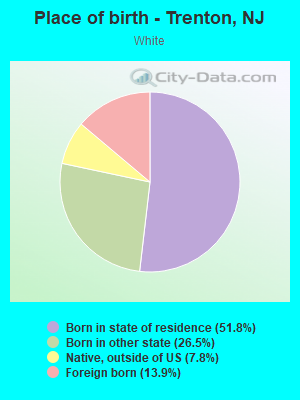
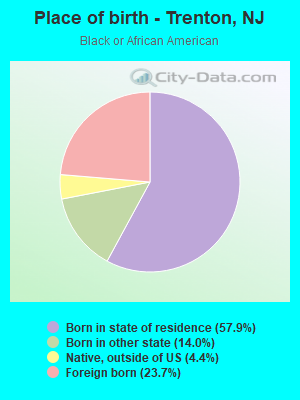
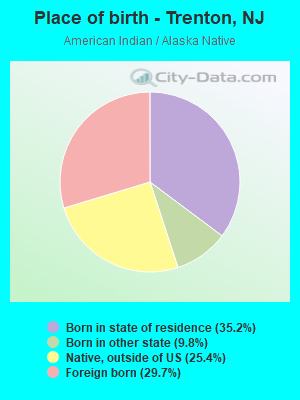
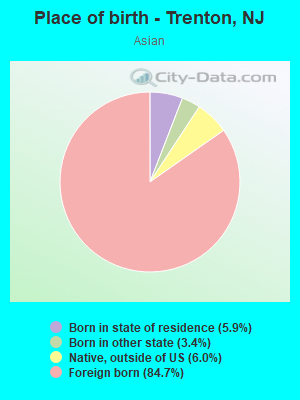
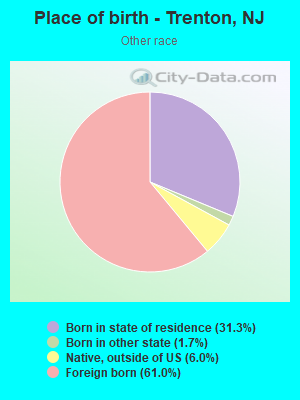
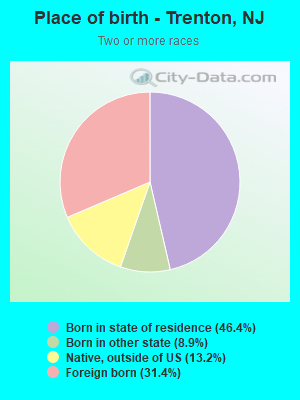
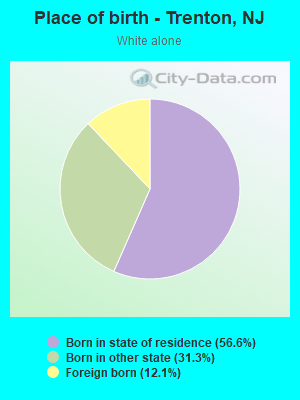
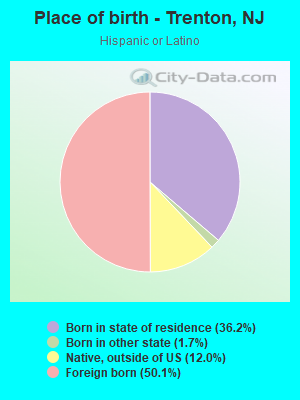
Place of birth - Born in state of residence (%)
Place of birth - Born in state of residence (%) - White
Place of birth - Born in state of residence (%) - Black or African American
Place of birth - Born in state of residence (%) - Asian
Place of birth - Born in state of residence (%) - Hispanic or Latino
Place of birth - Born in state of residence (%) - American Indian and Alaska Native
Place of birth - Born in state of residence (%) - Multirace
Place of birth - Born in state of residence (%) - Other Race
Place of birth - Born in other state (%)
Place of birth - Born in other state (%) - White
Place of birth - Born in other state (%) - Black or African American
Place of birth - Born in other state (%) - Asian
Place of birth - Born in other state (%) - Hispanic or Latino
Place of birth - Born in other state (%) - American Indian and Alaska Native
Place of birth - Born in other state (%) - Multirace
Place of birth - Born in other state (%) - Other Race
Place of birth - Native, outside of US (%)
Place of birth - Native, outside of US (%) - White
Place of birth - Native, outside of US (%) - Black or African American
Place of birth - Native, outside of US (%) - Asian
Place of birth - Native, outside of US (%) - Hispanic or Latino
Place of birth - Native, outside of US (%) - American Indian and Alaska Native
Place of birth - Native, outside of US (%) - Multirace
Place of birth - Native, outside of US (%) - Other Race
Place of birth - Foreign born (%)
Place of birth - Foreign born (%) - White
Place of birth - Foreign born (%) - Black or African American
Place of birth - Foreign born (%) - Asian
Place of birth - Foreign born (%) - Hispanic or Latino
Place of birth - Foreign born (%) - American Indian and Alaska Native
Place of birth - Foreign born (%) - Multirace
Place of birth - Foreign born (%) - Other Race
Residents speaking English at home (%)
Residents speaking English at home - Born in the United States (%)
Residents speaking English at home - Native, born elsewhere (%)
Residents speaking English at home - Foreign born (%)
Residents speaking Spanish at home (%)
Residents speaking Spanish at home - Born in the United States (%)
Residents speaking Spanish at home - Native, born elsewhere (%)
Residents speaking Spanish at home - Foreign born (%)
Residents speaking other language at home (%)
Residents speaking other language at home - Born in the United States (%)
Residents speaking other language at home - Native, born elsewhere (%)
Residents speaking other language at home - Foreign born (%)
Marital status - Never married (%)
Marital status - Now married (%)
Marital status - Separated (%)
Marital status - Widowed (%)
Marital status - Divorced (%)
Ancestries Reported - Arab (%)
Ancestries Reported - Czech (%)
Ancestries Reported - Danish (%)
Ancestries Reported - Dutch (%)
Ancestries Reported - English (%)
Ancestries Reported - French (%)
Ancestries Reported - French Canadian (%)
Ancestries Reported - German (%)
Ancestries Reported - Greek (%)
Ancestries Reported - Hungarian (%)
Ancestries Reported - Irish (%)
Ancestries Reported - Italian (%)
Ancestries Reported - Lithuanian (%)
Ancestries Reported - Norwegian (%)
Ancestries Reported - Polish (%)
Ancestries Reported - Portuguese (%)
Ancestries Reported - Russian (%)
Ancestries Reported - Scotch-Irish (%)
Ancestries Reported - Scottish (%)
Ancestries Reported - Slovak (%)
Ancestries Reported - Subsaharan African (%)
Ancestries Reported - Swedish (%)
Ancestries Reported - Swiss (%)
Ancestries Reported - Ukrainian (%)
Ancestries Reported - United States (%)
Ancestries Reported - Welsh (%)
Ancestries Reported - West Indian (%)
Ancestries Reported - Other (%)
Geographical mobility - Same house 1 year ago (%)
Geographical mobility - Same house 1 year ago (%) - White
Geographical mobility - Same house 1 year ago (%) - Black or African American
Geographical mobility - Same house 1 year ago (%) - Asian
Geographical mobility - Same house 1 year ago (%) - Hispanic or Latino
Geographical mobility - Same house 1 year ago (%) - American Indian and Alaska Native
Geographical mobility - Same house 1 year ago (%) - Multirace
Geographical mobility - Same house 1 year ago (%) - Other Race
Geographical mobility - Moved within same county (%)
Geographical mobility - Moved within same county (%) - White
Geographical mobility - Moved within same county (%) - Black or African American
Geographical mobility - Moved within same county (%) - Asian
Geographical mobility - Moved within same county (%) - Hispanic or Latino
Geographical mobility - Moved within same county (%) - American Indian and Alaska Native
Geographical mobility - Moved within same county (%) - Multirace
Geographical mobility - Moved within same county (%) - Other Race
Geographical mobility - Moved from different county within same state (%)
Geographical mobility - Moved from different county within same state (%) - White
Geographical mobility - Moved from different county within same state (%) - Black or African American
Geographical mobility - Moved from different county within same state (%) - Asian
Geographical mobility - Moved from different county within same state (%) - Hispanic or Latino
Geographical mobility - Moved from different county within same state (%) - American Indian and Alaska Native
Geographical mobility - Moved from different county within same state (%) - Multirace
Geographical mobility - Moved from different county within same state (%) - Other Race
Geographical mobility - Moved from different state (%)
Geographical mobility - Moved from different state (%) - White
Geographical mobility - Moved from different state (%) - Black or African American
Geographical mobility - Moved from different state (%) - Asian
Geographical mobility - Moved from different state (%) - Hispanic or Latino
Geographical mobility - Moved from different state (%) - American Indian and Alaska Native
Geographical mobility - Moved from different state (%) - Multirace
Geographical mobility - Moved from different state (%) - Other Race
Geographical mobility - Moved from abroad (%)
Geographical mobility - Moved from abroad (%) - White
Geographical mobility - Moved from abroad (%) - Black or African American
Geographical mobility - Moved from abroad (%) - Asian
Geographical mobility - Moved from abroad (%) - Hispanic or Latino
Geographical mobility - Moved from abroad (%) - American Indian and Alaska Native
Geographical mobility - Moved from abroad (%) - Multirace
Geographical mobility - Moved from abroad (%) - Other Race
Place of birth for the foreign-born population - Ireland (%)
Place of birth for the foreign-born population - Denmark (%)
Place of birth for the foreign-born population - Norway (%)
Place of birth for the foreign-born population - Sweden (%)
Place of birth for the foreign-born population - United Kingdom (%)
Place of birth for the foreign-born population - England (%)
Place of birth for the foreign-born population - Scotland (%)
Place of birth for the foreign-born population - Other Northern Europe (%)
Place of birth for the foreign-born population - Austria (%)
Place of birth for the foreign-born population - Belgium (%)
Place of birth for the foreign-born population - France (%)
Place of birth for the foreign-born population - Germany (%)
Place of birth for the foreign-born population - Netherlands (%)
Place of birth for the foreign-born population - Switzerland (%)
Place of birth for the foreign-born population - Other Western Europe (%)
Place of birth for the foreign-born population - Greece (%)
Place of birth for the foreign-born population - Italy (%)
Place of birth for the foreign-born population - Portugal (%)
Place of birth for the foreign-born population - Spain (%)
Place of birth for the foreign-born population - Other Southern Europe (%)
Place of birth for the foreign-born population - Albania (%)
Place of birth for the foreign-born population - Belarus (%)
Place of birth for the foreign-born population - Bosnia and Herzegovina (%)
Place of birth for the foreign-born population - Bulgaria (%)
Place of birth for the foreign-born population - Croatia (%)
Place of birth for the foreign-born population - Czechoslovakia (%)
Place of birth for the foreign-born population - Hungary (%)
Place of birth for the foreign-born population - Latvia (%)
Place of birth for the foreign-born population - Lithuania (%)
Place of birth for the foreign-born population - North Macedonia (Macedonia) (%)
Place of birth for the foreign-born population - Moldova (%)
Place of birth for the foreign-born population - Poland (%)
Place of birth for the foreign-born population - Romania (%)
Place of birth for the foreign-born population - Russia (%)
Place of birth for the foreign-born population - Serbia (%)
Place of birth for the foreign-born population - Ukraine (%)
Place of birth for the foreign-born population - Other Eastern Europe (%)
Place of birth for the foreign-born population - China (%)
Place of birth for the foreign-born population - Hong Kong (%)
Place of birth for the foreign-born population - Taiwan (%)
Place of birth for the foreign-born population - Japan (%)
Place of birth for the foreign-born population - Korea (%)
Place of birth for the foreign-born population - Other Eastern Asia (%)
Place of birth for the foreign-born population - Afghanistan (%)
Place of birth for the foreign-born population - Bangladesh (%)
Place of birth for the foreign-born population - India (%)
Place of birth for the foreign-born population - Iran (%)
Place of birth for the foreign-born population - Kazakhstan (%)
Place of birth for the foreign-born population - Nepal (%)
Place of birth for the foreign-born population - Pakistan (%)
Place of birth for the foreign-born population - Sri Lanka (%)
Place of birth for the foreign-born population - Uzbekistan (%)
Place of birth for the foreign-born population - Other South Central Asia (%)
Place of birth for the foreign-born population - Burma (%)
Place of birth for the foreign-born population - Cambodia (%)
Place of birth for the foreign-born population - Indonesia (%)
Place of birth for the foreign-born population - Laos (%)
Place of birth for the foreign-born population - Malaysia (%)
Place of birth for the foreign-born population - Philippines (%)
Place of birth for the foreign-born population - Singapore (%)
Place of birth for the foreign-born population - Thailand (%)
Place of birth for the foreign-born population - Vietnam (%)
Place of birth for the foreign-born population - Other South Eastern Asia (%)
Place of birth for the foreign-born population - Armenia (%)
Place of birth for the foreign-born population - Iraq (%)
Place of birth for the foreign-born population - Israel (%)
Place of birth for the foreign-born population - Jordan (%)
Place of birth for the foreign-born population - Kuwait (%)
Place of birth for the foreign-born population - Lebanon (%)
Place of birth for the foreign-born population - Saudi Arabia (%)
Place of birth for the foreign-born population - Syria (%)
Place of birth for the foreign-born population - Turkey (%)
Place of birth for the foreign-born population - Yemen (%)
Place of birth for the foreign-born population - Other Western Asia (%)
Place of birth for the foreign-born population - Eritrea (%)
Place of birth for the foreign-born population - Ethiopia (%)
Place of birth for the foreign-born population - Kenya (%)
Place of birth for the foreign-born population - Somalia (%)
Place of birth for the foreign-born population - Uganda (%)
Place of birth for the foreign-born population - Zimbabwe (%)
Place of birth for the foreign-born population - Other Eastern Africa (%)
Place of birth for the foreign-born population - Cameroon (%)
Place of birth for the foreign-born population - Congo (%)
Place of birth for the foreign-born population - Democratic Republic of Congo (Zaire) (%)
Place of birth for the foreign-born population - Other Middle Africa (%)
Place of birth for the foreign-born population - Egypt (%)
Place of birth for the foreign-born population - Morocco (%)
Place of birth for the foreign-born population - Sudan (%)
Place of birth for the foreign-born population - Other Northern Africa (%)
Place of birth for the foreign-born population - South Africa (%)
Place of birth for the foreign-born population - Other Southern Africa (%)
Place of birth for the foreign-born population - Cabo Verde (%)
Place of birth for the foreign-born population - Ghana (%)
Place of birth for the foreign-born population - Liberia (%)
Place of birth for the foreign-born population - Nigeria (%)
Place of birth for the foreign-born population - Senegal (%)
Place of birth for the foreign-born population - Sierra Leone (%)
Place of birth for the foreign-born population - Other Western Africa (%)
Place of birth for the foreign-born population - Australia (%)
Place of birth for the foreign-born population - New Zealand (%)
Place of birth for the foreign-born population - Fiji (%)
Place of birth for the foreign-born population - Micronesia (%)
Place of birth for the foreign-born population - Bahamas (%)
Place of birth for the foreign-born population - Barbados (%)
Place of birth for the foreign-born population - Cuba (%)
Place of birth for the foreign-born population - Dominica (%)
Place of birth for the foreign-born population - Dominican Republic (%)
Place of birth for the foreign-born population - Grenada (%)
Place of birth for the foreign-born population - Haiti (%)
Place of birth for the foreign-born population - Jamaica (%)
Place of birth for the foreign-born population - St. Vincent and the Grenadines (%)
Place of birth for the foreign-born population - Trinidad and Tobago (%)
Place of birth for the foreign-born population - West Indies (%)
Place of birth for the foreign-born population - Other Caribbean (%)
Place of birth for the foreign-born population - Belize (%)
Place of birth for the foreign-born population - Costa Rica (%)
Place of birth for the foreign-born population - El Salvador (%)
Place of birth for the foreign-born population - Guatemala (%)
Place of birth for the foreign-born population - Honduras (%)
Place of birth for the foreign-born population - Mexico (%)
Place of birth for the foreign-born population - Nicaragua (%)
Place of birth for the foreign-born population - Panama (%)
Place of birth for the foreign-born population - Other Central America (%)
Place of birth for the foreign-born population - Argentina (%)
Place of birth for the foreign-born population - Bolivia (%)
Place of birth for the foreign-born population - Brazil (%)
Place of birth for the foreign-born population - Chile (%)
Place of birth for the foreign-born population - Colombia (%)
Place of birth for the foreign-born population - Ecuador (%)
Place of birth for the foreign-born population - Guyana (%)
Place of birth for the foreign-born population - Peru (%)
Place of birth for the foreign-born population - Uruguay (%)
Place of birth for the foreign-born population - Venezuela (%)
Place of birth for the foreign-born population - Other South America (%)
Place of birth for the foreign-born population - Canada (%)
Place of birth for the foreign-born population - Other Northern America (%)
Place of birth for the foreign-born population - Other (%)
Latest news about races in Trenton, NJ collected exclusively by city-data.com from local newspapers, TV, and radio stations
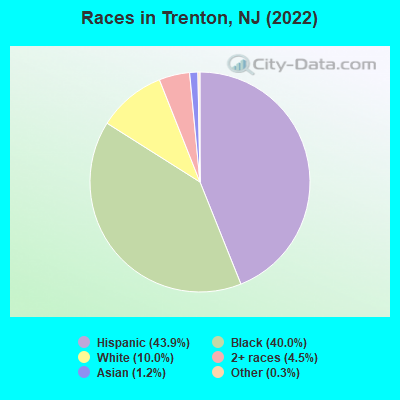
According to 2022 data, the most numerous races in Trenton, NJ are White alone (9,005 residents), Hispanic (39,380 residents), and Black alone (35,841 residents). 52.5% of Trenton residents speak English at home. 26.9% of Trenton, NJ residents are foreign-born (20.4% born in Latin America, 3.7% born in Africa), which is 14.4% greater than the foreign-born rate of 23.0% across the entire state of New Jersey.
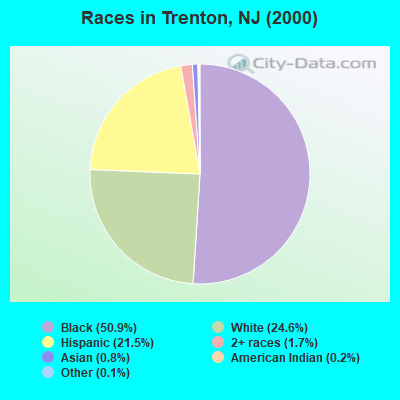
Race distribution in Trenton
2000 2022
5,557,209 66.0% White alone 1,117,191 13.3% Hispanic 1,096,171 13.0% Black alone 477,012 5.7% Asian alone 133,689 1.6% Two or more races 19,565 0.2% Other race alone 11,338 0.1% American Indian alone 2,175 0.03% Native Hawaiian and Other
4,766,476 51.5% White alone 2,028,470 21.9% Hispanic 1,111,632 12.0% Black alone 923,546 10.0% Asian alone 332,237 3.6% Two or more races 89,847 1.0% Other race alone 8,557 0.09% American Indian alone 934 0.01% Native Hawaiian and Other
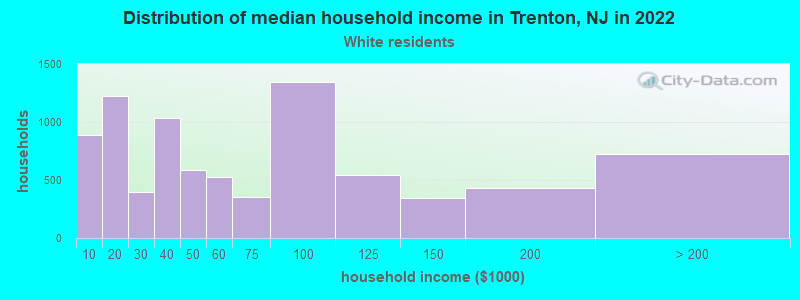
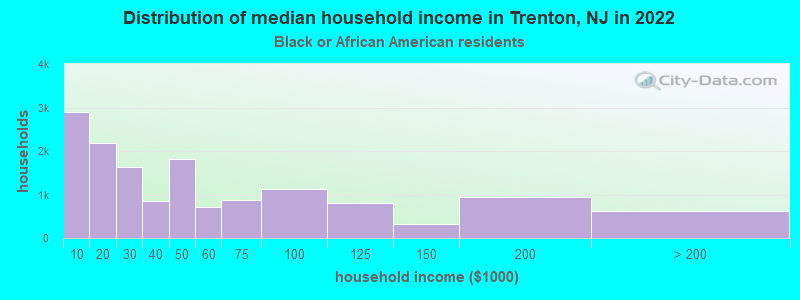
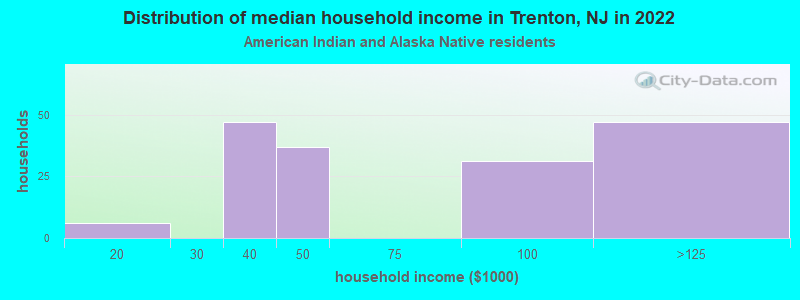
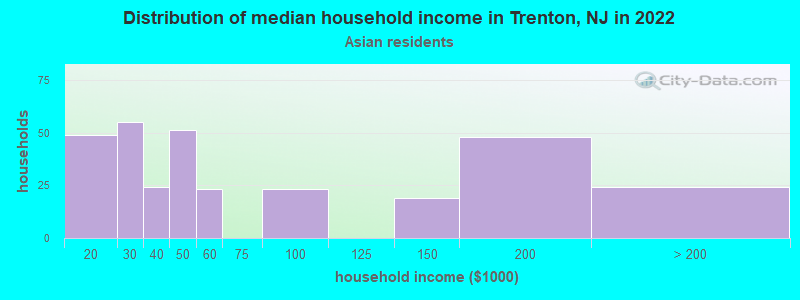
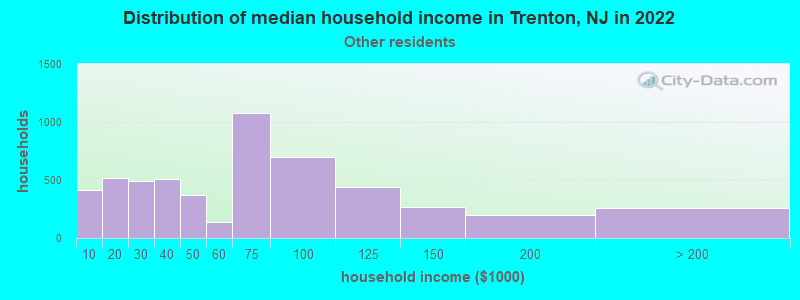
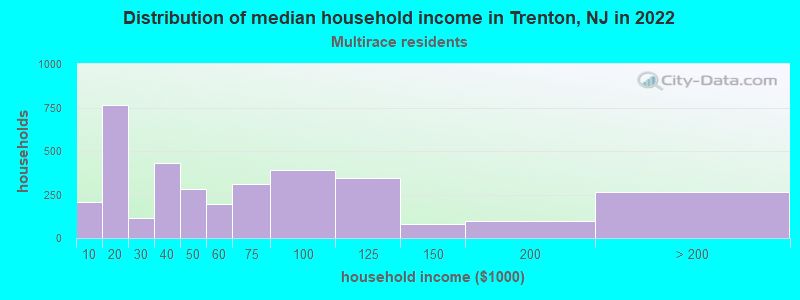
Income and house value in Trenton Median household income in 2022 $54,590 White non-Hispanic householders$38,545 Black householders$136,176 Asian householders$73,072 Some other race householders$74,260 Two or more races householders$73,722 Hispanic or Latino race householdersMedian 2022 house value $169,756 White Non-Hispanic householders$161,818 Black or African American householders$456,011 American Indian or Alaska Native householders $528,215 Asian householders$352,058 Native Hawaiian and other Pacific Islander householders$167,707 Some other race householders$170,524 Two or more races householders$171,292 Hispanic or Latino householders
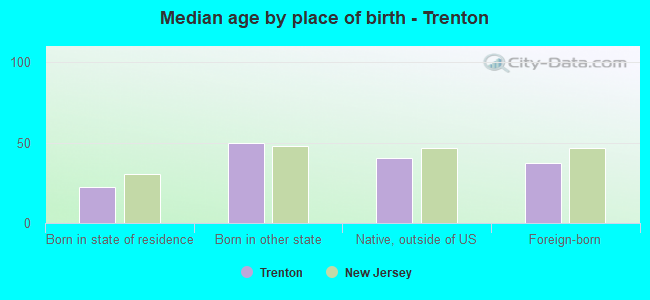
Median age by race in Trenton
45.9 Median age for White residents44.5 46.8 36.5 Median age for Black or African American residents38.3 33.6 44.8 Median age for American Indian / Alaska Native residents58.7 54.2 40.3 Median age for Asian residents42.6 40.2 -666,666,666.0 Median age for Native Hawaiian / Pacific Islander residents-666,666,666.0 -666,666,666.0 27.2 Median age for Other race residents30.5 23.9 32.4 Median age for Two or more races residents32.7 31.8 55.0 Median age for White alone residents53.9 55.1 28.9 Median age for Hispanic or Latino residents33.0 26.8
Owner/renter occupied households by race in Trenton
House owners and renters - White residents 2,594 50.6% Owner occupied2,532 49.4% Renter occupiedHouse owners and renters - Black or African American residents 6,480 43.8% Owner occupied8,308 56.2% Renter occupiedHouse owners and renters - American Indian / Alaska Native residents 49 21.0% Owner occupied184 79.0% Renter occupiedHouse owners and renters - Asian residents 162 42.9% Owner occupied215 57.1% Renter occupiedHouse owners and renters - Other race residents 2,156 42.0% Owner occupied2,979 58.0% Renter occupiedHouse owners and renters - Two or more races residents 2,374 48.1% Owner occupied2,558 51.9% Renter occupiedHouse owners and renters - White alone residents 2,399 53.7% Owner occupied2,065 46.3% Renter occupiedHouse owners and renters - Hispanic or Latino residents 4,371 44.3% Owner occupied5,506 55.7% Renter occupied
Language usage in Trenton
English speakers - Total 52.5% of residents of Trenton speak English at home.
39.1% of residents speak Spanish at home 14,436 45.3% Speak English very well17,407 54.7% Speak English less than very well8.4% of residents speak other language at home 4,388 63.9% Speak English very well2,482 36.1% Speak English less than very well
English speakers - Born in the United States 82.5% of residents of Trenton speak English at home.
10.7% of residents speak Spanish at home 980 89.0% Speak English very well121 11.0% Speak English less than very well6.8% of residents speak other language at home 697 100.0% Speak English very well
English speakers - Native, born elsewhere 26.5% of residents of Trenton speak English at home.
70.1% of residents speak Spanish at home 2,618 62.7% Speak English very well1,560 37.3% Speak English less than very well3.4% of residents speak other language at home 203 100.0% Speak English very well
English speakers - Foreign-born 26.0% of residents of Trenton speak English at home.
58.0% of residents speak Spanish at home 3,805 21.8% Speak English very well13,661 78.2% Speak English less than very well16.0% of residents speak other language at home 2,334 48.5% Speak English very well2,482 51.5% Speak English less than very well
White (Caucasian) - Speak only English Native:
77.4% (6,772)Foreign-born:
14.2% (220)
White (Caucasian) - Speak another language Native:
22.6% (1,974)Foreign-born:
85.8% (1,325)
Black or African American - Speak only English Native:
94.8% (24,232)Foreign-born:
60.1% (5,222)
Black or African American - Speak another language Native:
5.2% (1,316)Foreign-born:
39.9% (3,463)
American Indian / Alaska Native - Speak another language Native:
100.0% (316)Foreign-born:
97.6% (182)
Asian - Speak only English Native:
91.5% (111)Foreign-born:
24.8% (218)
Asian - Speak another language Native:
8.0% (10)Foreign-born:
72.6% (637)
Other race - Speak only English Native:
3.4% (224)Foreign-born:
8.0% (1,102)
Other race - Speak another language Native:
96.6% (6,272)Foreign-born:
92.0% (12,703)
Two or more races - Speak only English Native:
32.7% (3,235)Foreign-born:
24.4% (1,284)
Two or more races - Speak another language Native:
67.3% (6,651)Foreign-born:
75.6% (3,981)
White alone - Speak only English Native:
90.3% (9,097)Foreign-born:
10.8% (90)
White alone - Speak another language Native:
10.6% (1,072)Foreign-born:
92.9% (777)
Hispanic or Latino - Speak only English Native:
12.2% (1,893)Foreign-born:
10.3% (2,006)
Hispanic or Latino - Speak another language Native:
87.8% (13,636)Foreign-born:
89.7% (17,382)
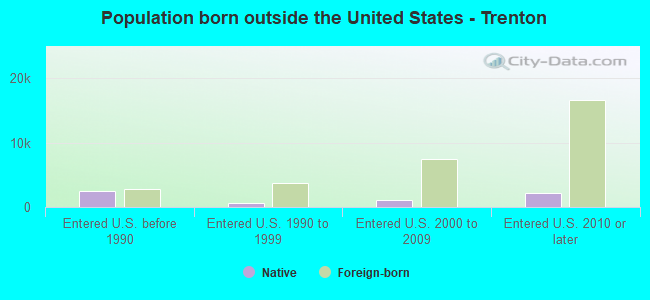
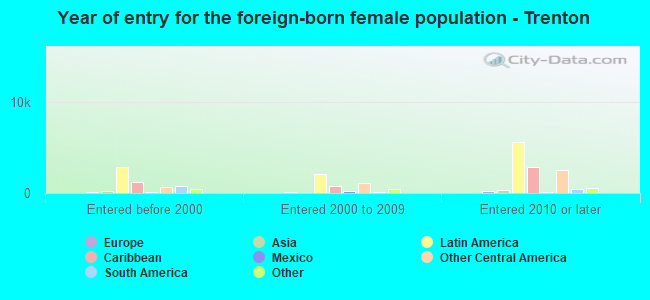
Foreign-born residents in Trenton 23,994 residents are foreign born (20.4% Latin America , 3.7% Africa ).
This city:
26.9%New Jersey:
23.2%
Marital status for residents in Trenton Marital status - White (Caucasian) population 15 years and over
Males 54.3% Never married34.5% Now married2.4% Separated0.0% Widowed8.8% DivorcedFemales 28.1% Never married34.5% Now married2.1% Separated20.1% Widowed15.3% DivorcedWomen who gave birth in the past 12 months Now married:
77.1% (93)Unmarried:
22.9% (28)
Women who did not give birth in the past 12 months Now married:
44.9% (1,522)Unmarried:
55.1% (1,867)
Marital status - Black or African American population 15 years and over
Males 56.6% Never married27.4% Now married1.0% Separated0.9% Widowed14.2% DivorcedFemales 52.9% Never married19.3% Now married2.9% Separated11.8% Widowed13.2% DivorcedWomen who gave birth in the past 12 months Now married:
33.1% (148)Unmarried:
66.9% (298)
Women who did not give birth in the past 12 months Now married:
20.5% (1,836)Unmarried:
79.5% (7,110)
Marital status - American Indian / Alaska Native population 15 years and over
Males 36.8% Never married40.8% Now married0.0% Separated16.1% Widowed6.3% DivorcedFemales 51.0% Never married27.3% Now married0.0% Separated0.0% Widowed21.7% DivorcedWomen who did not give birth in the past 12 months Now married:
25.4% (46)Unmarried:
74.6% (136)
Marital status - Asian population 15 years and over
Males 55.5% Never married40.6% Now married0.0% Separated0.0% Widowed3.9% DivorcedFemales 28.3% Never married50.5% Now married0.0% Separated6.6% Widowed14.7% DivorcedWomen who gave birth in the past 12 months Now married:
100.0% (64)Unmarried:
0.0% (0)
Women who did not give birth in the past 12 months Now married:
49.0% (121)Unmarried:
51.0% (126)
Marital status - Other race population 15 years and over
Males 45.1% Never married47.8% Now married4.5% Separated0.0% Widowed2.5% DivorcedFemales 29.5% Never married44.7% Now married5.2% Separated6.9% Widowed13.7% DivorcedWomen who gave birth in the past 12 months Now married:
67.3% (651)Unmarried:
32.7% (316)
Women who did not give birth in the past 12 months Now married:
46.1% (2,077)Unmarried:
53.9% (2,430)
Marital status - Two or more races population 15 years and over
Males 71.0% Never married22.7% Now married2.5% Separated0.0% Widowed3.8% DivorcedFemales 51.3% Never married22.5% Now married2.1% Separated13.4% Widowed10.7% DivorcedWomen who gave birth in the past 12 months Now married:
39.4% (52)Unmarried:
60.6% (80)
Women who did not give birth in the past 12 months Now married:
34.8% (1,082)Unmarried:
65.2% (2,029)
Marital status - White alone, not Hispanic / Latino population 15 years and over
Males 56.8% Never married30.7% Now married2.7% Separated0.0% Widowed9.8% DivorcedFemales 26.1% Never married32.2% Now married2.5% Separated24.0% Widowed15.2% DivorcedWomen who gave birth in the past 12 months Now married:
89.0% (73)Unmarried:
11.0% (9)
Women who did not give birth in the past 12 months Now married:
33.4% (471)Unmarried:
66.6% (940)
Marital status - Hispanic or Latino population 15 years and over
Males 50.6% Never married42.7% Now married3.8% Separated0.0% Widowed2.9% DivorcedFemales 39.7% Never married36.0% Now married3.8% Separated5.7% Widowed14.8% DivorcedWomen who gave birth in the past 12 months Now married:
58.7% (651)Unmarried:
41.3% (458)
Women who did not give birth in the past 12 months Now married:
36.6% (3,315)Unmarried:
63.4% (5,736)
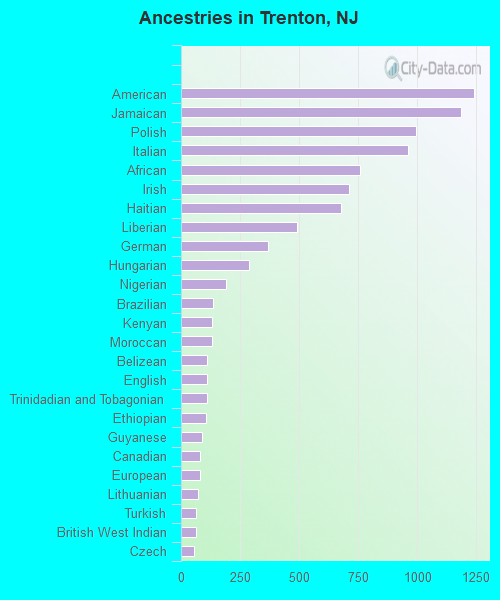
Ancestries in Trenton
1,242 2.1% American1,184 2.0% Jamaican997 1.7% Polish962 1.6% Italian760 1.3% African711 1.2% Irish677 1.1% Haitian492 0.8% Liberian369 0.6% German290 0.5% Hungarian190 0.3% Nigerian136 0.2% Brazilian131 0.2% Kenyan130 0.2% Moroccan111 0.2% Belizean109 0.2% English109 0.2% Trinidadian and Tobagonian107 0.2% Ethiopian91 0.2% Guyanese79 0.1% Canadian79 0.1% European71 0.1% Lithuanian65 0.1% Turkish63 0.1% British West Indian53 0.09% Czech49 0.08% Ghanaian46 0.08% Sudanese42 0.07% Russian42 0.07% Ukrainian39 0.07% U.S. Virgin Islander31 0.05% Dutch27 0.05% Scotch-Irish22 0.04% Portuguese20 0.03% West Indian15 0.03% British15 0.03% Slavic10 0.02% French7 0.01% Arab7 0.01% Slovak7 0.01% Bulgarian3 0.01% Norwegian
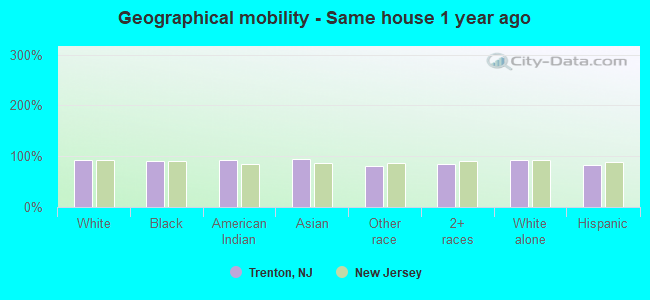
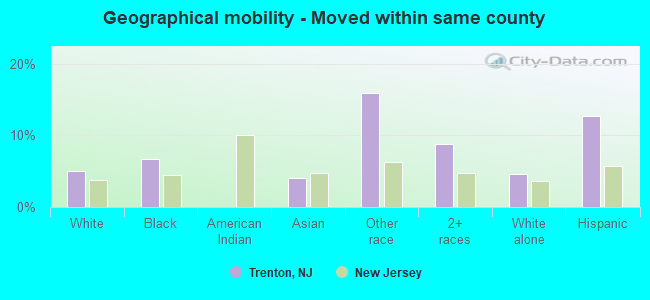
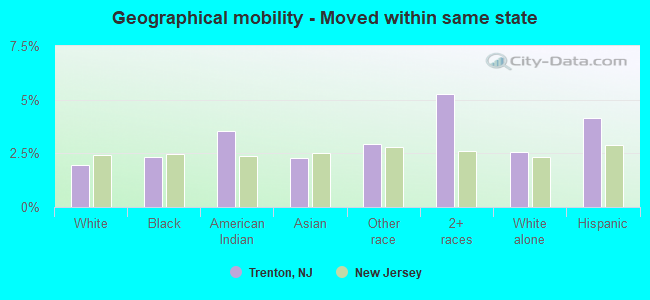
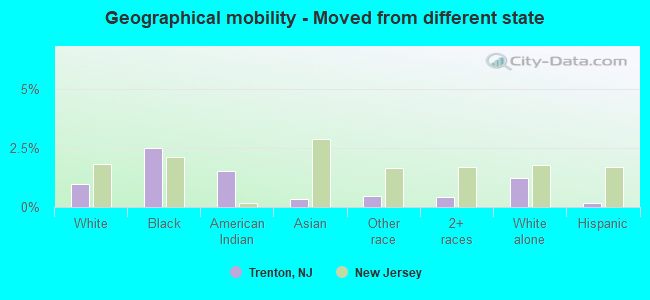
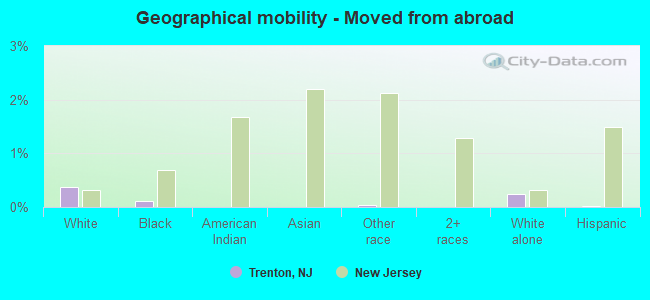
Geographical mobility in Trenton Same house 1 year ago 17,945 92.2% White (Caucasian)33,658 90.2% Black or African American569 92.0% American Indian / Alaska Native1,026 94.7% Asian17,856 80.7% Other race14,414 85.4% Two or more races10,349 91.7% White alone, not Hispanic / Latino31,551 82.9% Hispanic or LatinoMoved within same county 974 5.0% White / Caucasian2,494 6.7% Black or African American43 4.0% Asian3,511 15.9% Other race1,494 8.9% Two or more races520 4.6% White alone, not Hispanic / Latino4,848 12.7% Hispanic or LatinoMoved within same state 384 2.0% White / Caucasian867 2.3% Black or African American22 3.6% American Indian / Alaska Native25 2.3% Asian649 2.9% Other race892 5.3% Two or more races291 2.6% White alone, not Hispanic / Latino1,570 4.1% Hispanic or LatinoMoved from different state 187 1.0% White / Caucasian937 2.5% Black or African American9 1.5% American Indian / Alaska Native4 0.3% Asian99 0.4% Other race72 0.4% Two or more races139 1.2% White alone, not Hispanic / Latino72 0.2% Hispanic or LatinoMoved from abroad 73 0.4% White44 0.1% Black or African American10 0.0% Other race28 0.2% White alone, not Hispanic / Latino10 0.0% Hispanic or Latino
Children Nativity (place of birth) in Trenton
Children under 6 years - Living with two parents Both parents native 541 100.0% NativeBoth parents foreign-born 1,218 86.0% Native198 14.0% Foreign-bornOne native, one foreign-born parent 795 100.0% NativeChildren under 6 years - Living with one parent Native parent 3,032 100.0% NativeForeign-born parent 2,835 87.3% Native414 12.7% Foreign-bornChildren 6 to 17 years - Living with two parents Both parents native 1,236 100.0% NativeBoth parents foreign-born 2,472 75.6% Native798 24.4% Foreign-bornOne native, one foreign-born parent 691 96.5% Native25 3.5% Foreign-bornChildren 6 to 17 years - Living with one parent Native parent 4,538 100.0% NativeForeign-born parent 3,167 58.2% Native2,273 41.8% Foreign-born
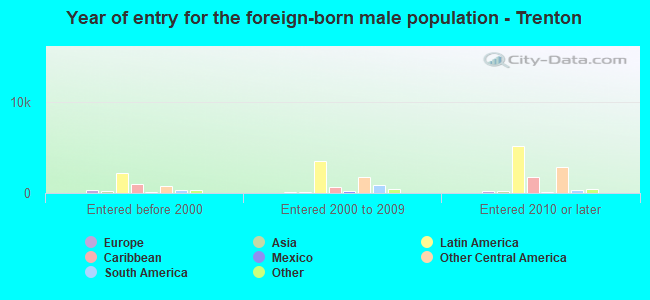
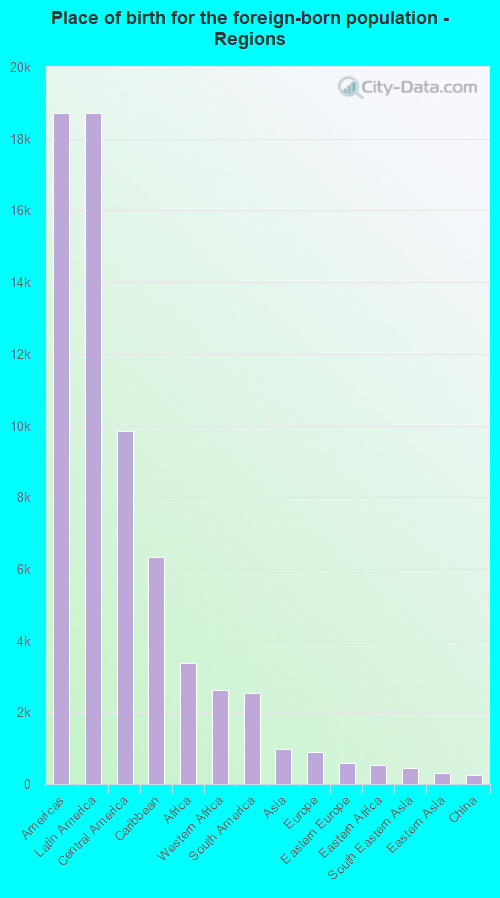
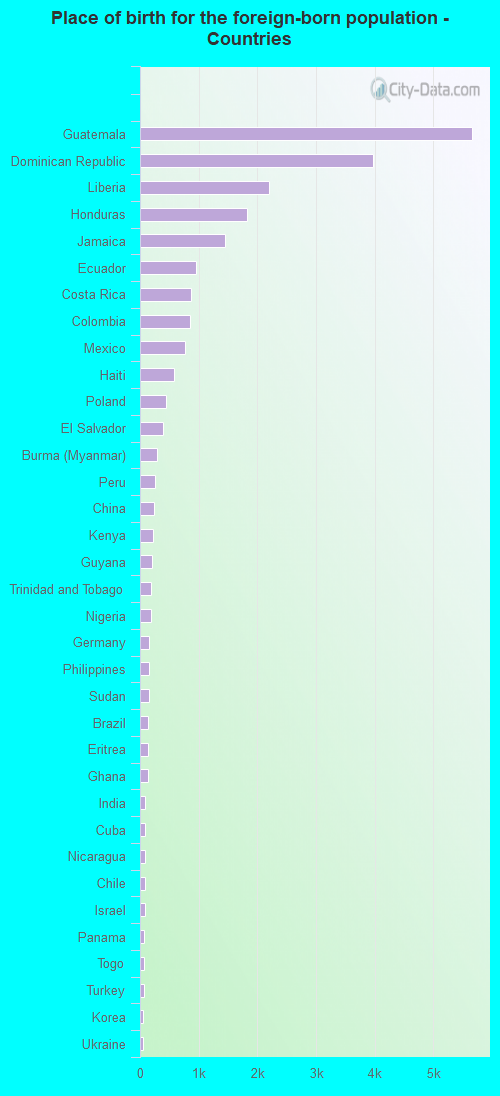
Place of birth for residents in Trenton 18,727 Americas18,712 Latin America9,843 Central America6,338 Caribbean3,372 Africa2,631 Western Africa2,530 South America987 Asia906 Europe587 Eastern Europe530 Eastern Africa455 South Eastern Asia302 Eastern Asia244 China169 Western Europe164 Northern Africa139 Western Asia93 Southern Europe89 South Central Asia55 Northern Europe17 Southern Africa15 Northern America5,665 Guatemala3,966 Dominican Republic2,195 Liberia1,827 Honduras1,447 Jamaica947 Ecuador862 Costa Rica850 Colombia768 Mexico578 Haiti435 Poland395 El Salvador294 Burma (Myanmar)263 Peru244 China218 Kenya207 Guyana195 Trinidad and Tobago189 Nigeria161 Germany150 Philippines148 Sudan139 Brazil138 Eritrea137 Ghana89 India82 Cuba79 Nicaragua79 Chile78 Israel73 Panama71 Togo61 Turkey58 Korea58 Ukraine48 United Kingdom41 Russia39 Belize37 Spain34 St. Lucia29 Portugal26 Italy25 Venezuela19 Czechoslovakia17 Argentina16 Egypt15 Canada14 Belarus10 Indonesia9 Hungary9 Bulgaria8 Netherlands7 England
Grandparents responsible for own grandchildren in Trenton
Grandparents (30 to 59 years) White / Caucasian 46 66.9% Responsible for grandchildren23 33.1% Not responsible for grandchildrenBlack or African American 188 43.7% Responsible for grandchildren242 56.3% Not responsible for grandchildrenAmerican Indian / Alaska Native 55 100.0% Not responsible for grandchildrenOther race 81 25.3% Responsible for grandchildren238 74.7% Not responsible for grandchildrenTwo or more races 20 100.0% Not responsible for grandchildrenHispanic or Latino 147 36.9% Responsible for grandchildren251 63.1% Not responsible for grandchildrenGrandparents (60 years and over) White / Caucasian 71 34.5% Responsible for grandchildren134 65.5% Not responsible for grandchildrenBlack or African American 266 54.3% Responsible for grandchildren224 45.7% Not responsible for grandchildrenOther race 11 10.1% Responsible for grandchildren98 89.9% Not responsible for grandchildrenTwo or more races 17 8.1% Responsible for grandchildren193 91.9% Not responsible for grandchildrenHispanic or Latino 46 15.3% Responsible for grandchildren252 84.7% Not responsible for grandchildren