Races in Town 'n' Country, Florida (FL) Detailed Stats
Data:
Races - White alone (%)
Races - White alone (% change since 2000)
Races - Black alone (%)
Races - Black alone (% change since 2000)
Races - American Indian alone (%)
Races - American Indian alone (% change since 2000)
Races - Asian alone (%)
Races - Asian alone (% change since 2000)
Races - Hispanic (%)
Races - Hispanic (% change since 2000)
Races - Native Hawaiian and Other Pacific Islander alone (%)
Races - Native Hawaiian and Other Pacific Islander alone (% change since 2000)
Races - Two or more races(%)
Races - Two or more races(% change since 2000)
Races - Other race alone (%)
Races - Other race alone (% change since 2000)
Racial diversity
Place of birth - Born in state of residence (%)
Place of birth - Born in state of residence (%) - White
Place of birth - Born in state of residence (%) - Black or African American
Place of birth - Born in state of residence (%) - Asian
Place of birth - Born in state of residence (%) - Hispanic or Latino
Place of birth - Born in state of residence (%) - American Indian and Alaska Native
Place of birth - Born in state of residence (%) - Multirace
Place of birth - Born in state of residence (%) - Other Race
Place of birth - Born in other state (%)
Place of birth - Born in other state (%) - White
Place of birth - Born in other state (%) - Black or African American
Place of birth - Born in other state (%) - Asian
Place of birth - Born in other state (%) - Hispanic or Latino
Place of birth - Born in other state (%) - American Indian and Alaska Native
Place of birth - Born in other state (%) - Multirace
Place of birth - Born in other state (%) - Other Race
Place of birth - Native, outside of US (%)
Place of birth - Native, outside of US (%) - White
Place of birth - Native, outside of US (%) - Black or African American
Place of birth - Native, outside of US (%) - Asian
Place of birth - Native, outside of US (%) - Hispanic or Latino
Place of birth - Native, outside of US (%) - American Indian and Alaska Native
Place of birth - Native, outside of US (%) - Multirace
Place of birth - Native, outside of US (%) - Other Race
Place of birth - Foreign born (%)
Place of birth - Foreign born (%) - White
Place of birth - Foreign born (%) - Black or African American
Place of birth - Foreign born (%) - Asian
Place of birth - Foreign born (%) - Hispanic or Latino
Place of birth - Foreign born (%) - American Indian and Alaska Native
Place of birth - Foreign born (%) - Multirace
Place of birth - Foreign born (%) - Other Race
Residents speaking English at home (%)
Residents speaking English at home - Born in the United States (%)
Residents speaking English at home - Native, born elsewhere (%)
Residents speaking English at home - Foreign born (%)
Residents speaking Spanish at home (%)
Residents speaking Spanish at home - Born in the United States (%)
Residents speaking Spanish at home - Native, born elsewhere (%)
Residents speaking Spanish at home - Foreign born (%)
Residents speaking other language at home (%)
Residents speaking other language at home - Born in the United States (%)
Residents speaking other language at home - Native, born elsewhere (%)
Residents speaking other language at home - Foreign born (%)
Marital status - Never married (%)
Marital status - Now married (%)
Marital status - Separated (%)
Marital status - Widowed (%)
Marital status - Divorced (%)
Ancestries Reported - Arab (%)
Ancestries Reported - Czech (%)
Ancestries Reported - Danish (%)
Ancestries Reported - Dutch (%)
Ancestries Reported - English (%)
Ancestries Reported - French (%)
Ancestries Reported - French Canadian (%)
Ancestries Reported - German (%)
Ancestries Reported - Greek (%)
Ancestries Reported - Hungarian (%)
Ancestries Reported - Irish (%)
Ancestries Reported - Italian (%)
Ancestries Reported - Lithuanian (%)
Ancestries Reported - Norwegian (%)
Ancestries Reported - Polish (%)
Ancestries Reported - Portuguese (%)
Ancestries Reported - Russian (%)
Ancestries Reported - Scotch-Irish (%)
Ancestries Reported - Scottish (%)
Ancestries Reported - Slovak (%)
Ancestries Reported - Subsaharan African (%)
Ancestries Reported - Swedish (%)
Ancestries Reported - Swiss (%)
Ancestries Reported - Ukrainian (%)
Ancestries Reported - United States (%)
Ancestries Reported - Welsh (%)
Ancestries Reported - West Indian (%)
Ancestries Reported - Other (%)
Geographical mobility - Same house 1 year ago (%)
Geographical mobility - Same house 1 year ago (%) - White
Geographical mobility - Same house 1 year ago (%) - Black or African American
Geographical mobility - Same house 1 year ago (%) - Asian
Geographical mobility - Same house 1 year ago (%) - Hispanic or Latino
Geographical mobility - Same house 1 year ago (%) - American Indian and Alaska Native
Geographical mobility - Same house 1 year ago (%) - Multirace
Geographical mobility - Same house 1 year ago (%) - Other Race
Geographical mobility - Moved within same county (%)
Geographical mobility - Moved within same county (%) - White
Geographical mobility - Moved within same county (%) - Black or African American
Geographical mobility - Moved within same county (%) - Asian
Geographical mobility - Moved within same county (%) - Hispanic or Latino
Geographical mobility - Moved within same county (%) - American Indian and Alaska Native
Geographical mobility - Moved within same county (%) - Multirace
Geographical mobility - Moved within same county (%) - Other Race
Geographical mobility - Moved from different county within same state (%)
Geographical mobility - Moved from different county within same state (%) - White
Geographical mobility - Moved from different county within same state (%) - Black or African American
Geographical mobility - Moved from different county within same state (%) - Asian
Geographical mobility - Moved from different county within same state (%) - Hispanic or Latino
Geographical mobility - Moved from different county within same state (%) - American Indian and Alaska Native
Geographical mobility - Moved from different county within same state (%) - Multirace
Geographical mobility - Moved from different county within same state (%) - Other Race
Geographical mobility - Moved from different state (%)
Geographical mobility - Moved from different state (%) - White
Geographical mobility - Moved from different state (%) - Black or African American
Geographical mobility - Moved from different state (%) - Asian
Geographical mobility - Moved from different state (%) - Hispanic or Latino
Geographical mobility - Moved from different state (%) - American Indian and Alaska Native
Geographical mobility - Moved from different state (%) - Multirace
Geographical mobility - Moved from different state (%) - Other Race
Geographical mobility - Moved from abroad (%)
Geographical mobility - Moved from abroad (%) - White
Geographical mobility - Moved from abroad (%) - Black or African American
Geographical mobility - Moved from abroad (%) - Asian
Geographical mobility - Moved from abroad (%) - Hispanic or Latino
Geographical mobility - Moved from abroad (%) - American Indian and Alaska Native
Geographical mobility - Moved from abroad (%) - Multirace
Geographical mobility - Moved from abroad (%) - Other Race
Place of birth for the foreign-born population - Ireland (%)
Place of birth for the foreign-born population - Denmark (%)
Place of birth for the foreign-born population - Norway (%)
Place of birth for the foreign-born population - Sweden (%)
Place of birth for the foreign-born population - United Kingdom (%)
Place of birth for the foreign-born population - England (%)
Place of birth for the foreign-born population - Scotland (%)
Place of birth for the foreign-born population - Other Northern Europe (%)
Place of birth for the foreign-born population - Austria (%)
Place of birth for the foreign-born population - Belgium (%)
Place of birth for the foreign-born population - France (%)
Place of birth for the foreign-born population - Germany (%)
Place of birth for the foreign-born population - Netherlands (%)
Place of birth for the foreign-born population - Switzerland (%)
Place of birth for the foreign-born population - Other Western Europe (%)
Place of birth for the foreign-born population - Greece (%)
Place of birth for the foreign-born population - Italy (%)
Place of birth for the foreign-born population - Portugal (%)
Place of birth for the foreign-born population - Spain (%)
Place of birth for the foreign-born population - Other Southern Europe (%)
Place of birth for the foreign-born population - Albania (%)
Place of birth for the foreign-born population - Belarus (%)
Place of birth for the foreign-born population - Bosnia and Herzegovina (%)
Place of birth for the foreign-born population - Bulgaria (%)
Place of birth for the foreign-born population - Croatia (%)
Place of birth for the foreign-born population - Czechoslovakia (%)
Place of birth for the foreign-born population - Hungary (%)
Place of birth for the foreign-born population - Latvia (%)
Place of birth for the foreign-born population - Lithuania (%)
Place of birth for the foreign-born population - North Macedonia (Macedonia) (%)
Place of birth for the foreign-born population - Moldova (%)
Place of birth for the foreign-born population - Poland (%)
Place of birth for the foreign-born population - Romania (%)
Place of birth for the foreign-born population - Russia (%)
Place of birth for the foreign-born population - Serbia (%)
Place of birth for the foreign-born population - Ukraine (%)
Place of birth for the foreign-born population - Other Eastern Europe (%)
Place of birth for the foreign-born population - China (%)
Place of birth for the foreign-born population - Hong Kong (%)
Place of birth for the foreign-born population - Taiwan (%)
Place of birth for the foreign-born population - Japan (%)
Place of birth for the foreign-born population - Korea (%)
Place of birth for the foreign-born population - Other Eastern Asia (%)
Place of birth for the foreign-born population - Afghanistan (%)
Place of birth for the foreign-born population - Bangladesh (%)
Place of birth for the foreign-born population - India (%)
Place of birth for the foreign-born population - Iran (%)
Place of birth for the foreign-born population - Kazakhstan (%)
Place of birth for the foreign-born population - Nepal (%)
Place of birth for the foreign-born population - Pakistan (%)
Place of birth for the foreign-born population - Sri Lanka (%)
Place of birth for the foreign-born population - Uzbekistan (%)
Place of birth for the foreign-born population - Other South Central Asia (%)
Place of birth for the foreign-born population - Burma (%)
Place of birth for the foreign-born population - Cambodia (%)
Place of birth for the foreign-born population - Indonesia (%)
Place of birth for the foreign-born population - Laos (%)
Place of birth for the foreign-born population - Malaysia (%)
Place of birth for the foreign-born population - Philippines (%)
Place of birth for the foreign-born population - Singapore (%)
Place of birth for the foreign-born population - Thailand (%)
Place of birth for the foreign-born population - Vietnam (%)
Place of birth for the foreign-born population - Other South Eastern Asia (%)
Place of birth for the foreign-born population - Armenia (%)
Place of birth for the foreign-born population - Iraq (%)
Place of birth for the foreign-born population - Israel (%)
Place of birth for the foreign-born population - Jordan (%)
Place of birth for the foreign-born population - Kuwait (%)
Place of birth for the foreign-born population - Lebanon (%)
Place of birth for the foreign-born population - Saudi Arabia (%)
Place of birth for the foreign-born population - Syria (%)
Place of birth for the foreign-born population - Turkey (%)
Place of birth for the foreign-born population - Yemen (%)
Place of birth for the foreign-born population - Other Western Asia (%)
Place of birth for the foreign-born population - Eritrea (%)
Place of birth for the foreign-born population - Ethiopia (%)
Place of birth for the foreign-born population - Kenya (%)
Place of birth for the foreign-born population - Somalia (%)
Place of birth for the foreign-born population - Uganda (%)
Place of birth for the foreign-born population - Zimbabwe (%)
Place of birth for the foreign-born population - Other Eastern Africa (%)
Place of birth for the foreign-born population - Cameroon (%)
Place of birth for the foreign-born population - Congo (%)
Place of birth for the foreign-born population - Democratic Republic of Congo (Zaire) (%)
Place of birth for the foreign-born population - Other Middle Africa (%)
Place of birth for the foreign-born population - Egypt (%)
Place of birth for the foreign-born population - Morocco (%)
Place of birth for the foreign-born population - Sudan (%)
Place of birth for the foreign-born population - Other Northern Africa (%)
Place of birth for the foreign-born population - South Africa (%)
Place of birth for the foreign-born population - Other Southern Africa (%)
Place of birth for the foreign-born population - Cabo Verde (%)
Place of birth for the foreign-born population - Ghana (%)
Place of birth for the foreign-born population - Liberia (%)
Place of birth for the foreign-born population - Nigeria (%)
Place of birth for the foreign-born population - Senegal (%)
Place of birth for the foreign-born population - Sierra Leone (%)
Place of birth for the foreign-born population - Other Western Africa (%)
Place of birth for the foreign-born population - Australia (%)
Place of birth for the foreign-born population - New Zealand (%)
Place of birth for the foreign-born population - Fiji (%)
Place of birth for the foreign-born population - Micronesia (%)
Place of birth for the foreign-born population - Bahamas (%)
Place of birth for the foreign-born population - Barbados (%)
Place of birth for the foreign-born population - Cuba (%)
Place of birth for the foreign-born population - Dominica (%)
Place of birth for the foreign-born population - Dominican Republic (%)
Place of birth for the foreign-born population - Grenada (%)
Place of birth for the foreign-born population - Haiti (%)
Place of birth for the foreign-born population - Jamaica (%)
Place of birth for the foreign-born population - St. Vincent and the Grenadines (%)
Place of birth for the foreign-born population - Trinidad and Tobago (%)
Place of birth for the foreign-born population - West Indies (%)
Place of birth for the foreign-born population - Other Caribbean (%)
Place of birth for the foreign-born population - Belize (%)
Place of birth for the foreign-born population - Costa Rica (%)
Place of birth for the foreign-born population - El Salvador (%)
Place of birth for the foreign-born population - Guatemala (%)
Place of birth for the foreign-born population - Honduras (%)
Place of birth for the foreign-born population - Mexico (%)
Place of birth for the foreign-born population - Nicaragua (%)
Place of birth for the foreign-born population - Panama (%)
Place of birth for the foreign-born population - Other Central America (%)
Place of birth for the foreign-born population - Argentina (%)
Place of birth for the foreign-born population - Bolivia (%)
Place of birth for the foreign-born population - Brazil (%)
Place of birth for the foreign-born population - Chile (%)
Place of birth for the foreign-born population - Colombia (%)
Place of birth for the foreign-born population - Ecuador (%)
Place of birth for the foreign-born population - Guyana (%)
Place of birth for the foreign-born population - Peru (%)
Place of birth for the foreign-born population - Uruguay (%)
Place of birth for the foreign-born population - Venezuela (%)
Place of birth for the foreign-born population - Other South America (%)
Place of birth for the foreign-born population - Canada (%)
Place of birth for the foreign-born population - Other Northern America (%)
Place of birth for the foreign-born population - Other (%)
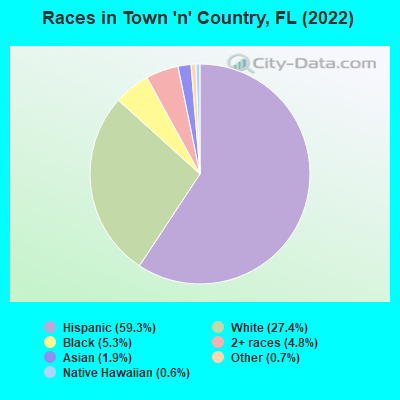
According to 2022 data, the most numerous races in Town 'n' Country, FL are White alone (23,947 residents), Hispanic (51,898 residents), and Black alone (4,664 residents). 44.9% of Town 'n' Country residents speak English at home. 37.2% of Town 'n' Country, FL residents are foreign-born (30.9% born in Latin America), which is 43.5% greater than the foreign-born rate of 21.0% across the entire state of Florida.
Race distribution in Town 'n' Country
2000 2022
42,405 58.5% White alone 21,010 29.0% Hispanic 5,225 7.2% Black alone 2,328 3.2% Asian alone 1,121 1.5% Two or more races 193 0.3% Other race alone 195 0.3% American Indian alone 46 0.06% Native Hawaiian and Other
51,898 59.3% Hispanic 23,947 27.4% White alone 4,664 5.3% Black alone 4,230 4.8% Two or more races 1,665 1.9% Asian alone 604 0.7% Other race alone 513 0.6% Native Hawaiian and Other
2000 2022
10,458,509 65.4% White alone 2,682,715 16.8% Hispanic 2,264,268 14.2% Black alone 261,693 1.6% Asian alone 236,954 1.5% Two or more races 42,358 0.3% American Indian alone 28,994 0.2% Other race alone 6,887 0.04% Native Hawaiian and Other
11,309,403 50.8% White alone 6,025,039 27.1% Hispanic 3,241,015 14.6% Black alone 861,630 3.9% Two or more races 623,692 2.8% Asian alone 152,054 0.7% Other race alone 22,504 0.1% American Indian alone 9,486 0.04% Native Hawaiian and Other
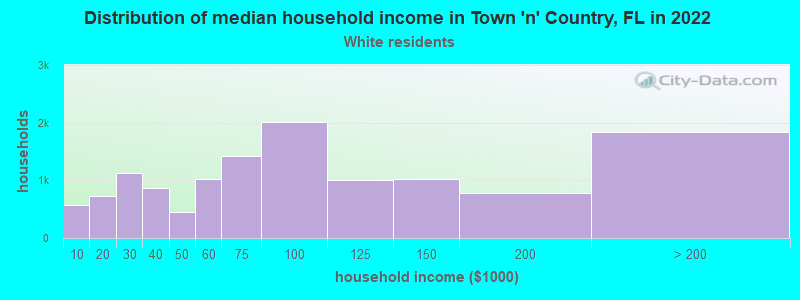
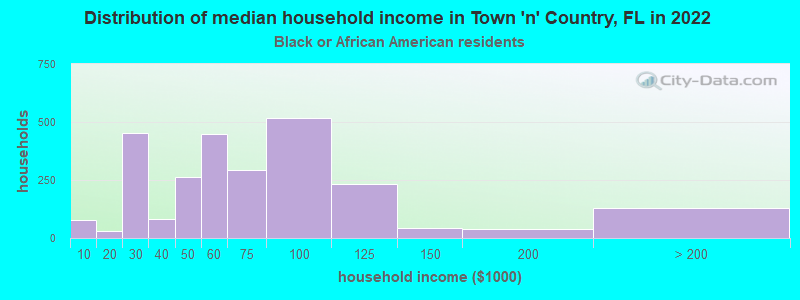
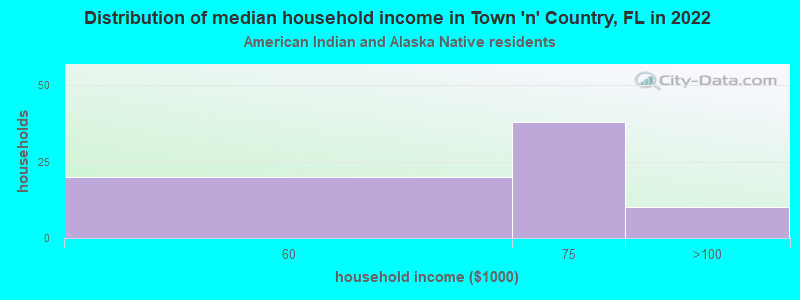
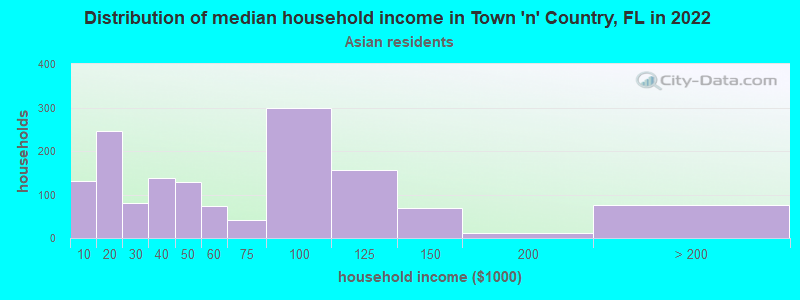
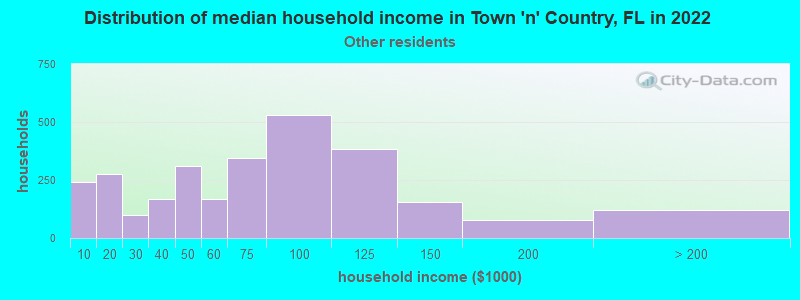
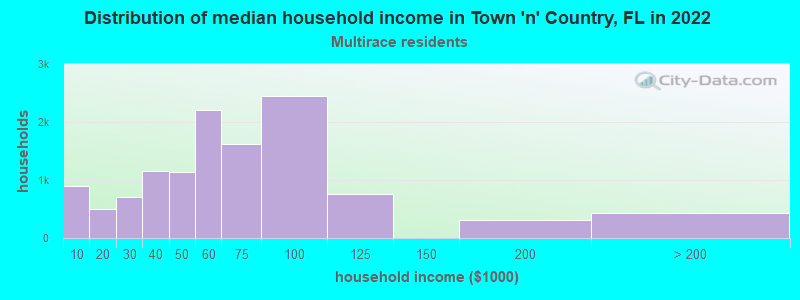
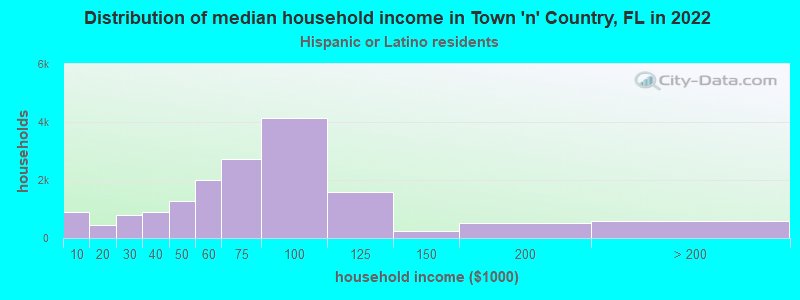
Income and house value in Town 'n' Country Median household income in 2022 $81,441 White non-Hispanic householders$79,398 Black householders$81,597 Asian householders$89,444 Some other race householders$57,346 Two or more races householders$65,591 Hispanic or Latino race householdersMedian 2022 house value $355,345 White Non-Hispanic householders$337,150 Black or African American householders$249,892 American Indian or Alaska Native householders $363,142 Asian householders$204,221 Native Hawaiian and other Pacific Islander householders$300,019 Some other race householders$315,986 Two or more races householders$304,104 Hispanic or Latino householders
Median age by race in Town 'n' Country
43.4 Median age for White residents45.0 42.1 31.0 Median age for Black or African American residents33.7 29.1 45.4 Median age for American Indian / Alaska Native residents-666,666,666.0 44.8 44.4 Median age for Asian residents46.1 44.4 -666,666,666.0 Median age for Native Hawaiian / Pacific Islander residents-666,666,666.0 -666,666,666.0 38.6 Median age for Other race residents38.3 39.2 34.2 Median age for Two or more races residents33.9 34.8 50.2 Median age for White alone residents50.6 47.9 35.8 Median age for Hispanic or Latino residents35.1 36.6
Owner/renter occupied households by race in Town 'n' Country
House owners and renters - White residents 9,839 76.6% Owner occupied3,007 23.4% Renter occupiedHouse owners and renters - Black or African American residents 798 30.8% Owner occupied1,793 69.2% Renter occupiedHouse owners and renters - American Indian / Alaska Native residents 19 22.7% Owner occupied65 77.3% Renter occupiedHouse owners and renters - Asian residents 480 72.7% Owner occupied180 27.3% Renter occupiedHouse owners and renters - Native Hawaiian / Pacific Islander residents 47 78.7% Owner occupied13 21.3% Renter occupiedHouse owners and renters - Other race residents 1,361 41.9% Owner occupied1,885 58.1% Renter occupiedHouse owners and renters - Two or more races residents 6,414 52.6% Owner occupied5,774 47.4% Renter occupiedHouse owners and renters - White alone residents 8,907 79.7% Owner occupied2,273 20.3% Renter occupiedHouse owners and renters - Hispanic or Latino residents 8,415 52.3% Owner occupied7,687 47.7% Renter occupied
Language usage in Town 'n' Country
English speakers - Total 44.9% of residents of Town 'n' Country speak English at home.
49.8% of residents speak Spanish at home 16,341 40.2% Speak English very well24,269 59.8% Speak English less than very well5.3% of residents speak other language at home 2,985 68.8% Speak English very well1,352 31.2% Speak English less than very well
English speakers - Born in the United States 78.9% of residents of Town 'n' Country speak English at home.
17.2% of residents speak Spanish at home 3,633 89.9% Speak English very well406 10.1% Speak English less than very well3.9% of residents speak other language at home 918 100.0% Speak English very well
English speakers - Native, born elsewhere 19.4% of residents of Town 'n' Country speak English at home.
75.7% of residents speak Spanish at home 3,235 61.7% Speak English very well2,005 38.3% Speak English less than very well4.9% of residents speak other language at home 242 71.8% Speak English very well95 28.2% Speak English less than very well
English speakers - Foreign-born 10.2% of residents of Town 'n' Country speak English at home.
81.9% of residents speak Spanish at home 6,126 22.4% Speak English very well21,170 77.6% Speak English less than very well7.9% of residents speak other language at home 1,391 52.5% Speak English very well1,257 47.5% Speak English less than very well
White (Caucasian) - Speak only English Native:
89.6% (21,842)Foreign-born:
18.1% (811)
White (Caucasian) - Speak another language Native:
10.4% (2,546)Foreign-born:
81.9% (3,677)
Black or African American - Speak only English Native:
82.6% (3,722)Foreign-born:
32.1% (445)
Black or African American - Speak another language Native:
16.9% (763)Foreign-born:
68.1% (944)
American Indian / Alaska Native - Speak another language Native:
81.9% (100)Foreign-born:
100.0% (25)
Asian - Speak only English Native:
34.4% (243)Foreign-born:
7.9% (222)
Asian - Speak another language Native:
68.6% (483)Foreign-born:
91.9% (2,582)
Other race - Speak only English Native:
19.5% (1,154)Foreign-born:
18.0% (797)
Other race - Speak another language Native:
80.5% (4,767)Foreign-born:
82.0% (3,627)
Two or more races - Speak only English Native:
51.0% (6,174)Foreign-born:
6.4% (1,443)
Two or more races - Speak another language Native:
49.0% (5,933)Foreign-born:
93.6% (21,003)
White alone - Speak only English Native:
96.1% (20,175)Foreign-born:
36.2% (811)
White alone - Speak another language Native:
3.9% (820)Foreign-born:
63.8% (1,430)
Hispanic or Latino - Speak only English Native:
35.3% (6,980)Foreign-born:
7.1% (2,019)
Hispanic or Latino - Speak another language Native:
64.7% (12,768)Foreign-born:
92.9% (26,264)
Foreign-born residents in Town 'n' Country 34,274 residents are foreign born (30.9% Latin America ).
This city:
37.2%Florida:
21.1%
Marital status for residents in Town 'n' Country Marital status - White (Caucasian) population 15 years and over
Males 36.4% Never married39.7% Now married0.9% Separated1.1% Widowed21.8% DivorcedFemales 24.4% Never married43.4% Now married1.0% Separated9.0% Widowed22.1% DivorcedWomen who gave birth in the past 12 months Now married:
66.3% (136)Unmarried:
33.7% (69)
Women who did not give birth in the past 12 months Now married:
41.7% (2,993)Unmarried:
58.3% (4,182)
Marital status - Black or African American population 15 years and over
Males 45.0% Never married35.9% Now married1.8% Separated1.1% Widowed16.3% DivorcedFemales 50.4% Never married27.5% Now married3.2% Separated9.2% Widowed9.8% DivorcedWomen who gave birth in the past 12 months Now married:
63.0% (70)Unmarried:
37.0% (41)
Women who did not give birth in the past 12 months Now married:
24.3% (368)Unmarried:
75.7% (1,145)
Marital status - American Indian / Alaska Native population 15 years and over
Males 21.4% Never married78.6% Now married0.0% Separated0.0% Widowed0.0% DivorcedFemales 14.7% Never married20.6% Now married26.5% Separated13.2% Widowed25.0% DivorcedWomen who did not give birth in the past 12 months Now married:
54.2% (64)Unmarried:
45.8% (54)
Marital status - Asian population 15 years and over
Males 40.8% Never married50.3% Now married1.7% Separated2.5% Widowed4.6% DivorcedFemales 23.4% Never married57.5% Now married1.9% Separated7.9% Widowed9.3% DivorcedWomen who gave birth in the past 12 months Now married:
100.0% (147)Unmarried:
0.0% (0)
Women who did not give birth in the past 12 months Now married:
57.2% (524)Unmarried:
42.8% (393)
Marital status - Other race population 15 years and over
Males 43.3% Never married40.2% Now married0.0% Separated0.0% Widowed16.6% DivorcedFemales 49.5% Never married26.2% Now married0.0% Separated1.2% Widowed23.1% DivorcedWomen who gave birth in the past 12 months Now married:
57.1% (16)Unmarried:
42.9% (12)
Women who did not give birth in the past 12 months Now married:
33.0% (998)Unmarried:
67.0% (2,022)
Marital status - Two or more races population 15 years and over
Males 37.4% Never married54.7% Now married0.9% Separated0.6% Widowed6.5% DivorcedFemales 33.2% Never married48.1% Now married2.8% Separated3.4% Widowed12.5% DivorcedWomen who gave birth in the past 12 months Now married:
53.6% (500)Unmarried:
46.4% (433)
Women who did not give birth in the past 12 months Now married:
43.5% (3,929)Unmarried:
56.5% (5,111)
Marital status - White alone, not Hispanic / Latino population 15 years and over
Males 33.5% Never married42.8% Now married0.3% Separated0.0% Widowed23.5% DivorcedFemales 19.2% Never married46.7% Now married1.2% Separated9.7% Widowed23.2% DivorcedWomen who gave birth in the past 12 months Now married:
90.7% (295)Unmarried:
9.3% (30)
Women who did not give birth in the past 12 months Now married:
42.7% (2,481)Unmarried:
57.3% (3,323)
Marital status - Hispanic or Latino population 15 years and over
Males 41.2% Never married48.9% Now married0.9% Separated0.6% Widowed8.4% DivorcedFemales 38.0% Never married39.8% Now married1.9% Separated3.8% Widowed16.5% DivorcedWomen who gave birth in the past 12 months Now married:
52.7% (560)Unmarried:
47.3% (502)
Women who did not give birth in the past 12 months Now married:
33.9% (4,585)Unmarried:
66.1% (8,946)
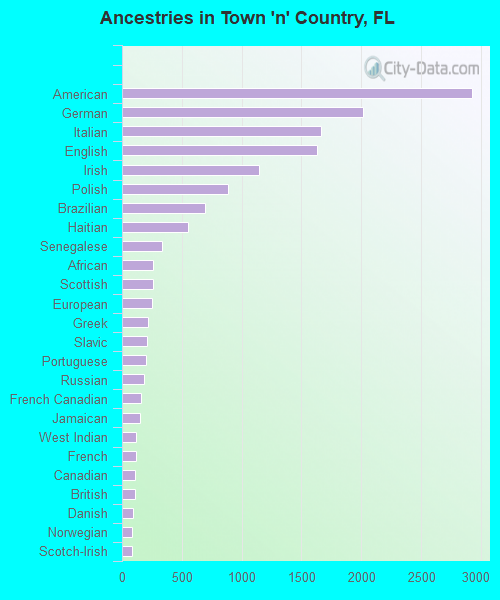
Ancestries in Town 'n' Country
2,921 5.3% American2,017 3.7% German1,661 3.0% Italian1,626 3.0% English1,143 2.1% Irish883 1.6% Polish693 1.3% Brazilian553 1.0% Haitian333 0.6% Senegalese263 0.5% African255 0.5% Scottish247 0.4% European215 0.4% Greek213 0.4% Slavic199 0.4% Portuguese188 0.3% Russian162 0.3% French Canadian152 0.3% Jamaican120 0.2% West Indian113 0.2% French112 0.2% Canadian112 0.2% British89 0.2% Danish87 0.2% Norwegian80 0.1% Scotch-Irish69 0.1% Hungarian67 0.1% Ukrainian66 0.1% Palestinian58 0.1% Croatian55 0.10% Slovak50 0.09% U.S. Virgin Islander46 0.08% Cypriot36 0.07% Estonian35 0.06% Dutch35 0.06% Romanian31 0.06% Northern European27 0.05% Arab25 0.05% Lithuanian24 0.04% Egyptian24 0.04% Pennsylvania German24 0.04% Albanian16 0.03% Lebanese15 0.03% Belgian15 0.03% Dutch West Indian12 0.02% Eastern European11 0.02% Austrian11 0.02% Bulgarian10 0.02% Guyanese9 0.02% Belizean8 0.01% Basque7 0.01% Welsh6 0.01% Swedish
Geographical mobility in Town 'n' Country Same house 1 year ago 27,264 92.1% White (Caucasian)5,401 85.3% Black or African American166 100.0% American Indian / Alaska Native2,674 70.7% Asian50 100.0% Native Hawaiian / Pacific Islander8,978 93.6% Other race31,645 84.6% Two or more races21,559 91.1% White alone, not Hispanic / Latino45,570 89.2% Hispanic or LatinoMoved within same county 911 3.1% White / Caucasian497 7.8% Black or African American4 2.1% American Indian / Alaska Native191 5.0% Asian430 4.5% Other race4,040 10.8% Two or more races836 3.5% White alone, not Hispanic / Latino3,136 6.1% Hispanic or LatinoMoved within same state 982 3.3% White / Caucasian251 4.0% Black or African American139 3.7% Asian150 1.6% Other race711 1.9% Two or more races982 4.1% White alone, not Hispanic / Latino932 1.8% Hispanic or LatinoMoved from different state 75 0.3% White / Caucasian134 2.1% Black or African American206 5.4% Asian75 0.3% White alone, not Hispanic / LatinoMoved from abroad 382 1.3% White32 0.5% Black or African American517 13.7% Asian126 1.3% Other race1,010 2.7% Two or more races226 1.0% White alone, not Hispanic / Latino1,443 2.8% Hispanic or Latino
Children Nativity (place of birth) in Town 'n' Country
Children under 6 years - Living with two parents Both parents native 1,943 100.0% NativeBoth parents foreign-born 1,019 80.1% Native253 19.9% Foreign-bornOne native, one foreign-born parent 305 100.0% NativeChildren under 6 years - Living with one parent Native parent 1,342 100.0% NativeForeign-born parent 1,501 100.0% NativeChildren 6 to 17 years - Living with two parents Both parents native 3,416 100.0% NativeBoth parents foreign-born 1,296 40.0% Native1,945 60.0% Foreign-bornOne native, one foreign-born parent 664 100.0% NativeChildren 6 to 17 years - Living with one parent Native parent 511 54.0% Native435 46.0% Foreign-bornForeign-born parent 1,088 74.5% Native372 25.5% Foreign-born
Place of birth for residents in Town 'n' Country 29,291 Americas29,141 Latin America19,550 Caribbean7,602 South America3,175 Asia1,988 Central America1,602 South Central Asia1,581 Europe1,244 South Eastern Asia644 Eastern Europe369 Northern Europe285 Western Europe282 Southern Europe213 Africa167 Western Asia160 Eastern Asia149 Northern America125 China89 Western Africa76 Eastern Africa47 Northern Africa12 Oceania17,389 Cuba2,916 Colombia2,723 Venezuela1,445 India1,400 Dominican Republic933 Brazil672 Vietnam663 Honduras620 Mexico451 Haiti444 Poland410 Ecuador382 Philippines242 El Salvador230 Peru195 England193 Guatemala180 Spain177 Germany175 Uruguay167 Jamaica149 Canada127 Panama125 Saudi Arabia104 Thailand103 China103 Argentina97 Guyana90 United Kingdom90 Costa Rica89 Senegal82 Trinidad and Tobago73 France65 Kazakhstan63 Ethiopia60 Pakistan58 Ireland58 Dominica49 Malaysia49 Russia42 Greece42 Portugal35 Burma (Myanmar)35 Egypt34 Korea32 Belize28 Hungary24 Scotland22 Taiwan20 Nepal18 Romania17 Austria17 Nicaragua17 Italy15 Belgium13 Lebanon11 Bangladesh11 Bolivia10 Tanzania10 Bulgaria3 Uganda
Grandparents responsible for own grandchildren in Town 'n' Country
Grandparents (30 to 59 years) White / Caucasian 60 18.1% Responsible for grandchildren270 81.9% Not responsible for grandchildrenBlack or African American 20 100.0% Responsible for grandchildrenAsian 18 100.0% Responsible for grandchildrenOther race 4 5.6% Responsible for grandchildren70 94.4% Not responsible for grandchildrenTwo or more races 154 53.7% Responsible for grandchildren133 46.3% Not responsible for grandchildrenWhite alone, not Hispanic / Latino 50 40.9% Responsible for grandchildren72 59.1% Not responsible for grandchildrenHispanic or Latino 124 29.5% Responsible for grandchildren297 70.5% Not responsible for grandchildrenGrandparents (60 years and over) White / Caucasian 296 37.6% Responsible for grandchildren493 62.4% Not responsible for grandchildrenBlack or African American 15 15.5% Responsible for grandchildren83 84.5% Not responsible for grandchildrenAsian 16 100.0% Not responsible for grandchildrenOther race 143 49.8% Responsible for grandchildren144 50.2% Not responsible for grandchildrenTwo or more races 59 5.9% Responsible for grandchildren941 94.1% Not responsible for grandchildrenWhite alone, not Hispanic / Latino 279 62.4% Responsible for grandchildren168 37.6% Not responsible for grandchildrenHispanic or Latino 146 10.4% Responsible for grandchildren1,257 89.6% Not responsible for grandchildren