Races in Tooele, Utah (UT) Detailed Stats
Data:
Races - White alone (%)
Races - White alone (% change since 2000)
Races - Black alone (%)
Races - Black alone (% change since 2000)
Races - American Indian alone (%)
Races - American Indian alone (% change since 2000)
Races - Asian alone (%)
Races - Asian alone (% change since 2000)
Races - Hispanic (%)
Races - Hispanic (% change since 2000)
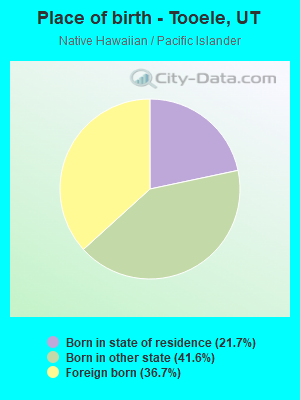
Races - Native Hawaiian and Other Pacific Islander alone (%)
Races - Native Hawaiian and Other Pacific Islander alone (% change since 2000)
Races - Two or more races(%)
Races - Two or more races(% change since 2000)
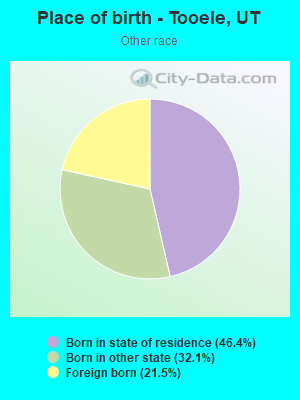
Races - Other race alone (%)
Races - Other race alone (% change since 2000)
Racial diversity
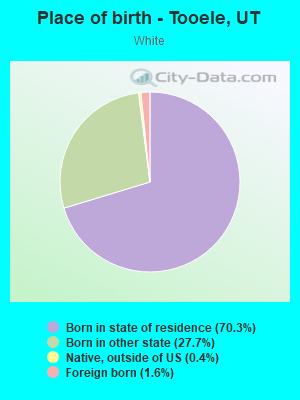
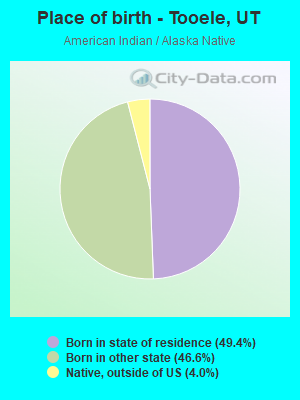
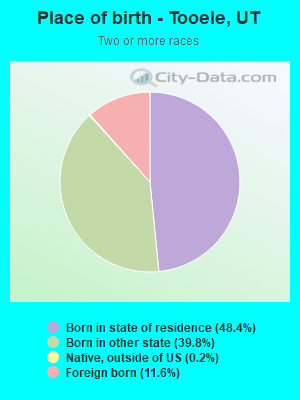
Place of birth - Born in state of residence (%)
Place of birth - Born in state of residence (%) - White
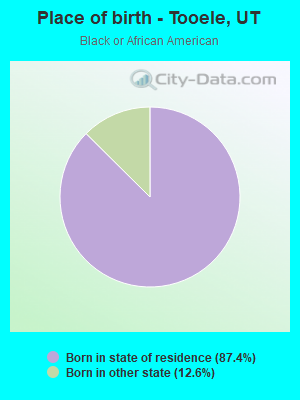
Place of birth - Born in state of residence (%) - Black or African American
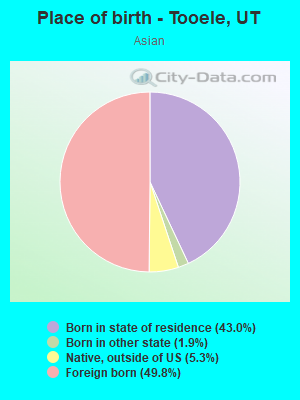
Place of birth - Born in state of residence (%) - Asian
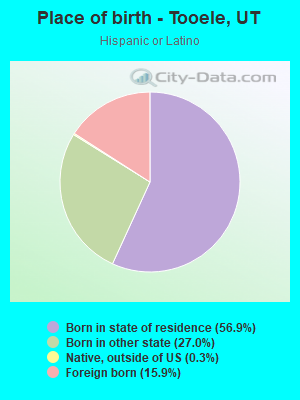
Place of birth - Born in state of residence (%) - Hispanic or Latino
Place of birth - Born in state of residence (%) - American Indian and Alaska Native
Place of birth - Born in state of residence (%) - Multirace
Place of birth - Born in state of residence (%) - Other Race
Place of birth - Born in other state (%)
Place of birth - Born in other state (%) - White
Place of birth - Born in other state (%) - Black or African American
Place of birth - Born in other state (%) - Asian
Place of birth - Born in other state (%) - Hispanic or Latino
Place of birth - Born in other state (%) - American Indian and Alaska Native
Place of birth - Born in other state (%) - Multirace
Place of birth - Born in other state (%) - Other Race
Place of birth - Native, outside of US (%)
Place of birth - Native, outside of US (%) - White
Place of birth - Native, outside of US (%) - Black or African American
Place of birth - Native, outside of US (%) - Asian
Place of birth - Native, outside of US (%) - Hispanic or Latino
Place of birth - Native, outside of US (%) - American Indian and Alaska Native
Place of birth - Native, outside of US (%) - Multirace
Place of birth - Native, outside of US (%) - Other Race
Place of birth - Foreign born (%)
Place of birth - Foreign born (%) - White
Place of birth - Foreign born (%) - Black or African American
Place of birth - Foreign born (%) - Asian
Place of birth - Foreign born (%) - Hispanic or Latino
Place of birth - Foreign born (%) - American Indian and Alaska Native
Place of birth - Foreign born (%) - Multirace
Place of birth - Foreign born (%) - Other Race
Residents speaking English at home (%)
Residents speaking English at home - Born in the United States (%)
Residents speaking English at home - Native, born elsewhere (%)
Residents speaking English at home - Foreign born (%)
Residents speaking Spanish at home (%)
Residents speaking Spanish at home - Born in the United States (%)
Residents speaking Spanish at home - Native, born elsewhere (%)
Residents speaking Spanish at home - Foreign born (%)
Residents speaking other language at home (%)
Residents speaking other language at home - Born in the United States (%)
Residents speaking other language at home - Native, born elsewhere (%)
Residents speaking other language at home - Foreign born (%)
Marital status - Never married (%)
Marital status - Now married (%)
Marital status - Separated (%)
Marital status - Widowed (%)
Marital status - Divorced (%)
Ancestries Reported - Arab (%)
Ancestries Reported - Czech (%)
Ancestries Reported - Danish (%)
Ancestries Reported - Dutch (%)
Ancestries Reported - English (%)
Ancestries Reported - French (%)
Ancestries Reported - French Canadian (%)
Ancestries Reported - German (%)
Ancestries Reported - Greek (%)
Ancestries Reported - Hungarian (%)
Ancestries Reported - Irish (%)
Ancestries Reported - Italian (%)
Ancestries Reported - Lithuanian (%)
Ancestries Reported - Norwegian (%)
Ancestries Reported - Polish (%)
Ancestries Reported - Portuguese (%)
Ancestries Reported - Russian (%)
Ancestries Reported - Scotch-Irish (%)
Ancestries Reported - Scottish (%)
Ancestries Reported - Slovak (%)
Ancestries Reported - Subsaharan African (%)
Ancestries Reported - Swedish (%)
Ancestries Reported - Swiss (%)
Ancestries Reported - Ukrainian (%)
Ancestries Reported - United States (%)
Ancestries Reported - Welsh (%)
Ancestries Reported - West Indian (%)
Ancestries Reported - Other (%)
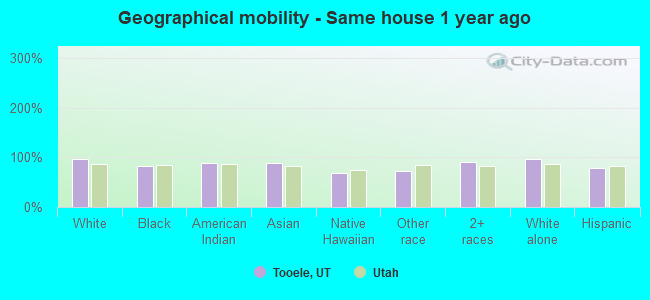
Geographical mobility - Same house 1 year ago (%)
Geographical mobility - Same house 1 year ago (%) - White
Geographical mobility - Same house 1 year ago (%) - Black or African American
Geographical mobility - Same house 1 year ago (%) - Asian
Geographical mobility - Same house 1 year ago (%) - Hispanic or Latino
Geographical mobility - Same house 1 year ago (%) - American Indian and Alaska Native
Geographical mobility - Same house 1 year ago (%) - Multirace
Geographical mobility - Same house 1 year ago (%) - Other Race
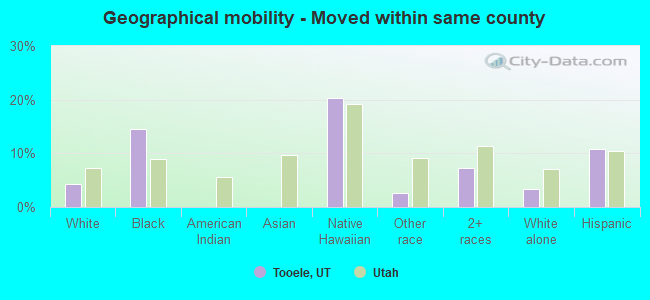
Geographical mobility - Moved within same county (%)
Geographical mobility - Moved within same county (%) - White
Geographical mobility - Moved within same county (%) - Black or African American
Geographical mobility - Moved within same county (%) - Asian
Geographical mobility - Moved within same county (%) - Hispanic or Latino
Geographical mobility - Moved within same county (%) - American Indian and Alaska Native
Geographical mobility - Moved within same county (%) - Multirace
Geographical mobility - Moved within same county (%) - Other Race
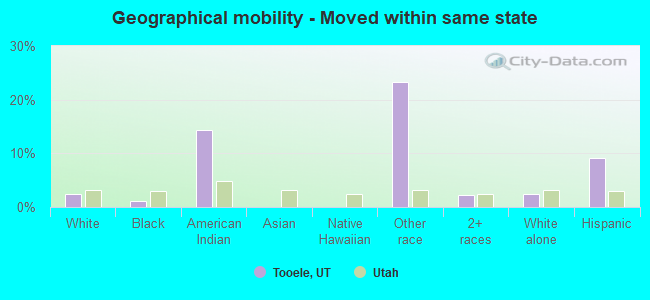
Geographical mobility - Moved from different county within same state (%)
Geographical mobility - Moved from different county within same state (%) - White
Geographical mobility - Moved from different county within same state (%) - Black or African American
Geographical mobility - Moved from different county within same state (%) - Asian
Geographical mobility - Moved from different county within same state (%) - Hispanic or Latino
Geographical mobility - Moved from different county within same state (%) - American Indian and Alaska Native
Geographical mobility - Moved from different county within same state (%) - Multirace
Geographical mobility - Moved from different county within same state (%) - Other Race
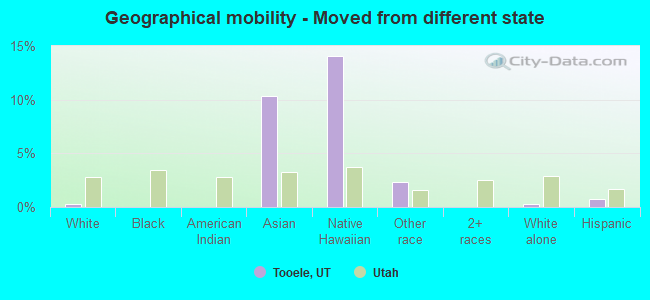
Geographical mobility - Moved from different state (%)
Geographical mobility - Moved from different state (%) - White
Geographical mobility - Moved from different state (%) - Black or African American
Geographical mobility - Moved from different state (%) - Asian
Geographical mobility - Moved from different state (%) - Hispanic or Latino
Geographical mobility - Moved from different state (%) - American Indian and Alaska Native
Geographical mobility - Moved from different state (%) - Multirace
Geographical mobility - Moved from different state (%) - Other Race
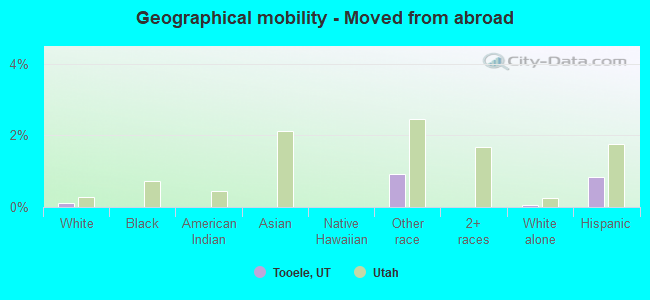
Geographical mobility - Moved from abroad (%)
Geographical mobility - Moved from abroad (%) - White
Geographical mobility - Moved from abroad (%) - Black or African American
Geographical mobility - Moved from abroad (%) - Asian
Geographical mobility - Moved from abroad (%) - Hispanic or Latino
Geographical mobility - Moved from abroad (%) - American Indian and Alaska Native
Geographical mobility - Moved from abroad (%) - Multirace
Geographical mobility - Moved from abroad (%) - Other Race
Place of birth for the foreign-born population - Ireland (%)
Place of birth for the foreign-born population - Denmark (%)
Place of birth for the foreign-born population - Norway (%)
Place of birth for the foreign-born population - Sweden (%)
Place of birth for the foreign-born population - United Kingdom (%)
Place of birth for the foreign-born population - England (%)
Place of birth for the foreign-born population - Scotland (%)
Place of birth for the foreign-born population - Other Northern Europe (%)
Place of birth for the foreign-born population - Austria (%)
Place of birth for the foreign-born population - Belgium (%)
Place of birth for the foreign-born population - France (%)
Place of birth for the foreign-born population - Germany (%)
Place of birth for the foreign-born population - Netherlands (%)
Place of birth for the foreign-born population - Switzerland (%)
Place of birth for the foreign-born population - Other Western Europe (%)
Place of birth for the foreign-born population - Greece (%)
Place of birth for the foreign-born population - Italy (%)
Place of birth for the foreign-born population - Portugal (%)
Place of birth for the foreign-born population - Spain (%)
Place of birth for the foreign-born population - Other Southern Europe (%)
Place of birth for the foreign-born population - Albania (%)
Place of birth for the foreign-born population - Belarus (%)
Place of birth for the foreign-born population - Bosnia and Herzegovina (%)
Place of birth for the foreign-born population - Bulgaria (%)
Place of birth for the foreign-born population - Croatia (%)
Place of birth for the foreign-born population - Czechoslovakia (%)
Place of birth for the foreign-born population - Hungary (%)
Place of birth for the foreign-born population - Latvia (%)
Place of birth for the foreign-born population - Lithuania (%)
Place of birth for the foreign-born population - North Macedonia (Macedonia) (%)
Place of birth for the foreign-born population - Moldova (%)
Place of birth for the foreign-born population - Poland (%)
Place of birth for the foreign-born population - Romania (%)
Place of birth for the foreign-born population - Russia (%)
Place of birth for the foreign-born population - Serbia (%)
Place of birth for the foreign-born population - Ukraine (%)
Place of birth for the foreign-born population - Other Eastern Europe (%)
Place of birth for the foreign-born population - China (%)
Place of birth for the foreign-born population - Hong Kong (%)
Place of birth for the foreign-born population - Taiwan (%)
Place of birth for the foreign-born population - Japan (%)
Place of birth for the foreign-born population - Korea (%)
Place of birth for the foreign-born population - Other Eastern Asia (%)
Place of birth for the foreign-born population - Afghanistan (%)
Place of birth for the foreign-born population - Bangladesh (%)
Place of birth for the foreign-born population - India (%)
Place of birth for the foreign-born population - Iran (%)
Place of birth for the foreign-born population - Kazakhstan (%)
Place of birth for the foreign-born population - Nepal (%)
Place of birth for the foreign-born population - Pakistan (%)
Place of birth for the foreign-born population - Sri Lanka (%)
Place of birth for the foreign-born population - Uzbekistan (%)
Place of birth for the foreign-born population - Other South Central Asia (%)
Place of birth for the foreign-born population - Burma (%)
Place of birth for the foreign-born population - Cambodia (%)
Place of birth for the foreign-born population - Indonesia (%)
Place of birth for the foreign-born population - Laos (%)
Place of birth for the foreign-born population - Malaysia (%)
Place of birth for the foreign-born population - Philippines (%)
Place of birth for the foreign-born population - Singapore (%)
Place of birth for the foreign-born population - Thailand (%)
Place of birth for the foreign-born population - Vietnam (%)
Place of birth for the foreign-born population - Other South Eastern Asia (%)
Place of birth for the foreign-born population - Armenia (%)
Place of birth for the foreign-born population - Iraq (%)
Place of birth for the foreign-born population - Israel (%)
Place of birth for the foreign-born population - Jordan (%)
Place of birth for the foreign-born population - Kuwait (%)
Place of birth for the foreign-born population - Lebanon (%)
Place of birth for the foreign-born population - Saudi Arabia (%)
Place of birth for the foreign-born population - Syria (%)
Place of birth for the foreign-born population - Turkey (%)
Place of birth for the foreign-born population - Yemen (%)
Place of birth for the foreign-born population - Other Western Asia (%)
Place of birth for the foreign-born population - Eritrea (%)
Place of birth for the foreign-born population - Ethiopia (%)
Place of birth for the foreign-born population - Kenya (%)
Place of birth for the foreign-born population - Somalia (%)
Place of birth for the foreign-born population - Uganda (%)
Place of birth for the foreign-born population - Zimbabwe (%)
Place of birth for the foreign-born population - Other Eastern Africa (%)
Place of birth for the foreign-born population - Cameroon (%)
Place of birth for the foreign-born population - Congo (%)
Place of birth for the foreign-born population - Democratic Republic of Congo (Zaire) (%)
Place of birth for the foreign-born population - Other Middle Africa (%)
Place of birth for the foreign-born population - Egypt (%)
Place of birth for the foreign-born population - Morocco (%)
Place of birth for the foreign-born population - Sudan (%)
Place of birth for the foreign-born population - Other Northern Africa (%)
Place of birth for the foreign-born population - South Africa (%)
Place of birth for the foreign-born population - Other Southern Africa (%)
Place of birth for the foreign-born population - Cabo Verde (%)
Place of birth for the foreign-born population - Ghana (%)
Place of birth for the foreign-born population - Liberia (%)
Place of birth for the foreign-born population - Nigeria (%)
Place of birth for the foreign-born population - Senegal (%)
Place of birth for the foreign-born population - Sierra Leone (%)
Place of birth for the foreign-born population - Other Western Africa (%)
Place of birth for the foreign-born population - Australia (%)
Place of birth for the foreign-born population - New Zealand (%)
Place of birth for the foreign-born population - Fiji (%)
Place of birth for the foreign-born population - Micronesia (%)
Place of birth for the foreign-born population - Bahamas (%)
Place of birth for the foreign-born population - Barbados (%)
Place of birth for the foreign-born population - Cuba (%)
Place of birth for the foreign-born population - Dominica (%)
Place of birth for the foreign-born population - Dominican Republic (%)
Place of birth for the foreign-born population - Grenada (%)
Place of birth for the foreign-born population - Haiti (%)
Place of birth for the foreign-born population - Jamaica (%)
Place of birth for the foreign-born population - St. Vincent and the Grenadines (%)
Place of birth for the foreign-born population - Trinidad and Tobago (%)
Place of birth for the foreign-born population - West Indies (%)
Place of birth for the foreign-born population - Other Caribbean (%)
Place of birth for the foreign-born population - Belize (%)
Place of birth for the foreign-born population - Costa Rica (%)
Place of birth for the foreign-born population - El Salvador (%)
Place of birth for the foreign-born population - Guatemala (%)
Place of birth for the foreign-born population - Honduras (%)
Place of birth for the foreign-born population - Mexico (%)
Place of birth for the foreign-born population - Nicaragua (%)
Place of birth for the foreign-born population - Panama (%)
Place of birth for the foreign-born population - Other Central America (%)
Place of birth for the foreign-born population - Argentina (%)
Place of birth for the foreign-born population - Bolivia (%)
Place of birth for the foreign-born population - Brazil (%)
Place of birth for the foreign-born population - Chile (%)
Place of birth for the foreign-born population - Colombia (%)
Place of birth for the foreign-born population - Ecuador (%)
Place of birth for the foreign-born population - Guyana (%)
Place of birth for the foreign-born population - Peru (%)
Place of birth for the foreign-born population - Uruguay (%)
Place of birth for the foreign-born population - Venezuela (%)
Place of birth for the foreign-born population - Other South America (%)
Place of birth for the foreign-born population - Canada (%)
Place of birth for the foreign-born population - Other Northern America (%)
Place of birth for the foreign-born population - Other (%)
Latest news about races in Tooele, UT collected exclusively by city-data.com from local newspapers, TV, and radio stations
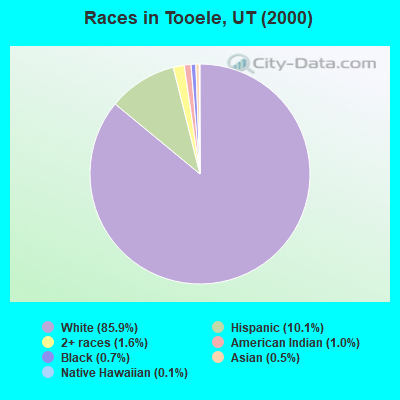
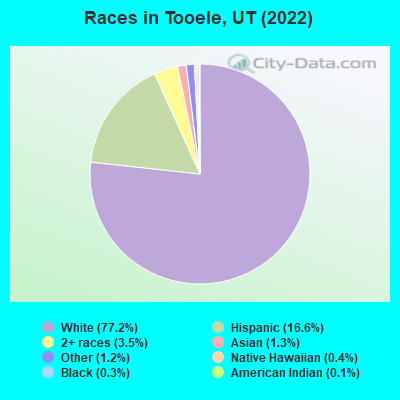
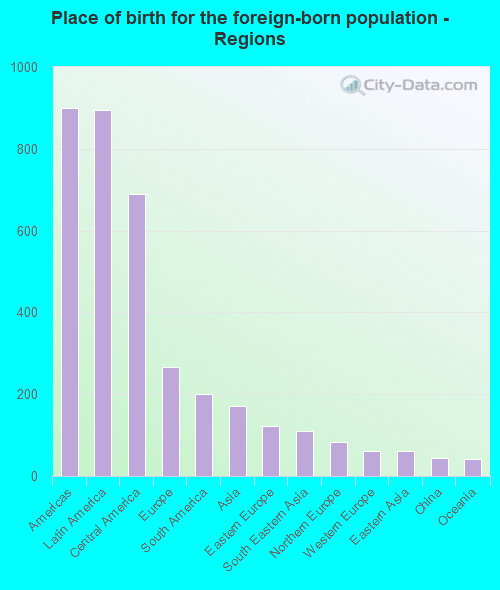
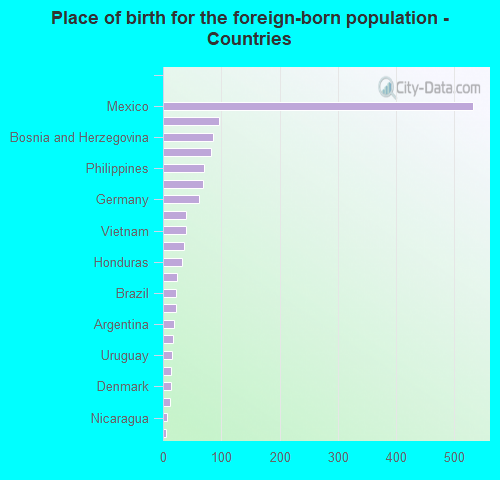
According to 2022 data, the most numerous races in Tooele, UT are White alone (30,287 residents), Hispanic (6,502 residents), and Two or more races (1,368 residents). 91.0% of Tooele residents speak English at home. 3.5% of Tooele, UT residents are foreign-born (2.3% born in Latin America, 0.7% born in Europe, 0.4% born in Asia), which is 127.3% less than the foreign-born rate of 8.0% across the entire state of Utah.
Race distribution in Tooele
2000 2022
1,904,265 85.3% White alone 201,559 9.0% Hispanic 36,483 1.6% Asian alone 31,308 1.4% Two or more races 26,663 1.2% American Indian alone 14,806 0.7% Native Hawaiian and Other 16,137 0.7% Black alone 1,948 0.09% Other race alone
2,557,466 75.6% White alone 512,086 15.1% Hispanic 119,308 3.5% Two or more races 82,388 2.4% Asian alone 36,978 1.1% Native Hawaiian and Other 34,873 1.0% Black alone 22,803 0.7% American Indian alone 14,898 0.4% Other race alone
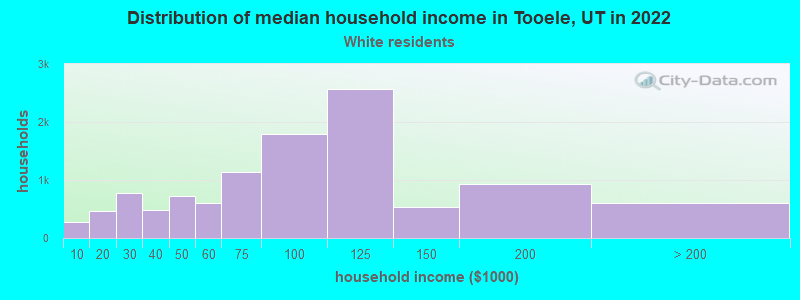
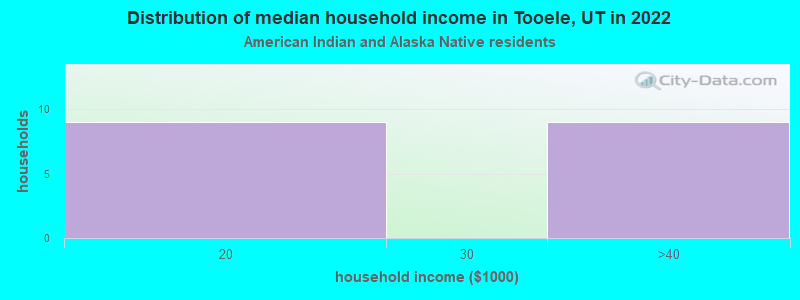
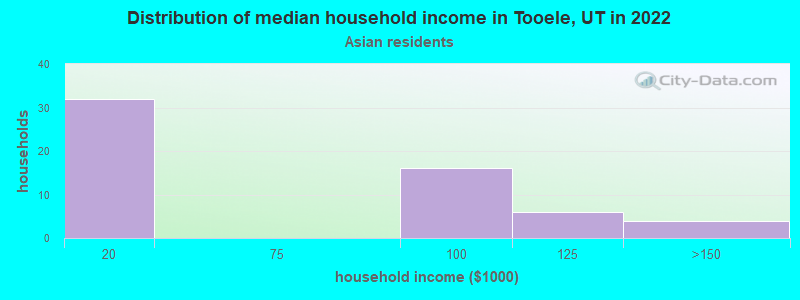
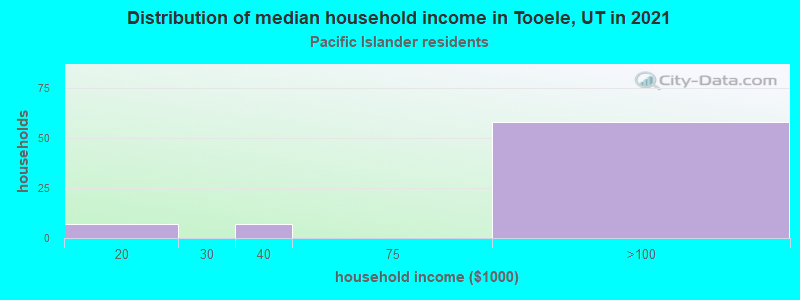
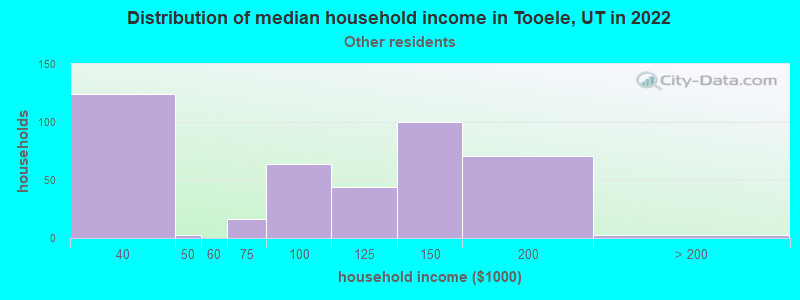
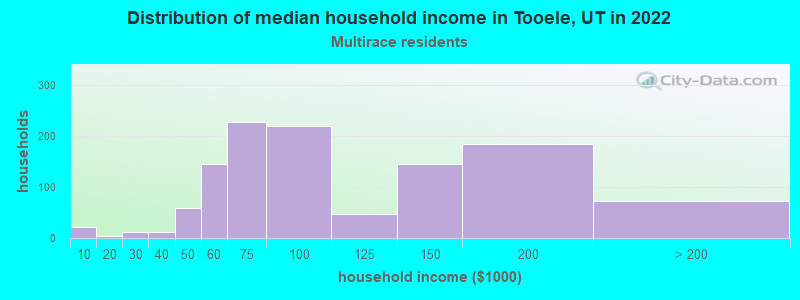
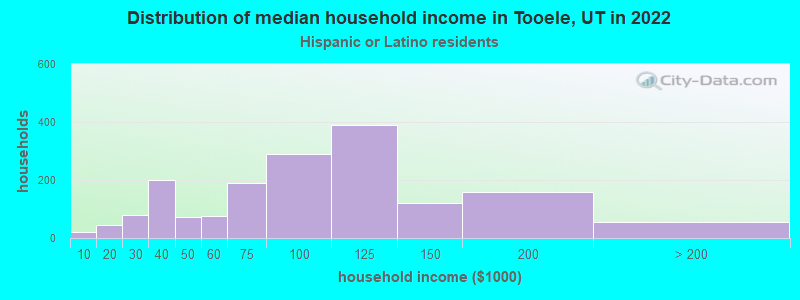
Income and house value in Tooele Median household income in 2022 $87,709 White non-Hispanic householders$90,806 Native Hawaiian and other Pacific Islander householders$91,752 Some other race householders$65,632 Two or more races householders$78,867 Hispanic or Latino race householdersMedian 2022 house value $395,805 White Non-Hispanic householders$448,666 Black or African American householders$385,690 American Indian or Alaska Native householders $520,127 Asian householders$376,227 Some other race householders$402,005 Two or more races householders$377,859 Hispanic or Latino householders
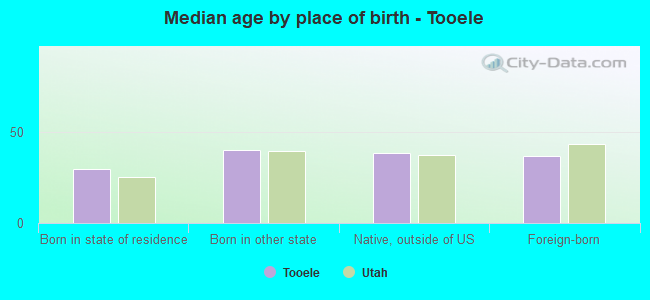
Median age by race in Tooele
32.6 Median age for White residents32.1 33.6 18.0 Median age for Black or African American residents25.1 17.6 73.4 Median age for American Indian / Alaska Native residents73.9 32.5 30.0 Median age for Asian residents3.2 26.1 48.1 Median age for Native Hawaiian / Pacific Islander residents36.4 51.1 29.2 Median age for Other race residents34.8 29.4 22.6 Median age for Two or more races residents21.3 32.6 34.5 Median age for White alone residents33.5 35.1 25.3 Median age for Hispanic or Latino residents19.7 35.4
Owner/renter occupied households by race in Tooele
House owners and renters - White residents 8,234 75.4% Owner occupied2,688 24.6% Renter occupiedHouse owners and renters - Black or African American residents 1 1.3% Owner occupied73 98.7% Renter occupiedHouse owners and renters - American Indian / Alaska Native residents 16 100.0% Renter occupiedHouse owners and renters - Asian residents 28 37.6% Owner occupied46 62.4% Renter occupiedHouse owners and renters - Native Hawaiian / Pacific Islander residents 47 87.2% Owner occupied7 12.8% Renter occupiedHouse owners and renters - Other race residents 328 82.7% Owner occupied68 17.3% Renter occupiedHouse owners and renters - Two or more races residents 931 82.1% Owner occupied203 17.9% Renter occupiedHouse owners and renters - White alone residents 7,912 75.9% Owner occupied2,518 24.1% Renter occupiedHouse owners and renters - Hispanic or Latino residents 1,106 70.4% Owner occupied466 29.6% Renter occupied
Language usage in Tooele
English speakers - Total 91.0% of residents of Tooele speak English at home.
5.8% of residents speak Spanish at home 1,527 71.3% Speak English very well616 28.7% Speak English less than very well2.7% of residents speak other language at home 850 84.2% Speak English very well160 15.8% Speak English less than very well
English speakers - Born in the United States 98.6% of residents of Tooele speak English at home.
5.8% of residents speak Spanish at home 607 97.9% Speak English very well13 2.1% Speak English less than very well1.1% of residents speak other language at home 115 93.5% Speak English very well8 6.5% Speak English less than very well
All residents speak only English at home
English speakers - Foreign-born 36.0% of residents of Tooele speak English at home.
47.0% of residents speak Spanish at home 437 52.0% Speak English very well403 48.0% Speak English less than very well17.2% of residents speak other language at home 293 95.1% Speak English very well15 4.9% Speak English less than very well
White (Caucasian) - Speak only English Native:
96.9% (28,761)Foreign-born:
82.6% (424)
White (Caucasian) - Speak another language Native:
3.1% (920)Foreign-born:
24.6% (126)
Asian - Speak only English Native:
57.5% (40)Foreign-born:
55.4% (98)
Asian - Speak another language Native:
42.3% (29)Foreign-born:
46.8% (83)
Native Hawaiian / Pacific Islander - Speak another language Native:
87.6% (73)Foreign-born:
100.0% (46)
Other race - Speak only English Native:
52.2% (635)Foreign-born:
2.9% (12)
Other race - Speak another language Native:
45.3% (550)Foreign-born:
95.1% (393)
Two or more races - Speak only English Native:
88.6% (3,100)Foreign-born:
26.1% (114)
Two or more races - Speak another language Native:
14.0% (491)Foreign-born:
74.8% (326)
White alone - Speak only English Native:
96.6% (27,124)Foreign-born:
30.3% (113)
White alone - Speak another language Native:
3.0% (856)Foreign-born:
44.7% (166)
Hispanic or Latino - Speak only English Native:
86.1% (4,343)Foreign-born:
15.9% (165)
Hispanic or Latino - Speak another language Native:
19.6% (987)Foreign-born:
83.7% (868)
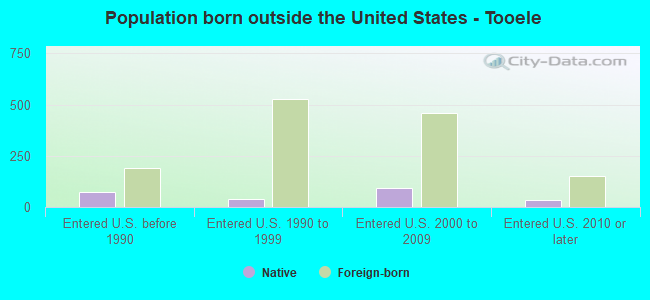
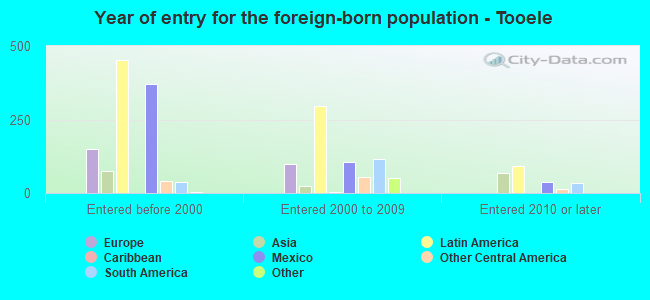
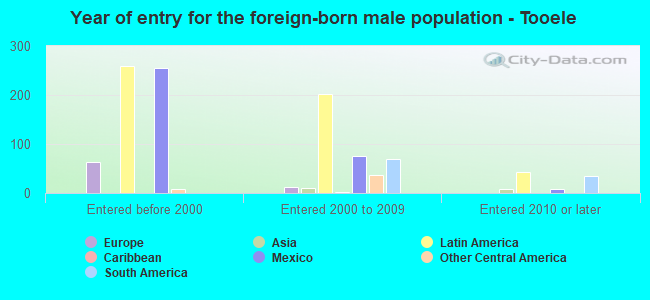
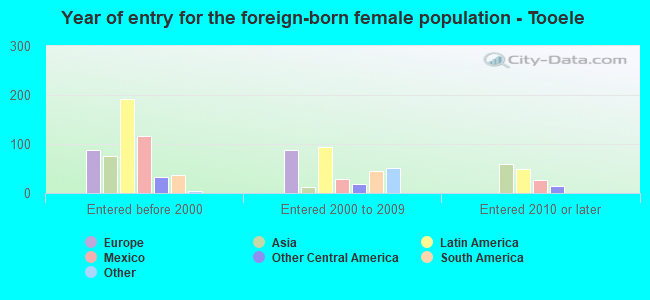
Foreign-born residents in Tooele 1,380 residents are foreign born (2.3% Latin America , 0.7% Europe , 0.4% Asia ).
Marital status for residents in Tooele Marital status - White (Caucasian) population 15 years and over
Males 34.2% Never married54.6% Now married0.6% Separated3.3% Widowed7.3% DivorcedFemales 25.6% Never married55.6% Now married1.4% Separated5.5% Widowed11.9% DivorcedWomen who gave birth in the past 12 months Now married:
75.3% (425)Unmarried:
24.7% (139)
Women who did not give birth in the past 12 months Now married:
56.8% (4,441)Unmarried:
43.2% (3,383)
Marital status - Black or African American population 15 years and over
Males 40.0% Never married36.7% Now married3.3% Separated0.0% Widowed20.0% DivorcedFemales 26.8% Never married53.6% Now married19.6% Separated0.0% Widowed0.0% DivorcedWomen who did not give birth in the past 12 months Now married:
73.2% (112)Unmarried:
26.8% (41)
Marital status - American Indian / Alaska Native population 15 years and over
Males 57.1% Never married26.8% Now married0.0% Separated0.0% Widowed16.1% DivorcedFemales 19.4% Never married51.6% Now married0.0% Separated29.0% Widowed0.0% DivorcedWomen who did not give birth in the past 12 months Now married:
0.0% (0)Unmarried:
100.0% (6)
Marital status - Asian population 15 years and over
Males 66.7% Never married12.3% Now married0.0% Separated0.0% Widowed21.0% DivorcedFemales 21.5% Never married78.5% Now married0.0% Separated0.0% Widowed0.0% DivorcedWomen who did not give birth in the past 12 months Now married:
59.2% (47)Unmarried:
40.8% (32)
Marital status - Native Hawaiian / Pacific Islander population 15 years and over
Males 0.0% Never married65.6% Now married0.0% Separated0.0% Widowed34.4% DivorcedFemales 0.0% Never married100.0% Now married0.0% Separated0.0% Widowed0.0% DivorcedWomen who did not give birth in the past 12 months Now married:
100.0% (19)Unmarried:
0.0% (0)
Marital status - Other race population 15 years and over
Males 31.4% Never married62.0% Now married2.9% Separated1.4% Widowed2.4% DivorcedFemales 26.4% Never married72.6% Now married0.0% Separated0.0% Widowed1.0% DivorcedWomen who gave birth in the past 12 months Now married:
0.0% (0)Unmarried:
100.0% (22)
Women who did not give birth in the past 12 months Now married:
75.5% (374)Unmarried:
24.5% (122)
Marital status - Two or more races population 15 years and over
Males 42.0% Never married47.1% Now married0.0% Separated2.8% Widowed8.1% DivorcedFemales 36.6% Never married48.3% Now married2.2% Separated1.7% Widowed11.3% DivorcedWomen who gave birth in the past 12 months Now married:
100.0% (11)Unmarried:
0.0% (0)
Women who did not give birth in the past 12 months Now married:
30.7% (220)Unmarried:
69.3% (498)
Marital status - White alone, not Hispanic / Latino population 15 years and over
Males 33.7% Never married55.0% Now married0.7% Separated3.4% Widowed7.3% DivorcedFemales 25.9% Never married55.7% Now married1.5% Separated5.4% Widowed11.5% DivorcedWomen who gave birth in the past 12 months Now married:
67.2% (287)Unmarried:
32.8% (140)
Women who did not give birth in the past 12 months Now married:
56.7% (4,108)Unmarried:
43.3% (3,140)
Marital status - Hispanic or Latino population 15 years and over
Males 41.5% Never married50.8% Now married1.0% Separated0.5% Widowed6.2% DivorcedFemales 27.8% Never married59.3% Now married0.5% Separated3.4% Widowed9.0% DivorcedWomen who gave birth in the past 12 months Now married:
100.0% (171)Unmarried:
0.0% (0)
Women who did not give birth in the past 12 months Now married:
54.8% (823)Unmarried:
45.2% (677)
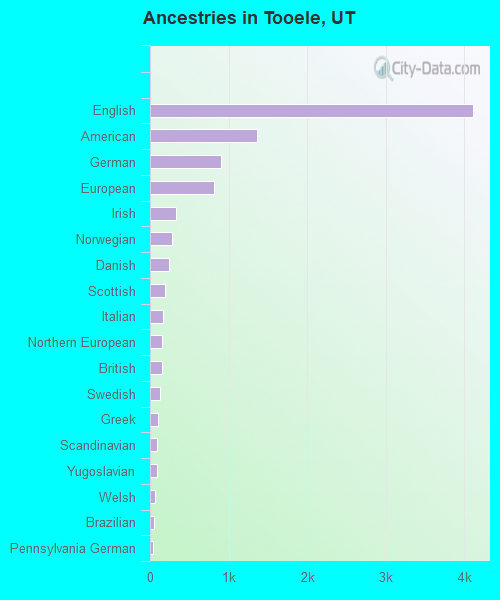
Ancestries in Tooele
4,110 26.8% English1,357 8.9% American902 5.9% German820 5.4% European326 2.1% Irish284 1.9% Norwegian236 1.5% Danish192 1.3% Scottish164 1.1% Italian153 1.0% Northern European150 1.0% British121 0.8% Swedish103 0.7% Greek95 0.6% Scandinavian93 0.6% Yugoslavian67 0.4% Welsh56 0.4% Brazilian38 0.2% Pennsylvania German36 0.2% Slovene34 0.2% Dutch32 0.2% Russian31 0.2% Somali29 0.2% French28 0.2% French Canadian28 0.2% Polish12 0.08% Portuguese10 0.07% Austrian9 0.06% Canadian8 0.05% Scotch-Irish3 0.02% Basque3 0.02% Eastern European
Geographical mobility in Tooele Same house 1 year ago 30,461 95.6% White (Caucasian)205 83.5% Black or African American83 89.0% American Indian / Alaska Native320 89.1% Asian89 69.2% Native Hawaiian / Pacific Islander1,407 72.9% Other race3,556 90.7% Two or more races28,874 96.3% White alone, not Hispanic / Latino4,475 79.3% Hispanic or LatinoMoved within same county 1,343 4.2% White / Caucasian35 14.5% Black or African American26 20.4% Native Hawaiian / Pacific Islander52 2.7% Other race285 7.3% Two or more races1,018 3.4% White alone, not Hispanic / Latino605 10.7% Hispanic or LatinoMoved within same state 782 2.5% White / Caucasian3 1.2% Black or African American13 14.4% American Indian / Alaska Native450 23.3% Other race84 2.2% Two or more races724 2.4% White alone, not Hispanic / Latino515 9.1% Hispanic or LatinoMoved from different state 86 0.3% White / Caucasian37 10.3% Asian18 14.1% Native Hawaiian / Pacific Islander45 2.3% Other race97 0.3% White alone, not Hispanic / Latino40 0.7% Hispanic or LatinoMoved from abroad 34 0.1% White18 0.9% Other race20 0.1% White alone, not Hispanic / Latino47 0.8% Hispanic or Latino
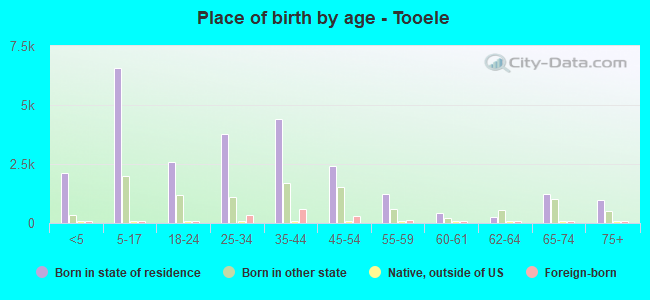
Children Nativity (place of birth) in Tooele
Children under 6 years - Living with two parents Both parents native 2,176 100.0% NativeOne native, one foreign-born parent 94 100.0% NativeChildren under 6 years - Living with one parent Native parent 888 100.0% NativeForeign-born parent 5 100.0% Foreign-bornChildren 6 to 17 years - Living with two parents Both parents native 4,778 99.7% Native14 0.3% Foreign-bornBoth parents foreign-born 298 100.0% NativeOne native, one foreign-born parent 518 100.0% NativeChildren 6 to 17 years - Living with one parent Native parent 1,569 100.0% NativeForeign-born parent 32 50.7% Native31 49.3% Foreign-born
Grandparents responsible for own grandchildren in Tooele
Grandparents (30 to 59 years) White / Caucasian 257 51.9% Responsible for grandchildren239 48.1% Not responsible for grandchildrenOther race 67 100.0% Responsible for grandchildrenWhite alone, not Hispanic / Latino 257 48.7% Responsible for grandchildren271 51.3% Not responsible for grandchildrenHispanic or Latino 57 100.0% Responsible for grandchildrenGrandparents (60 years and over) White / Caucasian 37 5.4% Responsible for grandchildren642 94.6% Not responsible for grandchildrenOther race 8 65.3% Responsible for grandchildren4 34.7% Not responsible for grandchildrenWhite alone, not Hispanic / Latino 37 5.8% Responsible for grandchildren596 94.2% Not responsible for grandchildrenHispanic or Latino 8 26.7% Responsible for grandchildren22 73.3% Not responsible for grandchildren