Races in Titusville, Florida (FL) Detailed Stats
Data:
Races - White alone (%)
Races - White alone (% change since 2000)
Races - Black alone (%)
Races - Black alone (% change since 2000)
Races - American Indian alone (%)
Races - American Indian alone (% change since 2000)
Races - Asian alone (%)
Races - Asian alone (% change since 2000)
Races - Hispanic (%)
Races - Hispanic (% change since 2000)
Races - Native Hawaiian and Other Pacific Islander alone (%)
Races - Native Hawaiian and Other Pacific Islander alone (% change since 2000)
Races - Two or more races(%)
Races - Two or more races(% change since 2000)
Races - Other race alone (%)
Races - Other race alone (% change since 2000)
Racial diversity
Place of birth - Born in state of residence (%)
Place of birth - Born in state of residence (%) - White
Place of birth - Born in state of residence (%) - Black or African American
Place of birth - Born in state of residence (%) - Asian
Place of birth - Born in state of residence (%) - Hispanic or Latino
Place of birth - Born in state of residence (%) - American Indian and Alaska Native
Place of birth - Born in state of residence (%) - Multirace
Place of birth - Born in state of residence (%) - Other Race
Place of birth - Born in other state (%)
Place of birth - Born in other state (%) - White
Place of birth - Born in other state (%) - Black or African American
Place of birth - Born in other state (%) - Asian
Place of birth - Born in other state (%) - Hispanic or Latino
Place of birth - Born in other state (%) - American Indian and Alaska Native
Place of birth - Born in other state (%) - Multirace
Place of birth - Born in other state (%) - Other Race
Place of birth - Native, outside of US (%)
Place of birth - Native, outside of US (%) - White
Place of birth - Native, outside of US (%) - Black or African American
Place of birth - Native, outside of US (%) - Asian
Place of birth - Native, outside of US (%) - Hispanic or Latino
Place of birth - Native, outside of US (%) - American Indian and Alaska Native
Place of birth - Native, outside of US (%) - Multirace
Place of birth - Native, outside of US (%) - Other Race
Place of birth - Foreign born (%)
Place of birth - Foreign born (%) - White
Place of birth - Foreign born (%) - Black or African American
Place of birth - Foreign born (%) - Asian
Place of birth - Foreign born (%) - Hispanic or Latino
Place of birth - Foreign born (%) - American Indian and Alaska Native
Place of birth - Foreign born (%) - Multirace
Place of birth - Foreign born (%) - Other Race
Residents speaking English at home (%)
Residents speaking English at home - Born in the United States (%)
Residents speaking English at home - Native, born elsewhere (%)
Residents speaking English at home - Foreign born (%)
Residents speaking Spanish at home (%)
Residents speaking Spanish at home - Born in the United States (%)
Residents speaking Spanish at home - Native, born elsewhere (%)
Residents speaking Spanish at home - Foreign born (%)
Residents speaking other language at home (%)
Residents speaking other language at home - Born in the United States (%)
Residents speaking other language at home - Native, born elsewhere (%)
Residents speaking other language at home - Foreign born (%)
Marital status - Never married (%)
Marital status - Now married (%)
Marital status - Separated (%)
Marital status - Widowed (%)
Marital status - Divorced (%)
Ancestries Reported - Arab (%)
Ancestries Reported - Czech (%)
Ancestries Reported - Danish (%)
Ancestries Reported - Dutch (%)
Ancestries Reported - English (%)
Ancestries Reported - French (%)
Ancestries Reported - French Canadian (%)
Ancestries Reported - German (%)
Ancestries Reported - Greek (%)
Ancestries Reported - Hungarian (%)
Ancestries Reported - Irish (%)
Ancestries Reported - Italian (%)
Ancestries Reported - Lithuanian (%)
Ancestries Reported - Norwegian (%)
Ancestries Reported - Polish (%)
Ancestries Reported - Portuguese (%)
Ancestries Reported - Russian (%)
Ancestries Reported - Scotch-Irish (%)
Ancestries Reported - Scottish (%)
Ancestries Reported - Slovak (%)
Ancestries Reported - Subsaharan African (%)
Ancestries Reported - Swedish (%)
Ancestries Reported - Swiss (%)
Ancestries Reported - Ukrainian (%)
Ancestries Reported - United States (%)
Ancestries Reported - Welsh (%)
Ancestries Reported - West Indian (%)
Ancestries Reported - Other (%)
Geographical mobility - Same house 1 year ago (%)
Geographical mobility - Same house 1 year ago (%) - White
Geographical mobility - Same house 1 year ago (%) - Black or African American
Geographical mobility - Same house 1 year ago (%) - Asian
Geographical mobility - Same house 1 year ago (%) - Hispanic or Latino
Geographical mobility - Same house 1 year ago (%) - American Indian and Alaska Native
Geographical mobility - Same house 1 year ago (%) - Multirace
Geographical mobility - Same house 1 year ago (%) - Other Race
Geographical mobility - Moved within same county (%)
Geographical mobility - Moved within same county (%) - White
Geographical mobility - Moved within same county (%) - Black or African American
Geographical mobility - Moved within same county (%) - Asian
Geographical mobility - Moved within same county (%) - Hispanic or Latino
Geographical mobility - Moved within same county (%) - American Indian and Alaska Native
Geographical mobility - Moved within same county (%) - Multirace
Geographical mobility - Moved within same county (%) - Other Race
Geographical mobility - Moved from different county within same state (%)
Geographical mobility - Moved from different county within same state (%) - White
Geographical mobility - Moved from different county within same state (%) - Black or African American
Geographical mobility - Moved from different county within same state (%) - Asian
Geographical mobility - Moved from different county within same state (%) - Hispanic or Latino
Geographical mobility - Moved from different county within same state (%) - American Indian and Alaska Native
Geographical mobility - Moved from different county within same state (%) - Multirace
Geographical mobility - Moved from different county within same state (%) - Other Race
Geographical mobility - Moved from different state (%)
Geographical mobility - Moved from different state (%) - White
Geographical mobility - Moved from different state (%) - Black or African American
Geographical mobility - Moved from different state (%) - Asian
Geographical mobility - Moved from different state (%) - Hispanic or Latino
Geographical mobility - Moved from different state (%) - American Indian and Alaska Native
Geographical mobility - Moved from different state (%) - Multirace
Geographical mobility - Moved from different state (%) - Other Race
Geographical mobility - Moved from abroad (%)
Geographical mobility - Moved from abroad (%) - White
Geographical mobility - Moved from abroad (%) - Black or African American
Geographical mobility - Moved from abroad (%) - Asian
Geographical mobility - Moved from abroad (%) - Hispanic or Latino
Geographical mobility - Moved from abroad (%) - American Indian and Alaska Native
Geographical mobility - Moved from abroad (%) - Multirace
Geographical mobility - Moved from abroad (%) - Other Race
Place of birth for the foreign-born population - Ireland (%)
Place of birth for the foreign-born population - Denmark (%)
Place of birth for the foreign-born population - Norway (%)
Place of birth for the foreign-born population - Sweden (%)
Place of birth for the foreign-born population - United Kingdom (%)
Place of birth for the foreign-born population - England (%)
Place of birth for the foreign-born population - Scotland (%)
Place of birth for the foreign-born population - Other Northern Europe (%)
Place of birth for the foreign-born population - Austria (%)
Place of birth for the foreign-born population - Belgium (%)
Place of birth for the foreign-born population - France (%)
Place of birth for the foreign-born population - Germany (%)
Place of birth for the foreign-born population - Netherlands (%)
Place of birth for the foreign-born population - Switzerland (%)
Place of birth for the foreign-born population - Other Western Europe (%)
Place of birth for the foreign-born population - Greece (%)
Place of birth for the foreign-born population - Italy (%)
Place of birth for the foreign-born population - Portugal (%)
Place of birth for the foreign-born population - Spain (%)
Place of birth for the foreign-born population - Other Southern Europe (%)
Place of birth for the foreign-born population - Albania (%)
Place of birth for the foreign-born population - Belarus (%)
Place of birth for the foreign-born population - Bosnia and Herzegovina (%)
Place of birth for the foreign-born population - Bulgaria (%)
Place of birth for the foreign-born population - Croatia (%)
Place of birth for the foreign-born population - Czechoslovakia (%)
Place of birth for the foreign-born population - Hungary (%)
Place of birth for the foreign-born population - Latvia (%)
Place of birth for the foreign-born population - Lithuania (%)
Place of birth for the foreign-born population - North Macedonia (Macedonia) (%)
Place of birth for the foreign-born population - Moldova (%)
Place of birth for the foreign-born population - Poland (%)
Place of birth for the foreign-born population - Romania (%)
Place of birth for the foreign-born population - Russia (%)
Place of birth for the foreign-born population - Serbia (%)
Place of birth for the foreign-born population - Ukraine (%)
Place of birth for the foreign-born population - Other Eastern Europe (%)
Place of birth for the foreign-born population - China (%)
Place of birth for the foreign-born population - Hong Kong (%)
Place of birth for the foreign-born population - Taiwan (%)
Place of birth for the foreign-born population - Japan (%)
Place of birth for the foreign-born population - Korea (%)
Place of birth for the foreign-born population - Other Eastern Asia (%)
Place of birth for the foreign-born population - Afghanistan (%)
Place of birth for the foreign-born population - Bangladesh (%)
Place of birth for the foreign-born population - India (%)
Place of birth for the foreign-born population - Iran (%)
Place of birth for the foreign-born population - Kazakhstan (%)
Place of birth for the foreign-born population - Nepal (%)
Place of birth for the foreign-born population - Pakistan (%)
Place of birth for the foreign-born population - Sri Lanka (%)
Place of birth for the foreign-born population - Uzbekistan (%)
Place of birth for the foreign-born population - Other South Central Asia (%)
Place of birth for the foreign-born population - Burma (%)
Place of birth for the foreign-born population - Cambodia (%)
Place of birth for the foreign-born population - Indonesia (%)
Place of birth for the foreign-born population - Laos (%)
Place of birth for the foreign-born population - Malaysia (%)
Place of birth for the foreign-born population - Philippines (%)
Place of birth for the foreign-born population - Singapore (%)
Place of birth for the foreign-born population - Thailand (%)
Place of birth for the foreign-born population - Vietnam (%)
Place of birth for the foreign-born population - Other South Eastern Asia (%)
Place of birth for the foreign-born population - Armenia (%)
Place of birth for the foreign-born population - Iraq (%)
Place of birth for the foreign-born population - Israel (%)
Place of birth for the foreign-born population - Jordan (%)
Place of birth for the foreign-born population - Kuwait (%)
Place of birth for the foreign-born population - Lebanon (%)
Place of birth for the foreign-born population - Saudi Arabia (%)
Place of birth for the foreign-born population - Syria (%)
Place of birth for the foreign-born population - Turkey (%)
Place of birth for the foreign-born population - Yemen (%)
Place of birth for the foreign-born population - Other Western Asia (%)
Place of birth for the foreign-born population - Eritrea (%)
Place of birth for the foreign-born population - Ethiopia (%)
Place of birth for the foreign-born population - Kenya (%)
Place of birth for the foreign-born population - Somalia (%)
Place of birth for the foreign-born population - Uganda (%)
Place of birth for the foreign-born population - Zimbabwe (%)
Place of birth for the foreign-born population - Other Eastern Africa (%)
Place of birth for the foreign-born population - Cameroon (%)
Place of birth for the foreign-born population - Congo (%)
Place of birth for the foreign-born population - Democratic Republic of Congo (Zaire) (%)
Place of birth for the foreign-born population - Other Middle Africa (%)
Place of birth for the foreign-born population - Egypt (%)
Place of birth for the foreign-born population - Morocco (%)
Place of birth for the foreign-born population - Sudan (%)
Place of birth for the foreign-born population - Other Northern Africa (%)
Place of birth for the foreign-born population - South Africa (%)
Place of birth for the foreign-born population - Other Southern Africa (%)
Place of birth for the foreign-born population - Cabo Verde (%)
Place of birth for the foreign-born population - Ghana (%)
Place of birth for the foreign-born population - Liberia (%)
Place of birth for the foreign-born population - Nigeria (%)
Place of birth for the foreign-born population - Senegal (%)
Place of birth for the foreign-born population - Sierra Leone (%)
Place of birth for the foreign-born population - Other Western Africa (%)
Place of birth for the foreign-born population - Australia (%)
Place of birth for the foreign-born population - New Zealand (%)
Place of birth for the foreign-born population - Fiji (%)
Place of birth for the foreign-born population - Micronesia (%)
Place of birth for the foreign-born population - Bahamas (%)
Place of birth for the foreign-born population - Barbados (%)
Place of birth for the foreign-born population - Cuba (%)
Place of birth for the foreign-born population - Dominica (%)
Place of birth for the foreign-born population - Dominican Republic (%)
Place of birth for the foreign-born population - Grenada (%)
Place of birth for the foreign-born population - Haiti (%)
Place of birth for the foreign-born population - Jamaica (%)
Place of birth for the foreign-born population - St. Vincent and the Grenadines (%)
Place of birth for the foreign-born population - Trinidad and Tobago (%)
Place of birth for the foreign-born population - West Indies (%)
Place of birth for the foreign-born population - Other Caribbean (%)
Place of birth for the foreign-born population - Belize (%)
Place of birth for the foreign-born population - Costa Rica (%)
Place of birth for the foreign-born population - El Salvador (%)
Place of birth for the foreign-born population - Guatemala (%)
Place of birth for the foreign-born population - Honduras (%)
Place of birth for the foreign-born population - Mexico (%)
Place of birth for the foreign-born population - Nicaragua (%)
Place of birth for the foreign-born population - Panama (%)
Place of birth for the foreign-born population - Other Central America (%)
Place of birth for the foreign-born population - Argentina (%)
Place of birth for the foreign-born population - Bolivia (%)
Place of birth for the foreign-born population - Brazil (%)
Place of birth for the foreign-born population - Chile (%)
Place of birth for the foreign-born population - Colombia (%)
Place of birth for the foreign-born population - Ecuador (%)
Place of birth for the foreign-born population - Guyana (%)
Place of birth for the foreign-born population - Peru (%)
Place of birth for the foreign-born population - Uruguay (%)
Place of birth for the foreign-born population - Venezuela (%)
Place of birth for the foreign-born population - Other South America (%)
Place of birth for the foreign-born population - Canada (%)
Place of birth for the foreign-born population - Other Northern America (%)
Place of birth for the foreign-born population - Other (%)
Latest news about races in Titusville, FL collected exclusively by city-data.com from local newspapers, TV, and radio stations
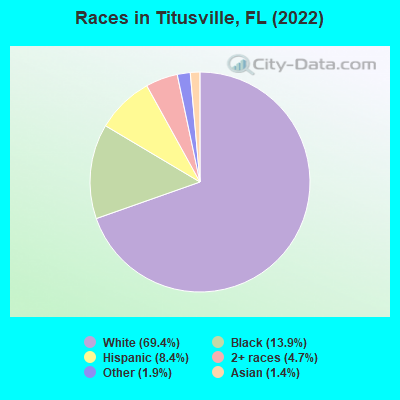
According to 2022 data, the most numerous races in Titusville, FL are White alone (34,817 residents), Hispanic (4,200 residents), and Black alone (6,986 residents). 91.3% of Titusville residents speak English at home. 6.3% of Titusville, FL residents are foreign-born (2.4% born in Latin America, 1.8% born in Asia, 1.3% born in Europe), which is 233.1% less than the foreign-born rate of 21.0% across the entire state of Florida.
Race distribution in Titusville
2000 2022
10,458,509 65.4% White alone 2,682,715 16.8% Hispanic 2,264,268 14.2% Black alone 261,693 1.6% Asian alone 236,954 1.5% Two or more races 42,358 0.3% American Indian alone 28,994 0.2% Other race alone 6,887 0.04% Native Hawaiian and Other
11,309,403 50.8% White alone 6,025,039 27.1% Hispanic 3,241,015 14.6% Black alone 861,630 3.9% Two or more races 623,692 2.8% Asian alone 152,054 0.7% Other race alone 22,504 0.1% American Indian alone 9,486 0.04% Native Hawaiian and Other
Income and house value in Titusville Median household income in 2022 $63,835 White non-Hispanic householders$40,026 Black householders$79,593 Asian householders$65,848 Some other race householders$66,749 Two or more races householders$65,884 Hispanic or Latino race householdersMedian 2022 house value $263,620 White Non-Hispanic householders$209,721 Black or African American householders$300,934 American Indian or Alaska Native householders $456,412 Asian householdersover $1,000,000 Native Hawaiian and other Pacific Islander householders$283,659 Some other race householders$265,002 Two or more races householders$301,280 Hispanic or Latino householders
Median age by race in Titusville
50.0 Median age for White residents46.6 52.3 34.7 Median age for Black or African American residents34.4 33.4 37.1 Median age for American Indian / Alaska Native residents-611,418,047.3 23.0 36.6 Median age for Asian residents26.5 63.1 -679,849,340.2 Median age for Native Hawaiian / Pacific Islander residents-858,307,848.3 -443,298,968.6 37.4 Median age for Other race residents30.8 36.1 24.8 Median age for Two or more races residents27.1 23.9 50.1 Median age for White alone residents46.6 51.9 33.4 Median age for Hispanic or Latino residents33.9 30.5
Owner/renter occupied households by race in Titusville
House owners and renters - White residents 12,030 77.7% Owner occupied3,459 22.3% Renter occupiedHouse owners and renters - Black or African American residents 1,196 38.2% Owner occupied1,934 61.8% Renter occupiedHouse owners and renters - American Indian / Alaska Native residents 21 53.7% Owner occupied18 46.3% Renter occupiedHouse owners and renters - Asian residents 180 96.6% Owner occupied6 3.4% Renter occupiedHouse owners and renters - Native Hawaiian / Pacific Islander residents 9 100.0% Owner occupiedHouse owners and renters - Other race residents 411 74.2% Owner occupied143 25.8% Renter occupiedHouse owners and renters - Two or more races residents 649 46.3% Owner occupied753 53.7% Renter occupiedHouse owners and renters - White alone residents 11,934 78.0% Owner occupied3,373 22.0% Renter occupiedHouse owners and renters - Hispanic or Latino residents 801 59.4% Owner occupied547 40.6% Renter occupied
Language usage in Titusville
English speakers - Total 91.3% of residents of Titusville speak English at home.
5.6% of residents speak Spanish at home 1,401 52.4% Speak English very well1,275 47.6% Speak English less than very well3.2% of residents speak other language at home 1,087 70.4% Speak English very well458 29.6% Speak English less than very well
English speakers - Born in the United States 98.0% of residents of Titusville speak English at home.
1.6% of residents speak Spanish at home 402 96.4% Speak English very well15 3.6% Speak English less than very well0.6% of residents speak other language at home 154 92.2% Speak English very well13 7.8% Speak English less than very well
English speakers - Native, born elsewhere 55.5% of residents of Titusville speak English at home.
43.8% of residents speak Spanish at home 273 39.2% Speak English very well424 60.8% Speak English less than very well1.2% of residents speak other language at home 5 26.3% Speak English very well14 73.7% Speak English less than very well
English speakers - Foreign-born 37.0% of residents of Titusville speak English at home.
31.5% of residents speak Spanish at home 377 35.4% Speak English very well688 64.6% Speak English less than very well32.2% of residents speak other language at home 671 61.7% Speak English very well416 38.3% Speak English less than very well
White (Caucasian) - Speak only English Native:
98.8% (32,066)Foreign-born:
62.3% (846)
White (Caucasian) - Speak another language Native:
1.7% (554)Foreign-born:
40.2% (547)
Black or African American - Speak only English Native:
97.2% (6,405)Foreign-born:
63.9% (213)
Black or African American - Speak another language Native:
2.7% (179)Foreign-born:
36.0% (120)
American Indian / Alaska Native - Speak another language Native:
14.2% (12)Foreign-born:
100.0% (10)
Asian - Speak only English Native:
22.6% (15)Foreign-born:
8.2% (47)
Asian - Speak another language Native:
100.0% (65)Foreign-born:
90.2% (510)
Other race - Speak only English Native:
58.8% (792)Foreign-born:
7.6% (20)
Other race - Speak another language Native:
40.9% (552)Foreign-born:
91.9% (241)
Two or more races - Speak only English Native:
81.8% (3,282)Foreign-born:
10.5% (83)
Two or more races - Speak another language Native:
18.1% (726)Foreign-born:
86.7% (683)
White alone - Speak only English Native:
98.5% (31,750)Foreign-born:
61.3% (845)
White alone - Speak another language Native:
1.4% (464)Foreign-born:
39.0% (537)
Hispanic or Latino - Speak only English Native:
59.5% (1,713)Foreign-born:
6.5% (69)
Hispanic or Latino - Speak another language Native:
40.7% (1,171)Foreign-born:
93.9% (1,009)
Foreign-born residents in Titusville 3,164 residents are foreign born (2.4% Latin America , 1.8% Asia , 1.3% Europe ).
This city:
6.3%Florida:
21.1%
Marital status for residents in Titusville Marital status - White (Caucasian) population 15 years and over
Males 31.4% Never married47.4% Now married1.3% Separated3.7% Widowed16.2% DivorcedFemales 22.5% Never married43.4% Now married1.2% Separated14.1% Widowed18.8% DivorcedWomen who gave birth in the past 12 months Now married:
56.1% (182)Unmarried:
43.9% (143)
Women who did not give birth in the past 12 months Now married:
37.2% (2,512)Unmarried:
62.8% (4,237)
Marital status - Black or African American population 15 years and over
Males 52.4% Never married33.1% Now married1.4% Separated2.3% Widowed10.7% DivorcedFemales 51.5% Never married26.2% Now married5.1% Separated7.3% Widowed9.8% DivorcedWomen who gave birth in the past 12 months Now married:
0.0% (0)Unmarried:
100.0% (95)
Women who did not give birth in the past 12 months Now married:
24.1% (523)Unmarried:
75.9% (1,646)
Marital status - American Indian / Alaska Native population 15 years and over
Males 22.7% Never married0.0% Now married0.0% Separated77.3% Widowed0.0% DivorcedFemales 88.9% Never married0.0% Now married0.0% Separated11.1% Widowed0.0% DivorcedWomen who did not give birth in the past 12 months Now married:
0.0% (0)Unmarried:
100.0% (39)
Marital status - Asian population 15 years and over
Males 23.9% Never married71.6% Now married0.0% Separated4.5% Widowed0.0% DivorcedFemales 2.3% Never married50.1% Now married0.0% Separated47.6% Widowed0.0% DivorcedWomen who gave birth in the past 12 months Now married:
100.0% (66)Unmarried:
0.0% (0)
Women who did not give birth in the past 12 months Now married:
57.9% (13)Unmarried:
42.1% (9)
Marital status - Other race population 15 years and over
Males 10.7% Never married74.1% Now married9.9% Separated0.0% Widowed5.2% DivorcedFemales 27.6% Never married45.6% Now married0.0% Separated1.9% Widowed25.0% DivorcedWomen who gave birth in the past 12 months Now married:
100.0% (35)Unmarried:
0.0% (0)
Women who did not give birth in the past 12 months Now married:
33.2% (174)Unmarried:
66.8% (350)
Marital status - Two or more races population 15 years and over
Males 39.9% Never married29.7% Now married10.7% Separated6.4% Widowed13.3% DivorcedFemales 51.0% Never married30.4% Now married0.0% Separated6.9% Widowed11.7% DivorcedWomen who gave birth in the past 12 months Now married:
35.4% (68)Unmarried:
64.6% (123)
Women who did not give birth in the past 12 months Now married:
32.3% (419)Unmarried:
67.7% (879)
Marital status - White alone, not Hispanic / Latino population 15 years and over
Males 31.7% Never married47.7% Now married1.1% Separated3.8% Widowed15.8% DivorcedFemales 22.6% Never married43.1% Now married1.2% Separated14.2% Widowed19.0% DivorcedWomen who gave birth in the past 12 months Now married:
56.1% (189)Unmarried:
43.9% (148)
Women who did not give birth in the past 12 months Now married:
36.8% (2,509)Unmarried:
63.2% (4,310)
Marital status - Hispanic or Latino population 15 years and over
Males 23.7% Never married41.0% Now married11.0% Separated2.3% Widowed22.0% DivorcedFemales 29.0% Never married48.0% Now married0.9% Separated7.5% Widowed14.7% DivorcedWomen who gave birth in the past 12 months Now married:
8.7% (9)Unmarried:
91.3% (92)
Women who did not give birth in the past 12 months Now married:
48.9% (431)Unmarried:
51.1% (450)
Ancestries in Titusville
3,573 15.5% American2,065 9.0% English2,025 8.8% German1,502 6.5% Irish1,180 5.1% Italian726 3.1% Scandinavian676 2.9% Swedish488 2.1% European423 1.8% Polish268 1.2% Scottish248 1.1% Canadian204 0.9% Jamaican176 0.8% Scotch-Irish171 0.7% Turkish159 0.7% Welsh150 0.7% Trinidadian and Tobagonian134 0.6% French133 0.6% African133 0.6% Dutch106 0.5% British106 0.5% Norwegian102 0.4% Haitian97 0.4% Ukrainian86 0.4% West Indian80 0.3% French Canadian71 0.3% Northern European70 0.3% Slovak66 0.3% Brazilian64 0.3% U.S. Virgin Islander59 0.3% Greek51 0.2% Lithuanian44 0.2% Portuguese31 0.1% Hungarian28 0.1% Finnish26 0.1% Russian25 0.1% Maltese25 0.1% Bahamian20 0.09% Swiss16 0.07% Latvian16 0.07% Eastern European15 0.07% Croatian12 0.05% Danish11 0.05% Czech9 0.04% Celtic9 0.04% Slovene9 0.04% Belgian8 0.03% Czechoslovakian8 0.03% British West Indian3 0.01% Syrian
Geographical mobility in Titusville Same house 1 year ago 31,063 89.4% White (Caucasian)6,442 87.3% Black or African American106 100.0% American Indian / Alaska Native547 82.8% Asian21 100.0% Native Hawaiian / Pacific Islander1,792 99.6% Other race4,531 90.1% Two or more races30,888 89.6% White alone, not Hispanic / Latino3,863 92.0% Hispanic or LatinoMoved within same county 1,556 4.5% White / Caucasian469 6.4% Black or African American7 1.1% Asian13 0.7% Other race256 5.1% Two or more races1,491 4.3% White alone, not Hispanic / Latino120 2.9% Hispanic or LatinoMoved within same state 1,163 3.3% White / Caucasian479 6.5% Black or African American16 2.4% Asian52 2.9% Other race107 2.1% Two or more races1,173 3.4% White alone, not Hispanic / Latino89 2.1% Hispanic or LatinoMoved from different state 1,021 2.9% White / Caucasian91 1.2% Black or African American10 1.6% Asian112 2.2% Two or more races972 2.8% White alone, not Hispanic / Latino68 1.6% Hispanic or LatinoMoved from abroad 110 0.3% White61 0.8% Black or African American94 14.2% Asian25 1.4% Other race129 0.4% White alone, not Hispanic / Latino25 0.6% Hispanic or Latino
Children Nativity (place of birth) in Titusville
Children under 6 years - Living with two parents Both parents native 1,469 100.0% NativeBoth parents foreign-born 226 100.0% NativeOne native, one foreign-born parent 88 100.0% NativeChildren under 6 years - Living with one parent Native parent 761 100.0% NativeForeign-born parent 33 100.0% NativeChildren 6 to 17 years - Living with two parents Both parents native 3,938 100.0% NativeBoth parents foreign-born 59 100.0% Foreign-bornOne native, one foreign-born parent 153 100.0% NativeChildren 6 to 17 years - Living with one parent Native parent 1,912 100.0% NativeForeign-born parent 181 56.7% Native138 43.3% Foreign-born
Grandparents responsible for own grandchildren in Titusville
Grandparents (30 to 59 years) White / Caucasian 60 42.1% Responsible for grandchildren83 57.9% Not responsible for grandchildrenBlack or African American 23 100.0% Responsible for grandchildrenTwo or more races 20 100.0% Not responsible for grandchildrenWhite alone, not Hispanic / Latino 46 38.7% Responsible for grandchildren72 61.3% Not responsible for grandchildrenGrandparents (60 years and over) White / Caucasian 114 38.5% Responsible for grandchildren182 61.5% Not responsible for grandchildrenBlack or African American 9 100.0% Not responsible for grandchildrenTwo or more races 11 100.0% Not responsible for grandchildrenWhite alone, not Hispanic / Latino 102 39.4% Responsible for grandchildren156 60.6% Not responsible for grandchildren