Races in Tiffin, Ohio (OH) Detailed Stats
Data:
Races - White alone (%)
Races - White alone (% change since 2000)
Races - Black alone (%)
Races - Black alone (% change since 2000)
Races - American Indian alone (%)
Races - American Indian alone (% change since 2000)
Races - Asian alone (%)
Races - Asian alone (% change since 2000)
Races - Hispanic (%)
Races - Hispanic (% change since 2000)
Races - Native Hawaiian and Other Pacific Islander alone (%)
Races - Native Hawaiian and Other Pacific Islander alone (% change since 2000)
Races - Two or more races(%)
Races - Two or more races(% change since 2000)
Races - Other race alone (%)
Races - Other race alone (% change since 2000)
Racial diversity
Place of birth - Born in state of residence (%)
Place of birth - Born in state of residence (%) - White
Place of birth - Born in state of residence (%) - Black or African American
Place of birth - Born in state of residence (%) - Asian
Place of birth - Born in state of residence (%) - Hispanic or Latino
Place of birth - Born in state of residence (%) - American Indian and Alaska Native
Place of birth - Born in state of residence (%) - Multirace
Place of birth - Born in state of residence (%) - Other Race
Place of birth - Born in other state (%)
Place of birth - Born in other state (%) - White
Place of birth - Born in other state (%) - Black or African American
Place of birth - Born in other state (%) - Asian
Place of birth - Born in other state (%) - Hispanic or Latino
Place of birth - Born in other state (%) - American Indian and Alaska Native
Place of birth - Born in other state (%) - Multirace
Place of birth - Born in other state (%) - Other Race
Place of birth - Native, outside of US (%)
Place of birth - Native, outside of US (%) - White
Place of birth - Native, outside of US (%) - Black or African American
Place of birth - Native, outside of US (%) - Asian
Place of birth - Native, outside of US (%) - Hispanic or Latino
Place of birth - Native, outside of US (%) - American Indian and Alaska Native
Place of birth - Native, outside of US (%) - Multirace
Place of birth - Native, outside of US (%) - Other Race
Place of birth - Foreign born (%)
Place of birth - Foreign born (%) - White
Place of birth - Foreign born (%) - Black or African American
Place of birth - Foreign born (%) - Asian
Place of birth - Foreign born (%) - Hispanic or Latino
Place of birth - Foreign born (%) - American Indian and Alaska Native
Place of birth - Foreign born (%) - Multirace
Place of birth - Foreign born (%) - Other Race
Residents speaking English at home (%)
Residents speaking English at home - Born in the United States (%)
Residents speaking English at home - Native, born elsewhere (%)
Residents speaking English at home - Foreign born (%)
Residents speaking Spanish at home (%)
Residents speaking Spanish at home - Born in the United States (%)
Residents speaking Spanish at home - Native, born elsewhere (%)
Residents speaking Spanish at home - Foreign born (%)
Residents speaking other language at home (%)
Residents speaking other language at home - Born in the United States (%)
Residents speaking other language at home - Native, born elsewhere (%)
Residents speaking other language at home - Foreign born (%)
Marital status - Never married (%)
Marital status - Now married (%)
Marital status - Separated (%)
Marital status - Widowed (%)
Marital status - Divorced (%)
Ancestries Reported - Arab (%)
Ancestries Reported - Czech (%)
Ancestries Reported - Danish (%)
Ancestries Reported - Dutch (%)
Ancestries Reported - English (%)
Ancestries Reported - French (%)
Ancestries Reported - French Canadian (%)
Ancestries Reported - German (%)
Ancestries Reported - Greek (%)
Ancestries Reported - Hungarian (%)
Ancestries Reported - Irish (%)
Ancestries Reported - Italian (%)
Ancestries Reported - Lithuanian (%)
Ancestries Reported - Norwegian (%)
Ancestries Reported - Polish (%)
Ancestries Reported - Portuguese (%)
Ancestries Reported - Russian (%)
Ancestries Reported - Scotch-Irish (%)
Ancestries Reported - Scottish (%)
Ancestries Reported - Slovak (%)
Ancestries Reported - Subsaharan African (%)
Ancestries Reported - Swedish (%)
Ancestries Reported - Swiss (%)
Ancestries Reported - Ukrainian (%)
Ancestries Reported - United States (%)
Ancestries Reported - Welsh (%)
Ancestries Reported - West Indian (%)
Ancestries Reported - Other (%)
Geographical mobility - Same house 1 year ago (%)
Geographical mobility - Same house 1 year ago (%) - White
Geographical mobility - Same house 1 year ago (%) - Black or African American
Geographical mobility - Same house 1 year ago (%) - Asian
Geographical mobility - Same house 1 year ago (%) - Hispanic or Latino
Geographical mobility - Same house 1 year ago (%) - American Indian and Alaska Native
Geographical mobility - Same house 1 year ago (%) - Multirace
Geographical mobility - Same house 1 year ago (%) - Other Race
Geographical mobility - Moved within same county (%)
Geographical mobility - Moved within same county (%) - White
Geographical mobility - Moved within same county (%) - Black or African American
Geographical mobility - Moved within same county (%) - Asian
Geographical mobility - Moved within same county (%) - Hispanic or Latino
Geographical mobility - Moved within same county (%) - American Indian and Alaska Native
Geographical mobility - Moved within same county (%) - Multirace
Geographical mobility - Moved within same county (%) - Other Race
Geographical mobility - Moved from different county within same state (%)
Geographical mobility - Moved from different county within same state (%) - White
Geographical mobility - Moved from different county within same state (%) - Black or African American
Geographical mobility - Moved from different county within same state (%) - Asian
Geographical mobility - Moved from different county within same state (%) - Hispanic or Latino
Geographical mobility - Moved from different county within same state (%) - American Indian and Alaska Native
Geographical mobility - Moved from different county within same state (%) - Multirace
Geographical mobility - Moved from different county within same state (%) - Other Race
Geographical mobility - Moved from different state (%)
Geographical mobility - Moved from different state (%) - White
Geographical mobility - Moved from different state (%) - Black or African American
Geographical mobility - Moved from different state (%) - Asian
Geographical mobility - Moved from different state (%) - Hispanic or Latino
Geographical mobility - Moved from different state (%) - American Indian and Alaska Native
Geographical mobility - Moved from different state (%) - Multirace
Geographical mobility - Moved from different state (%) - Other Race
Geographical mobility - Moved from abroad (%)
Geographical mobility - Moved from abroad (%) - White
Geographical mobility - Moved from abroad (%) - Black or African American
Geographical mobility - Moved from abroad (%) - Asian
Geographical mobility - Moved from abroad (%) - Hispanic or Latino
Geographical mobility - Moved from abroad (%) - American Indian and Alaska Native
Geographical mobility - Moved from abroad (%) - Multirace
Geographical mobility - Moved from abroad (%) - Other Race
Place of birth for the foreign-born population - Ireland (%)
Place of birth for the foreign-born population - Denmark (%)
Place of birth for the foreign-born population - Norway (%)
Place of birth for the foreign-born population - Sweden (%)
Place of birth for the foreign-born population - United Kingdom (%)
Place of birth for the foreign-born population - England (%)
Place of birth for the foreign-born population - Scotland (%)
Place of birth for the foreign-born population - Other Northern Europe (%)
Place of birth for the foreign-born population - Austria (%)
Place of birth for the foreign-born population - Belgium (%)
Place of birth for the foreign-born population - France (%)
Place of birth for the foreign-born population - Germany (%)
Place of birth for the foreign-born population - Netherlands (%)
Place of birth for the foreign-born population - Switzerland (%)
Place of birth for the foreign-born population - Other Western Europe (%)
Place of birth for the foreign-born population - Greece (%)
Place of birth for the foreign-born population - Italy (%)
Place of birth for the foreign-born population - Portugal (%)
Place of birth for the foreign-born population - Spain (%)
Place of birth for the foreign-born population - Other Southern Europe (%)
Place of birth for the foreign-born population - Albania (%)
Place of birth for the foreign-born population - Belarus (%)
Place of birth for the foreign-born population - Bosnia and Herzegovina (%)
Place of birth for the foreign-born population - Bulgaria (%)
Place of birth for the foreign-born population - Croatia (%)
Place of birth for the foreign-born population - Czechoslovakia (%)
Place of birth for the foreign-born population - Hungary (%)
Place of birth for the foreign-born population - Latvia (%)
Place of birth for the foreign-born population - Lithuania (%)
Place of birth for the foreign-born population - North Macedonia (Macedonia) (%)
Place of birth for the foreign-born population - Moldova (%)
Place of birth for the foreign-born population - Poland (%)
Place of birth for the foreign-born population - Romania (%)
Place of birth for the foreign-born population - Russia (%)
Place of birth for the foreign-born population - Serbia (%)
Place of birth for the foreign-born population - Ukraine (%)
Place of birth for the foreign-born population - Other Eastern Europe (%)
Place of birth for the foreign-born population - China (%)
Place of birth for the foreign-born population - Hong Kong (%)
Place of birth for the foreign-born population - Taiwan (%)
Place of birth for the foreign-born population - Japan (%)
Place of birth for the foreign-born population - Korea (%)
Place of birth for the foreign-born population - Other Eastern Asia (%)
Place of birth for the foreign-born population - Afghanistan (%)
Place of birth for the foreign-born population - Bangladesh (%)
Place of birth for the foreign-born population - India (%)
Place of birth for the foreign-born population - Iran (%)
Place of birth for the foreign-born population - Kazakhstan (%)
Place of birth for the foreign-born population - Nepal (%)
Place of birth for the foreign-born population - Pakistan (%)
Place of birth for the foreign-born population - Sri Lanka (%)
Place of birth for the foreign-born population - Uzbekistan (%)
Place of birth for the foreign-born population - Other South Central Asia (%)
Place of birth for the foreign-born population - Burma (%)
Place of birth for the foreign-born population - Cambodia (%)
Place of birth for the foreign-born population - Indonesia (%)
Place of birth for the foreign-born population - Laos (%)
Place of birth for the foreign-born population - Malaysia (%)
Place of birth for the foreign-born population - Philippines (%)
Place of birth for the foreign-born population - Singapore (%)
Place of birth for the foreign-born population - Thailand (%)
Place of birth for the foreign-born population - Vietnam (%)
Place of birth for the foreign-born population - Other South Eastern Asia (%)
Place of birth for the foreign-born population - Armenia (%)
Place of birth for the foreign-born population - Iraq (%)
Place of birth for the foreign-born population - Israel (%)
Place of birth for the foreign-born population - Jordan (%)
Place of birth for the foreign-born population - Kuwait (%)
Place of birth for the foreign-born population - Lebanon (%)
Place of birth for the foreign-born population - Saudi Arabia (%)
Place of birth for the foreign-born population - Syria (%)
Place of birth for the foreign-born population - Turkey (%)
Place of birth for the foreign-born population - Yemen (%)
Place of birth for the foreign-born population - Other Western Asia (%)
Place of birth for the foreign-born population - Eritrea (%)
Place of birth for the foreign-born population - Ethiopia (%)
Place of birth for the foreign-born population - Kenya (%)
Place of birth for the foreign-born population - Somalia (%)
Place of birth for the foreign-born population - Uganda (%)
Place of birth for the foreign-born population - Zimbabwe (%)
Place of birth for the foreign-born population - Other Eastern Africa (%)
Place of birth for the foreign-born population - Cameroon (%)
Place of birth for the foreign-born population - Congo (%)
Place of birth for the foreign-born population - Democratic Republic of Congo (Zaire) (%)
Place of birth for the foreign-born population - Other Middle Africa (%)
Place of birth for the foreign-born population - Egypt (%)
Place of birth for the foreign-born population - Morocco (%)
Place of birth for the foreign-born population - Sudan (%)
Place of birth for the foreign-born population - Other Northern Africa (%)
Place of birth for the foreign-born population - South Africa (%)
Place of birth for the foreign-born population - Other Southern Africa (%)
Place of birth for the foreign-born population - Cabo Verde (%)
Place of birth for the foreign-born population - Ghana (%)
Place of birth for the foreign-born population - Liberia (%)
Place of birth for the foreign-born population - Nigeria (%)
Place of birth for the foreign-born population - Senegal (%)
Place of birth for the foreign-born population - Sierra Leone (%)
Place of birth for the foreign-born population - Other Western Africa (%)
Place of birth for the foreign-born population - Australia (%)
Place of birth for the foreign-born population - New Zealand (%)
Place of birth for the foreign-born population - Fiji (%)
Place of birth for the foreign-born population - Micronesia (%)
Place of birth for the foreign-born population - Bahamas (%)
Place of birth for the foreign-born population - Barbados (%)
Place of birth for the foreign-born population - Cuba (%)
Place of birth for the foreign-born population - Dominica (%)
Place of birth for the foreign-born population - Dominican Republic (%)
Place of birth for the foreign-born population - Grenada (%)
Place of birth for the foreign-born population - Haiti (%)
Place of birth for the foreign-born population - Jamaica (%)
Place of birth for the foreign-born population - St. Vincent and the Grenadines (%)
Place of birth for the foreign-born population - Trinidad and Tobago (%)
Place of birth for the foreign-born population - West Indies (%)
Place of birth for the foreign-born population - Other Caribbean (%)
Place of birth for the foreign-born population - Belize (%)
Place of birth for the foreign-born population - Costa Rica (%)
Place of birth for the foreign-born population - El Salvador (%)
Place of birth for the foreign-born population - Guatemala (%)
Place of birth for the foreign-born population - Honduras (%)
Place of birth for the foreign-born population - Mexico (%)
Place of birth for the foreign-born population - Nicaragua (%)
Place of birth for the foreign-born population - Panama (%)
Place of birth for the foreign-born population - Other Central America (%)
Place of birth for the foreign-born population - Argentina (%)
Place of birth for the foreign-born population - Bolivia (%)
Place of birth for the foreign-born population - Brazil (%)
Place of birth for the foreign-born population - Chile (%)
Place of birth for the foreign-born population - Colombia (%)
Place of birth for the foreign-born population - Ecuador (%)
Place of birth for the foreign-born population - Guyana (%)
Place of birth for the foreign-born population - Peru (%)
Place of birth for the foreign-born population - Uruguay (%)
Place of birth for the foreign-born population - Venezuela (%)
Place of birth for the foreign-born population - Other South America (%)
Place of birth for the foreign-born population - Canada (%)
Place of birth for the foreign-born population - Other Northern America (%)
Place of birth for the foreign-born population - Other (%)
Latest news about races in Tiffin, OH collected exclusively by city-data.com from local newspapers, TV, and radio stations
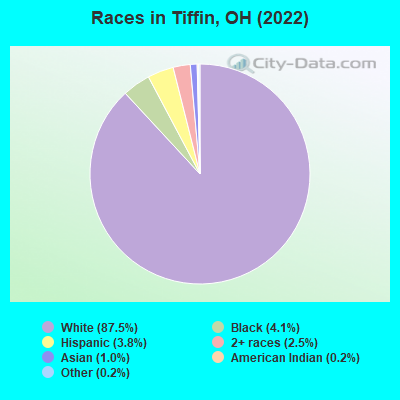
According to 2022 data, the most numerous races in Tiffin, OH are White alone (15,640 residents), Black alone (738 residents), and Two or more races (451 residents). 96.0% of Tiffin residents speak English at home. 1.6% of Tiffin, OH residents are foreign-born , which is 148.1% less than the foreign-born rate of 4.0% across the entire state of Ohio.
Race distribution in Tiffin
2000 2022
9,538,111 84.0% White alone 1,290,662 11.4% Black alone 217,123 1.9% Hispanic 137,770 1.2% Two or more races 131,670 1.2% Asian alone 21,985 0.2% American Indian alone 13,483 0.1% Other race alone 2,336 0.02% Native Hawaiian and Other
8,948,793 76.1% White alone 1,401,403 11.9% Black alone 529,291 4.5% Two or more races 517,232 4.4% Hispanic 293,387 2.5% Asian alone 52,805 0.4% Other race alone 9,785 0.08% American Indian alone 3,362 0.03% Native Hawaiian and Other
Income and house value in Tiffin Median household income in 2022 $47,841 White non-Hispanic householders$75,625 Black householders$53,774 Asian householdersMedian 2022 house value $139,622 White Non-Hispanic householders$234,580 Black or African American householders$99,860 American Indian or Alaska Native householders $295,041 Asian householders$49,930 Some other race householders$116,564 Two or more races householders$75,349 Hispanic or Latino householders
Median age by race in Tiffin
38.9 Median age for White residents35.3 41.9 22.9 Median age for Black or African American residents24.7 21.8 87.5 Median age for American Indian / Alaska Native residents88.6 -658,163,264.6 47.5 Median age for Asian residents32.9 49.5 -800,387,596.1 Median age for Native Hawaiian / Pacific Islander residents-750,242,953.6 -805,394,989.6 20.0 Median age for Other race residents29.9 18.5 22.3 Median age for Two or more races residents29.1 13.9 39.3 Median age for White alone residents35.8 42.1 24.6 Median age for Hispanic or Latino residents29.0 21.4
Owner/renter occupied households by race in Tiffin
House owners and renters - White residents 4,373 61.4% Owner occupied2,745 38.6% Renter occupiedHouse owners and renters - Black or African American residents 23 14.1% Owner occupied138 85.9% Renter occupiedHouse owners and renters - American Indian / Alaska Native residents 40 100.0% Owner occupiedHouse owners and renters - Asian residents 21 45.8% Owner occupied25 54.2% Renter occupiedHouse owners and renters - Other race residents 33 100.0% Owner occupiedHouse owners and renters - Two or more races residents 169 74.8% Owner occupied57 25.2% Renter occupiedHouse owners and renters - White alone residents 4,316 61.8% Owner occupied2,665 38.2% Renter occupiedHouse owners and renters - Hispanic or Latino residents 151 54.2% Owner occupied128 45.8% Renter occupied
Language usage in Tiffin
English speakers - Total 96.0% of residents of Tiffin speak English at home.
2.0% of residents speak Spanish at home 269 76.6% Speak English very well82 23.4% Speak English less than very well1.8% of residents speak other language at home 219 72.0% Speak English very well85 28.0% Speak English less than very well
English speakers - Born in the United States 95.3% of residents of Tiffin speak English at home.
3.8% of residents speak Spanish at home 87 100.0% Speak English very well0.9% of residents speak other language at home 20 100.0% Speak English very well
English speakers - Native, born elsewhere 39.4% of residents of Tiffin speak English at home.
30.3% of residents speak Spanish at home 20 100.0% Speak English very well27.3% of residents speak other language at home 18 100.0% Speak English very well
English speakers - Foreign-born 44.1% of residents of Tiffin speak English at home.
7.6% of residents speak Spanish at home 23 100.0% Speak English less than very well47.4% of residents speak other language at home 82 56.9% Speak English very well62 43.1% Speak English less than very well
White (Caucasian) - Speak only English Native:
98.1% (14,888)Foreign-born:
68.1% (88)
White (Caucasian) - Speak another language Native:
2.0% (297)Foreign-born:
36.2% (47)
Black or African American - Speak another language Native:
1.6% (10)Foreign-born:
97.3% (13)
Asian - Speak only English Native:
69.3% (40)Foreign-born:
32.4% (37)
Asian - Speak another language Native:
31.6% (18)Foreign-born:
65.8% (76)
Other race - Speak another language Native:
58.5% (90)Foreign-born:
100.0% (7)
Two or more races - Speak another language Native:
10.9% (65)Foreign-born:
100.0% (21)
White alone - Speak only English Native:
98.3% (14,668)Foreign-born:
63.1% (91)
White alone - Speak another language Native:
1.7% (258)Foreign-born:
37.6% (54)
Hispanic or Latino - Speak another language Native:
30.5% (187)Foreign-born:
100.0% (22)
Foreign-born residents in Tiffin 288 residents are foreign born
Marital status for residents in Tiffin Marital status - White (Caucasian) population 15 years and over
Males 47.8% Never married38.3% Now married1.5% Separated4.6% Widowed7.8% DivorcedFemales 34.1% Never married33.5% Now married2.0% Separated12.6% Widowed17.7% DivorcedWomen who gave birth in the past 12 months Now married:
40.4% (81)Unmarried:
59.6% (120)
Women who did not give birth in the past 12 months Now married:
31.2% (1,150)Unmarried:
68.8% (2,538)
Marital status - Black or African American population 15 years and over
Males 59.0% Never married36.3% Now married4.4% Separated0.0% Widowed0.2% DivorcedFemales 57.3% Never married21.6% Now married0.0% Separated2.4% Widowed18.8% DivorcedWomen who gave birth in the past 12 months Now married:
100.0% (23)Unmarried:
0.0% (0)
Women who did not give birth in the past 12 months Now married:
12.6% (20)Unmarried:
87.4% (142)
Marital status - Asian population 15 years and over
Males 23.1% Never married76.9% Now married0.0% Separated0.0% Widowed0.0% DivorcedFemales 25.0% Never married54.5% Now married0.0% Separated0.0% Widowed20.5% DivorcedWomen who did not give birth in the past 12 months Now married:
52.2% (24)Unmarried:
47.8% (22)
Marital status - Other race population 15 years and over
Males 2.1% Never married87.2% Now married0.0% Separated0.0% Widowed10.6% DivorcedFemales 82.1% Never married17.9% Now married0.0% Separated0.0% Widowed0.0% DivorcedWomen who gave birth in the past 12 months Now married:
100.0% (18)Unmarried:
0.0% (0)
Women who did not give birth in the past 12 months Now married:
0.0% (0)Unmarried:
100.0% (85)
Marital status - Two or more races population 15 years and over
Males 52.2% Never married27.3% Now married6.3% Separated0.0% Widowed14.1% DivorcedFemales 53.2% Never married19.0% Now married0.0% Separated0.0% Widowed27.8% DivorcedWomen who did not give birth in the past 12 months Now married:
26.3% (20)Unmarried:
73.7% (56)
Marital status - White alone, not Hispanic / Latino population 15 years and over
Males 47.1% Never married38.9% Now married1.6% Separated4.7% Widowed7.7% DivorcedFemales 33.6% Never married33.8% Now married2.0% Separated12.8% Widowed17.7% DivorcedWomen who gave birth in the past 12 months Now married:
40.4% (82)Unmarried:
59.6% (121)
Women who did not give birth in the past 12 months Now married:
31.6% (1,147)Unmarried:
68.4% (2,484)
Marital status - Hispanic or Latino population 15 years and over
Males 66.0% Never married25.1% Now married0.0% Separated0.0% Widowed8.9% DivorcedFemales 65.0% Never married18.5% Now married0.0% Separated0.0% Widowed16.5% DivorcedWomen who gave birth in the past 12 months Now married:
100.0% (15)Unmarried:
0.0% (0)
Women who did not give birth in the past 12 months Now married:
16.4% (33)Unmarried:
83.6% (168)
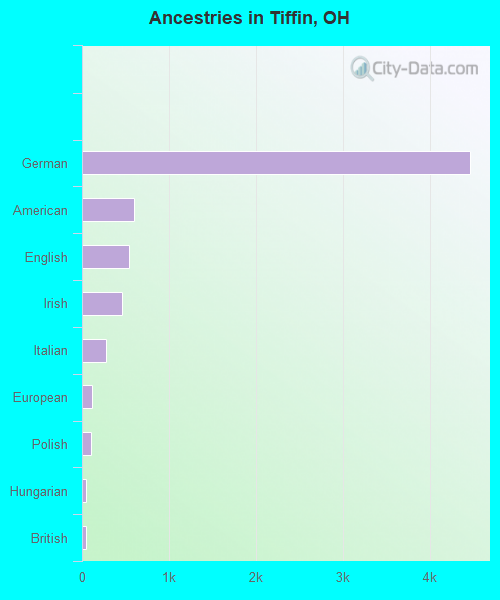
Ancestries in Tiffin
4,457 52.2% German600 7.0% American537 6.3% English456 5.3% Irish271 3.2% Italian115 1.3% European102 1.2% Polish51 0.6% Hungarian43 0.5% British39 0.5% Dutch27 0.3% Canadian26 0.3% Kenyan24 0.3% Austrian20 0.2% Greek20 0.2% Latvian20 0.2% Northern European19 0.2% French19 0.2% Swiss18 0.2% Norwegian16 0.2% Scotch-Irish14 0.2% Belgian13 0.2% Albanian13 0.2% Scottish12 0.1% Portuguese12 0.1% African10 0.1% Eastern European10 0.1% French Canadian10 0.1% Slovak9 0.1% Yugoslavian8 0.09% Swedish7 0.08% Danish7 0.08% Welsh6 0.07% Icelander1 0.01% Croatian
Geographical mobility in Tiffin Same house 1 year ago 13,089 83.0% White (Caucasian)509 70.2% Black or African American72 100.0% American Indian / Alaska Native153 88.5% Asian54 31.0% Other race554 84.4% Two or more races12,933 83.1% White alone, not Hispanic / Latino475 69.7% Hispanic or LatinoMoved within same county 1,245 7.9% White / Caucasian44 6.0% Black or African American26 15.1% Other race43 6.6% Two or more races1,205 7.7% White alone, not Hispanic / Latino72 10.6% Hispanic or LatinoMoved within same state 1,156 7.3% White / Caucasian74 10.3% Black or African American75 43.3% Other race34 5.2% Two or more races1,152 7.4% White alone, not Hispanic / Latino59 8.7% Hispanic or LatinoMoved from different state 175 1.1% White / Caucasian93 12.8% Black or African American32 18.4% Other race22 3.3% Two or more races149 1.0% White alone, not Hispanic / Latino70 10.3% Hispanic or LatinoMoved from abroad 61 0.4% White39 5.4% Black or African American23 13.5% Asian2 1.3% Other race68 0.4% White alone, not Hispanic / Latino2 0.2% Hispanic or Latino
Children Nativity (place of birth) in Tiffin
Children under 6 years - Living with two parents Both parents native 552 100.0% NativeOne native, one foreign-born parent 3 100.0% NativeChildren under 6 years - Living with one parent Native parent 271 100.0% Native
Children 6 to 17 years - Living with two parents Both parents native 1,205 100.0% NativeOne native, one foreign-born parent 16 100.0% NativeChildren 6 to 17 years - Living with one parent Native parent 1,049 100.0% Native
Grandparents responsible for own grandchildren in Tiffin
Grandparents (30 to 59 years) White / Caucasian 48 44.5% Responsible for grandchildren60 55.5% Not responsible for grandchildrenWhite alone, not Hispanic / Latino 48 43.9% Responsible for grandchildren61 56.1% Not responsible for grandchildrenGrandparents (60 years and over) White / Caucasian 53 47.7% Responsible for grandchildren58 52.3% Not responsible for grandchildrenWhite alone, not Hispanic / Latino 53 47.5% Responsible for grandchildren59 52.5% Not responsible for grandchildren