Races in Three Lakes, Florida (FL) Detailed Stats
Data:
Races - White alone (%)
Races - White alone (% change since 2000)
Races - Black alone (%)
Races - Black alone (% change since 2000)
Races - American Indian alone (%)
Races - American Indian alone (% change since 2000)
Races - Asian alone (%)
Races - Asian alone (% change since 2000)
Races - Hispanic (%)
Races - Hispanic (% change since 2000)
Races - Native Hawaiian and Other Pacific Islander alone (%)
Races - Native Hawaiian and Other Pacific Islander alone (% change since 2000)
Races - Two or more races(%)
Races - Two or more races(% change since 2000)
Races - Other race alone (%)
Races - Other race alone (% change since 2000)
Racial diversity
Place of birth - Born in state of residence (%)
Place of birth - Born in state of residence (%) - White
Place of birth - Born in state of residence (%) - Black or African American
Place of birth - Born in state of residence (%) - Asian
Place of birth - Born in state of residence (%) - Hispanic or Latino
Place of birth - Born in state of residence (%) - American Indian and Alaska Native
Place of birth - Born in state of residence (%) - Multirace
Place of birth - Born in state of residence (%) - Other Race
Place of birth - Born in other state (%)
Place of birth - Born in other state (%) - White
Place of birth - Born in other state (%) - Black or African American
Place of birth - Born in other state (%) - Asian
Place of birth - Born in other state (%) - Hispanic or Latino
Place of birth - Born in other state (%) - American Indian and Alaska Native
Place of birth - Born in other state (%) - Multirace
Place of birth - Born in other state (%) - Other Race
Place of birth - Native, outside of US (%)
Place of birth - Native, outside of US (%) - White
Place of birth - Native, outside of US (%) - Black or African American
Place of birth - Native, outside of US (%) - Asian
Place of birth - Native, outside of US (%) - Hispanic or Latino
Place of birth - Native, outside of US (%) - American Indian and Alaska Native
Place of birth - Native, outside of US (%) - Multirace
Place of birth - Native, outside of US (%) - Other Race
Place of birth - Foreign born (%)
Place of birth - Foreign born (%) - White
Place of birth - Foreign born (%) - Black or African American
Place of birth - Foreign born (%) - Asian
Place of birth - Foreign born (%) - Hispanic or Latino
Place of birth - Foreign born (%) - American Indian and Alaska Native
Place of birth - Foreign born (%) - Multirace
Place of birth - Foreign born (%) - Other Race
Residents speaking English at home (%)
Residents speaking English at home - Born in the United States (%)
Residents speaking English at home - Native, born elsewhere (%)
Residents speaking English at home - Foreign born (%)
Residents speaking Spanish at home (%)
Residents speaking Spanish at home - Born in the United States (%)
Residents speaking Spanish at home - Native, born elsewhere (%)
Residents speaking Spanish at home - Foreign born (%)
Residents speaking other language at home (%)
Residents speaking other language at home - Born in the United States (%)
Residents speaking other language at home - Native, born elsewhere (%)
Residents speaking other language at home - Foreign born (%)
Marital status - Never married (%)
Marital status - Now married (%)
Marital status - Separated (%)
Marital status - Widowed (%)
Marital status - Divorced (%)
Ancestries Reported - Arab (%)
Ancestries Reported - Czech (%)
Ancestries Reported - Danish (%)
Ancestries Reported - Dutch (%)
Ancestries Reported - English (%)
Ancestries Reported - French (%)
Ancestries Reported - French Canadian (%)
Ancestries Reported - German (%)
Ancestries Reported - Greek (%)
Ancestries Reported - Hungarian (%)
Ancestries Reported - Irish (%)
Ancestries Reported - Italian (%)
Ancestries Reported - Lithuanian (%)
Ancestries Reported - Norwegian (%)
Ancestries Reported - Polish (%)
Ancestries Reported - Portuguese (%)
Ancestries Reported - Russian (%)
Ancestries Reported - Scotch-Irish (%)
Ancestries Reported - Scottish (%)
Ancestries Reported - Slovak (%)
Ancestries Reported - Subsaharan African (%)
Ancestries Reported - Swedish (%)
Ancestries Reported - Swiss (%)
Ancestries Reported - Ukrainian (%)
Ancestries Reported - United States (%)
Ancestries Reported - Welsh (%)
Ancestries Reported - West Indian (%)
Ancestries Reported - Other (%)
Geographical mobility - Same house 1 year ago (%)
Geographical mobility - Same house 1 year ago (%) - White
Geographical mobility - Same house 1 year ago (%) - Black or African American
Geographical mobility - Same house 1 year ago (%) - Asian
Geographical mobility - Same house 1 year ago (%) - Hispanic or Latino
Geographical mobility - Same house 1 year ago (%) - American Indian and Alaska Native
Geographical mobility - Same house 1 year ago (%) - Multirace
Geographical mobility - Same house 1 year ago (%) - Other Race
Geographical mobility - Moved within same county (%)
Geographical mobility - Moved within same county (%) - White
Geographical mobility - Moved within same county (%) - Black or African American
Geographical mobility - Moved within same county (%) - Asian
Geographical mobility - Moved within same county (%) - Hispanic or Latino
Geographical mobility - Moved within same county (%) - American Indian and Alaska Native
Geographical mobility - Moved within same county (%) - Multirace
Geographical mobility - Moved within same county (%) - Other Race
Geographical mobility - Moved from different county within same state (%)
Geographical mobility - Moved from different county within same state (%) - White
Geographical mobility - Moved from different county within same state (%) - Black or African American
Geographical mobility - Moved from different county within same state (%) - Asian
Geographical mobility - Moved from different county within same state (%) - Hispanic or Latino
Geographical mobility - Moved from different county within same state (%) - American Indian and Alaska Native
Geographical mobility - Moved from different county within same state (%) - Multirace
Geographical mobility - Moved from different county within same state (%) - Other Race
Geographical mobility - Moved from different state (%)
Geographical mobility - Moved from different state (%) - White
Geographical mobility - Moved from different state (%) - Black or African American
Geographical mobility - Moved from different state (%) - Asian
Geographical mobility - Moved from different state (%) - Hispanic or Latino
Geographical mobility - Moved from different state (%) - American Indian and Alaska Native
Geographical mobility - Moved from different state (%) - Multirace
Geographical mobility - Moved from different state (%) - Other Race
Geographical mobility - Moved from abroad (%)
Geographical mobility - Moved from abroad (%) - White
Geographical mobility - Moved from abroad (%) - Black or African American
Geographical mobility - Moved from abroad (%) - Asian
Geographical mobility - Moved from abroad (%) - Hispanic or Latino
Geographical mobility - Moved from abroad (%) - American Indian and Alaska Native
Geographical mobility - Moved from abroad (%) - Multirace
Geographical mobility - Moved from abroad (%) - Other Race
Place of birth for the foreign-born population - Ireland (%)
Place of birth for the foreign-born population - Denmark (%)
Place of birth for the foreign-born population - Norway (%)
Place of birth for the foreign-born population - Sweden (%)
Place of birth for the foreign-born population - United Kingdom (%)
Place of birth for the foreign-born population - England (%)
Place of birth for the foreign-born population - Scotland (%)
Place of birth for the foreign-born population - Other Northern Europe (%)
Place of birth for the foreign-born population - Austria (%)
Place of birth for the foreign-born population - Belgium (%)
Place of birth for the foreign-born population - France (%)
Place of birth for the foreign-born population - Germany (%)
Place of birth for the foreign-born population - Netherlands (%)
Place of birth for the foreign-born population - Switzerland (%)
Place of birth for the foreign-born population - Other Western Europe (%)
Place of birth for the foreign-born population - Greece (%)
Place of birth for the foreign-born population - Italy (%)
Place of birth for the foreign-born population - Portugal (%)
Place of birth for the foreign-born population - Spain (%)
Place of birth for the foreign-born population - Other Southern Europe (%)
Place of birth for the foreign-born population - Albania (%)
Place of birth for the foreign-born population - Belarus (%)
Place of birth for the foreign-born population - Bosnia and Herzegovina (%)
Place of birth for the foreign-born population - Bulgaria (%)
Place of birth for the foreign-born population - Croatia (%)
Place of birth for the foreign-born population - Czechoslovakia (%)
Place of birth for the foreign-born population - Hungary (%)
Place of birth for the foreign-born population - Latvia (%)
Place of birth for the foreign-born population - Lithuania (%)
Place of birth for the foreign-born population - North Macedonia (Macedonia) (%)
Place of birth for the foreign-born population - Moldova (%)
Place of birth for the foreign-born population - Poland (%)
Place of birth for the foreign-born population - Romania (%)
Place of birth for the foreign-born population - Russia (%)
Place of birth for the foreign-born population - Serbia (%)
Place of birth for the foreign-born population - Ukraine (%)
Place of birth for the foreign-born population - Other Eastern Europe (%)
Place of birth for the foreign-born population - China (%)
Place of birth for the foreign-born population - Hong Kong (%)
Place of birth for the foreign-born population - Taiwan (%)
Place of birth for the foreign-born population - Japan (%)
Place of birth for the foreign-born population - Korea (%)
Place of birth for the foreign-born population - Other Eastern Asia (%)
Place of birth for the foreign-born population - Afghanistan (%)
Place of birth for the foreign-born population - Bangladesh (%)
Place of birth for the foreign-born population - India (%)
Place of birth for the foreign-born population - Iran (%)
Place of birth for the foreign-born population - Kazakhstan (%)
Place of birth for the foreign-born population - Nepal (%)
Place of birth for the foreign-born population - Pakistan (%)
Place of birth for the foreign-born population - Sri Lanka (%)
Place of birth for the foreign-born population - Uzbekistan (%)
Place of birth for the foreign-born population - Other South Central Asia (%)
Place of birth for the foreign-born population - Burma (%)
Place of birth for the foreign-born population - Cambodia (%)
Place of birth for the foreign-born population - Indonesia (%)
Place of birth for the foreign-born population - Laos (%)
Place of birth for the foreign-born population - Malaysia (%)
Place of birth for the foreign-born population - Philippines (%)
Place of birth for the foreign-born population - Singapore (%)
Place of birth for the foreign-born population - Thailand (%)
Place of birth for the foreign-born population - Vietnam (%)
Place of birth for the foreign-born population - Other South Eastern Asia (%)
Place of birth for the foreign-born population - Armenia (%)
Place of birth for the foreign-born population - Iraq (%)
Place of birth for the foreign-born population - Israel (%)
Place of birth for the foreign-born population - Jordan (%)
Place of birth for the foreign-born population - Kuwait (%)
Place of birth for the foreign-born population - Lebanon (%)
Place of birth for the foreign-born population - Saudi Arabia (%)
Place of birth for the foreign-born population - Syria (%)
Place of birth for the foreign-born population - Turkey (%)
Place of birth for the foreign-born population - Yemen (%)
Place of birth for the foreign-born population - Other Western Asia (%)
Place of birth for the foreign-born population - Eritrea (%)
Place of birth for the foreign-born population - Ethiopia (%)
Place of birth for the foreign-born population - Kenya (%)
Place of birth for the foreign-born population - Somalia (%)
Place of birth for the foreign-born population - Uganda (%)
Place of birth for the foreign-born population - Zimbabwe (%)
Place of birth for the foreign-born population - Other Eastern Africa (%)
Place of birth for the foreign-born population - Cameroon (%)
Place of birth for the foreign-born population - Congo (%)
Place of birth for the foreign-born population - Democratic Republic of Congo (Zaire) (%)
Place of birth for the foreign-born population - Other Middle Africa (%)
Place of birth for the foreign-born population - Egypt (%)
Place of birth for the foreign-born population - Morocco (%)
Place of birth for the foreign-born population - Sudan (%)
Place of birth for the foreign-born population - Other Northern Africa (%)
Place of birth for the foreign-born population - South Africa (%)
Place of birth for the foreign-born population - Other Southern Africa (%)
Place of birth for the foreign-born population - Cabo Verde (%)
Place of birth for the foreign-born population - Ghana (%)
Place of birth for the foreign-born population - Liberia (%)
Place of birth for the foreign-born population - Nigeria (%)
Place of birth for the foreign-born population - Senegal (%)
Place of birth for the foreign-born population - Sierra Leone (%)
Place of birth for the foreign-born population - Other Western Africa (%)
Place of birth for the foreign-born population - Australia (%)
Place of birth for the foreign-born population - New Zealand (%)
Place of birth for the foreign-born population - Fiji (%)
Place of birth for the foreign-born population - Micronesia (%)
Place of birth for the foreign-born population - Bahamas (%)
Place of birth for the foreign-born population - Barbados (%)
Place of birth for the foreign-born population - Cuba (%)
Place of birth for the foreign-born population - Dominica (%)
Place of birth for the foreign-born population - Dominican Republic (%)
Place of birth for the foreign-born population - Grenada (%)
Place of birth for the foreign-born population - Haiti (%)
Place of birth for the foreign-born population - Jamaica (%)
Place of birth for the foreign-born population - St. Vincent and the Grenadines (%)
Place of birth for the foreign-born population - Trinidad and Tobago (%)
Place of birth for the foreign-born population - West Indies (%)
Place of birth for the foreign-born population - Other Caribbean (%)
Place of birth for the foreign-born population - Belize (%)
Place of birth for the foreign-born population - Costa Rica (%)
Place of birth for the foreign-born population - El Salvador (%)
Place of birth for the foreign-born population - Guatemala (%)
Place of birth for the foreign-born population - Honduras (%)
Place of birth for the foreign-born population - Mexico (%)
Place of birth for the foreign-born population - Nicaragua (%)
Place of birth for the foreign-born population - Panama (%)
Place of birth for the foreign-born population - Other Central America (%)
Place of birth for the foreign-born population - Argentina (%)
Place of birth for the foreign-born population - Bolivia (%)
Place of birth for the foreign-born population - Brazil (%)
Place of birth for the foreign-born population - Chile (%)
Place of birth for the foreign-born population - Colombia (%)
Place of birth for the foreign-born population - Ecuador (%)
Place of birth for the foreign-born population - Guyana (%)
Place of birth for the foreign-born population - Peru (%)
Place of birth for the foreign-born population - Uruguay (%)
Place of birth for the foreign-born population - Venezuela (%)
Place of birth for the foreign-born population - Other South America (%)
Place of birth for the foreign-born population - Canada (%)
Place of birth for the foreign-born population - Other Northern America (%)
Place of birth for the foreign-born population - Other (%)
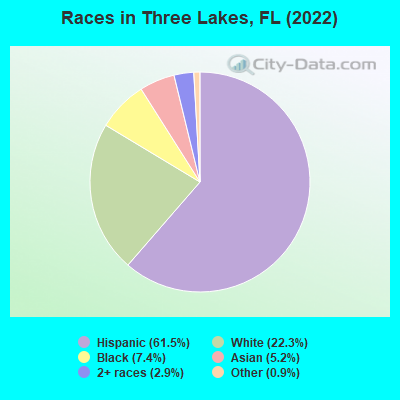
According to 2022 data, the most numerous races in Three Lakes, FL are White alone (3,678 residents), Hispanic (10,154 residents), and Black alone (1,229 residents). 26.1% of Three Lakes residents speak English at home. 47.1% of Three Lakes, FL residents are foreign-born (41.0% born in Latin America), which is 55.4% greater than the foreign-born rate of 21.0% across the entire state of Florida.
Race distribution in Three Lakes
2000 2022
10,458,509 65.4% White alone 2,682,715 16.8% Hispanic 2,264,268 14.2% Black alone 261,693 1.6% Asian alone 236,954 1.5% Two or more races 42,358 0.3% American Indian alone 28,994 0.2% Other race alone 6,887 0.04% Native Hawaiian and Other
11,309,403 50.8% White alone 6,025,039 27.1% Hispanic 3,241,015 14.6% Black alone 861,630 3.9% Two or more races 623,692 2.8% Asian alone 152,054 0.7% Other race alone 22,504 0.1% American Indian alone 9,486 0.04% Native Hawaiian and Other
Income and house value in Three Lakes Median household income in 2022 $80,687 White non-Hispanic householders$72,926 Black householders$176,764 Asian householders$85,808 Some other race householders$85,841 Two or more races householders$90,012 Hispanic or Latino race householdersMedian 2022 house value $519,181 White Non-Hispanic householders$488,906 Black or African American householders $594,461 Asian householders$390,715 Some other race householders$438,992 Two or more races householders$478,678 Hispanic or Latino householders
Median age by race in Three Lakes
32.5 Median age for White residents34.7 30.2 37.6 Median age for Black or African American residents36.3 40.3 -653,446,647.1 Median age for American Indian / Alaska Native residents-543,352,600.6 -762,696,213.5 33.7 Median age for Asian residents34.2 36.6 -679,849,340.2 Median age for Native Hawaiian / Pacific Islander residents-858,307,848.3 -443,298,968.6 30.6 Median age for Other race residents30.8 30.4 39.1 Median age for Two or more races residents37.1 41.4 29.2 Median age for White alone residents28.4 29.6 38.8 Median age for Hispanic or Latino residents37.9 39.5
Owner/renter occupied households by race in Three Lakes
House owners and renters - White residents 1,089 70.0% Owner occupied467 30.0% Renter occupiedHouse owners and renters - Black or African American residents 248 55.9% Owner occupied196 44.1% Renter occupiedHouse owners and renters - American Indian / Alaska Native residents 3 100.0% Owner occupiedHouse owners and renters - Asian residents 163 62.9% Owner occupied96 37.1% Renter occupiedHouse owners and renters - Other race residents 372 70.3% Owner occupied157 29.7% Renter occupiedHouse owners and renters - Two or more races residents 1,307 52.7% Owner occupied1,174 47.3% Renter occupiedHouse owners and renters - White alone residents 919 79.7% Owner occupied234 20.3% Renter occupiedHouse owners and renters - Hispanic or Latino residents 1,846 56.2% Owner occupied1,439 43.8% Renter occupied
Language usage in Three Lakes
English speakers - Total 26.1% of residents of Three Lakes speak English at home.
62.5% of residents speak Spanish at home 6,395 67.4% Speak English very well3,095 32.6% Speak English less than very well11.0% of residents speak other language at home 1,085 64.7% Speak English very well591 35.3% Speak English less than very well
English speakers - Born in the United States 51.4% of residents of Three Lakes speak English at home.
39.0% of residents speak Spanish at home 615 83.4% Speak English very well122 16.6% Speak English less than very well9.4% of residents speak other language at home 178 100.0% Speak English very well
English speakers - Native, born elsewhere 33.2% of residents of Three Lakes speak English at home.
66.8% of residents speak Spanish at home 163 81.9% Speak English very well36 18.1% Speak English less than very well
English speakers - Foreign-born 7.9% of residents of Three Lakes speak English at home.
75.2% of residents speak Spanish at home 2,943 52.0% Speak English very well2,722 48.0% Speak English less than very well16.2% of residents speak other language at home 773 63.2% Speak English very well450 36.8% Speak English less than very well
White (Caucasian) - Speak only English Native:
65.9% (2,080)Foreign-born:
9.6% (123)
White (Caucasian) - Speak another language Native:
37.9% (1,197)Foreign-born:
90.4% (1,157)
Black or African American - Speak only English Native:
64.0% (564)Foreign-born:
24.8% (100)
Black or African American - Speak another language Native:
36.0% (318)Foreign-born:
74.8% (299)
American Indian / Alaska Native - Speak another language Native:
100.0% (1)Foreign-born:
98.3% (5)
Asian - Speak only English Native:
100.0% (105)Foreign-born:
16.1% (108)
Other race - Speak only English Native:
20.4% (228)Foreign-born:
4.2% (35)
Other race - Speak another language Native:
79.6% (889)Foreign-born:
95.9% (802)
Two or more races - Speak only English Native:
16.6% (412)Foreign-born:
5.4% (247)
Two or more races - Speak another language Native:
83.4% (2,069)Foreign-born:
94.7% (4,346)
White alone - Speak only English Native:
65.8% (1,770)Foreign-born:
32.7% (192)
White alone - Speak another language Native:
33.6% (904)Foreign-born:
68.9% (404)
Hispanic or Latino - Speak only English Native:
19.7% (739)Foreign-born:
1.7% (98)
Hispanic or Latino - Speak another language Native:
80.4% (3,010)Foreign-born:
98.1% (5,535)
Foreign-born residents in Three Lakes 7,777 residents are foreign born (41.0% Latin America ).
This city:
47.1%Florida:
21.1%
Marital status for residents in Three Lakes Marital status - White (Caucasian) population 15 years and over
Males 37.2% Never married54.6% Now married2.6% Separated0.0% Widowed5.6% DivorcedFemales 35.7% Never married44.1% Now married2.6% Separated6.4% Widowed11.2% DivorcedWomen who gave birth in the past 12 months Now married:
100.0% (24)Unmarried:
0.0% (0)
Women who did not give birth in the past 12 months Now married:
43.8% (451)Unmarried:
56.2% (578)
Marital status - Black or African American population 15 years and over
Males 64.1% Never married29.5% Now married3.7% Separated0.0% Widowed2.8% DivorcedFemales 39.5% Never married43.5% Now married4.2% Separated2.1% Widowed10.7% DivorcedWomen who gave birth in the past 12 months Now married:
100.0% (13)Unmarried:
0.0% (0)
Women who did not give birth in the past 12 months Now married:
32.8% (91)Unmarried:
67.2% (187)
Marital status - American Indian / Alaska Native population 15 years and over
Males 0.0% Never married100.0% Now married0.0% Separated0.0% Widowed0.0% DivorcedFemales 0.0% Never married100.0% Now married0.0% Separated0.0% Widowed0.0% DivorcedWomen who did not give birth in the past 12 months Now married:
100.0% (5)Unmarried:
0.0% (0)
Marital status - Asian population 15 years and over
Males 13.2% Never married70.0% Now married0.0% Separated0.0% Widowed16.8% DivorcedFemales 20.5% Never married62.8% Now married0.0% Separated5.4% Widowed11.3% DivorcedWomen who gave birth in the past 12 months Now married:
100.0% (18)Unmarried:
0.0% (0)
Women who did not give birth in the past 12 months Now married:
48.0% (102)Unmarried:
52.0% (111)
Marital status - Other race population 15 years and over
Males 50.0% Never married40.4% Now married7.0% Separated0.0% Widowed2.6% DivorcedFemales 25.7% Never married45.5% Now married11.1% Separated3.3% Widowed14.4% DivorcedWomen who gave birth in the past 12 months Now married:
0.0% (0)Unmarried:
100.0% (22)
Women who did not give birth in the past 12 months Now married:
46.4% (209)Unmarried:
53.6% (241)
Marital status - Two or more races population 15 years and over
Males 38.5% Never married51.5% Now married2.8% Separated2.2% Widowed5.1% DivorcedFemales 38.1% Never married43.2% Now married2.7% Separated6.0% Widowed10.1% DivorcedWomen who gave birth in the past 12 months Now married:
72.6% (135)Unmarried:
27.4% (51)
Women who did not give birth in the past 12 months Now married:
35.2% (631)Unmarried:
64.8% (1,161)
Marital status - White alone, not Hispanic / Latino population 15 years and over
Males 42.0% Never married51.1% Now married0.4% Separated0.0% Widowed6.5% DivorcedFemales 38.7% Never married47.0% Now married0.0% Separated5.6% Widowed8.7% DivorcedWomen who gave birth in the past 12 months Now married:
100.0% (9)Unmarried:
0.0% (0)
Women who did not give birth in the past 12 months Now married:
45.4% (325)Unmarried:
54.6% (392)
Marital status - Hispanic or Latino population 15 years and over
Males 38.6% Never married51.5% Now married4.2% Separated1.0% Widowed4.8% DivorcedFemales 35.0% Never married42.5% Now married4.5% Separated6.2% Widowed11.8% DivorcedWomen who gave birth in the past 12 months Now married:
77.1% (105)Unmarried:
22.9% (31)
Women who did not give birth in the past 12 months Now married:
40.3% (1,005)Unmarried:
59.7% (1,490)
Ancestries in Three Lakes
1,153 10.4% American320 2.9% Italian212 1.9% Haitian189 1.7% Brazilian151 1.4% German123 1.1% African76 0.7% Jamaican69 0.6% West Indian68 0.6% Irish58 0.5% French57 0.5% Turkish56 0.5% Lebanese52 0.5% Trinidadian and Tobagonian42 0.4% Polish33 0.3% Bahamian20 0.2% British19 0.2% Palestinian16 0.1% English16 0.1% European9 0.08% Austrian7 0.06% Arab7 0.06% Iranian6 0.05% Hungarian5 0.04% Syrian3 0.03% Dutch
Geographical mobility in Three Lakes Same house 1 year ago 4,177 91.2% White (Caucasian)1,236 96.4% Black or African American6 100.0% American Indian / Alaska Native845 98.1% Asian1,906 95.8% Other race6,991 93.9% Two or more races3,317 93.9% White alone, not Hispanic / Latino9,387 93.2% Hispanic or LatinoMoved within same county 240 5.2% White / Caucasian30 2.3% Black or African American41 4.8% Asian14 0.7% Other race331 4.4% Two or more races105 3.0% White alone, not Hispanic / Latino430 4.3% Hispanic or LatinoMoved within same state 8 0.2% White / Caucasian13 1.0% Black or African American13 0.1% Hispanic or LatinoMoved from different state 84 1.8% White / Caucasian28 1.4% Other race44 0.6% Two or more races40 1.1% White alone, not Hispanic / Latino108 1.1% Hispanic or LatinoMoved from abroad 25 0.6% White108 5.4% Other race29 0.4% Two or more races28 0.8% White alone, not Hispanic / Latino109 1.1% Hispanic or Latino
Children Nativity (place of birth) in Three Lakes
Children under 6 years - Living with two parents Both parents native 245 100.0% NativeBoth parents foreign-born 381 75.9% Native121 24.1% Foreign-bornOne native, one foreign-born parent 167 100.0% NativeChildren under 6 years - Living with one parent Native parent 170 95.8% Native7 4.2% Foreign-bornForeign-born parent 254 61.2% Native161 38.8% Foreign-bornChildren 6 to 17 years - Living with two parents Both parents native 467 100.0% NativeBoth parents foreign-born 439 67.0% Native216 33.0% Foreign-bornOne native, one foreign-born parent 510 89.2% Native61 10.8% Foreign-bornChildren 6 to 17 years - Living with one parent Native parent 230 100.0% NativeForeign-born parent 406 54.9% Native334 45.1% Foreign-born
Grandparents responsible for own grandchildren in Three Lakes
Grandparents (30 to 59 years) Asian 107 100.0% Not responsible for grandchildrenOther race 146 100.0% Not responsible for grandchildrenTwo or more races 58 100.0% Not responsible for grandchildrenHispanic or Latino 121 100.0% Not responsible for grandchildren
Grandparents (60 years and over) Two or more races 97 100.0% Not responsible for grandchildrenHispanic or Latino 87 100.0% Not responsible for grandchildren