Races in Thonotosassa, Florida (FL) Detailed Stats
Data:
Races - White alone (%)
Races - White alone (% change since 2000)
Races - Black alone (%)
Races - Black alone (% change since 2000)
Races - American Indian alone (%)
Races - American Indian alone (% change since 2000)
Races - Asian alone (%)
Races - Asian alone (% change since 2000)
Races - Hispanic (%)
Races - Hispanic (% change since 2000)
Races - Native Hawaiian and Other Pacific Islander alone (%)
Races - Native Hawaiian and Other Pacific Islander alone (% change since 2000)
Races - Two or more races(%)
Races - Two or more races(% change since 2000)
Races - Other race alone (%)
Races - Other race alone (% change since 2000)
Racial diversity
Place of birth - Born in state of residence (%)
Place of birth - Born in state of residence (%) - White
Place of birth - Born in state of residence (%) - Black or African American
Place of birth - Born in state of residence (%) - Asian
Place of birth - Born in state of residence (%) - Hispanic or Latino
Place of birth - Born in state of residence (%) - American Indian and Alaska Native
Place of birth - Born in state of residence (%) - Multirace
Place of birth - Born in state of residence (%) - Other Race
Place of birth - Born in other state (%)
Place of birth - Born in other state (%) - White
Place of birth - Born in other state (%) - Black or African American
Place of birth - Born in other state (%) - Asian
Place of birth - Born in other state (%) - Hispanic or Latino
Place of birth - Born in other state (%) - American Indian and Alaska Native
Place of birth - Born in other state (%) - Multirace
Place of birth - Born in other state (%) - Other Race
Place of birth - Native, outside of US (%)
Place of birth - Native, outside of US (%) - White
Place of birth - Native, outside of US (%) - Black or African American
Place of birth - Native, outside of US (%) - Asian
Place of birth - Native, outside of US (%) - Hispanic or Latino
Place of birth - Native, outside of US (%) - American Indian and Alaska Native
Place of birth - Native, outside of US (%) - Multirace
Place of birth - Native, outside of US (%) - Other Race
Place of birth - Foreign born (%)
Place of birth - Foreign born (%) - White
Place of birth - Foreign born (%) - Black or African American
Place of birth - Foreign born (%) - Asian
Place of birth - Foreign born (%) - Hispanic or Latino
Place of birth - Foreign born (%) - American Indian and Alaska Native
Place of birth - Foreign born (%) - Multirace
Place of birth - Foreign born (%) - Other Race
Residents speaking English at home (%)
Residents speaking English at home - Born in the United States (%)
Residents speaking English at home - Native, born elsewhere (%)
Residents speaking English at home - Foreign born (%)
Residents speaking Spanish at home (%)
Residents speaking Spanish at home - Born in the United States (%)
Residents speaking Spanish at home - Native, born elsewhere (%)
Residents speaking Spanish at home - Foreign born (%)
Residents speaking other language at home (%)
Residents speaking other language at home - Born in the United States (%)
Residents speaking other language at home - Native, born elsewhere (%)
Residents speaking other language at home - Foreign born (%)
Marital status - Never married (%)
Marital status - Now married (%)
Marital status - Separated (%)
Marital status - Widowed (%)
Marital status - Divorced (%)
Ancestries Reported - Arab (%)
Ancestries Reported - Czech (%)
Ancestries Reported - Danish (%)
Ancestries Reported - Dutch (%)
Ancestries Reported - English (%)
Ancestries Reported - French (%)
Ancestries Reported - French Canadian (%)
Ancestries Reported - German (%)
Ancestries Reported - Greek (%)
Ancestries Reported - Hungarian (%)
Ancestries Reported - Irish (%)
Ancestries Reported - Italian (%)
Ancestries Reported - Lithuanian (%)
Ancestries Reported - Norwegian (%)
Ancestries Reported - Polish (%)
Ancestries Reported - Portuguese (%)
Ancestries Reported - Russian (%)
Ancestries Reported - Scotch-Irish (%)
Ancestries Reported - Scottish (%)
Ancestries Reported - Slovak (%)
Ancestries Reported - Subsaharan African (%)
Ancestries Reported - Swedish (%)
Ancestries Reported - Swiss (%)
Ancestries Reported - Ukrainian (%)
Ancestries Reported - United States (%)
Ancestries Reported - Welsh (%)
Ancestries Reported - West Indian (%)
Ancestries Reported - Other (%)
Geographical mobility - Same house 1 year ago (%)
Geographical mobility - Same house 1 year ago (%) - White
Geographical mobility - Same house 1 year ago (%) - Black or African American
Geographical mobility - Same house 1 year ago (%) - Asian
Geographical mobility - Same house 1 year ago (%) - Hispanic or Latino
Geographical mobility - Same house 1 year ago (%) - American Indian and Alaska Native
Geographical mobility - Same house 1 year ago (%) - Multirace
Geographical mobility - Same house 1 year ago (%) - Other Race
Geographical mobility - Moved within same county (%)
Geographical mobility - Moved within same county (%) - White
Geographical mobility - Moved within same county (%) - Black or African American
Geographical mobility - Moved within same county (%) - Asian
Geographical mobility - Moved within same county (%) - Hispanic or Latino
Geographical mobility - Moved within same county (%) - American Indian and Alaska Native
Geographical mobility - Moved within same county (%) - Multirace
Geographical mobility - Moved within same county (%) - Other Race
Geographical mobility - Moved from different county within same state (%)
Geographical mobility - Moved from different county within same state (%) - White
Geographical mobility - Moved from different county within same state (%) - Black or African American
Geographical mobility - Moved from different county within same state (%) - Asian
Geographical mobility - Moved from different county within same state (%) - Hispanic or Latino
Geographical mobility - Moved from different county within same state (%) - American Indian and Alaska Native
Geographical mobility - Moved from different county within same state (%) - Multirace
Geographical mobility - Moved from different county within same state (%) - Other Race
Geographical mobility - Moved from different state (%)
Geographical mobility - Moved from different state (%) - White
Geographical mobility - Moved from different state (%) - Black or African American
Geographical mobility - Moved from different state (%) - Asian
Geographical mobility - Moved from different state (%) - Hispanic or Latino
Geographical mobility - Moved from different state (%) - American Indian and Alaska Native
Geographical mobility - Moved from different state (%) - Multirace
Geographical mobility - Moved from different state (%) - Other Race
Geographical mobility - Moved from abroad (%)
Geographical mobility - Moved from abroad (%) - White
Geographical mobility - Moved from abroad (%) - Black or African American
Geographical mobility - Moved from abroad (%) - Asian
Geographical mobility - Moved from abroad (%) - Hispanic or Latino
Geographical mobility - Moved from abroad (%) - American Indian and Alaska Native
Geographical mobility - Moved from abroad (%) - Multirace
Geographical mobility - Moved from abroad (%) - Other Race
Place of birth for the foreign-born population - Ireland (%)
Place of birth for the foreign-born population - Denmark (%)
Place of birth for the foreign-born population - Norway (%)
Place of birth for the foreign-born population - Sweden (%)
Place of birth for the foreign-born population - United Kingdom (%)
Place of birth for the foreign-born population - England (%)
Place of birth for the foreign-born population - Scotland (%)
Place of birth for the foreign-born population - Other Northern Europe (%)
Place of birth for the foreign-born population - Austria (%)
Place of birth for the foreign-born population - Belgium (%)
Place of birth for the foreign-born population - France (%)
Place of birth for the foreign-born population - Germany (%)
Place of birth for the foreign-born population - Netherlands (%)
Place of birth for the foreign-born population - Switzerland (%)
Place of birth for the foreign-born population - Other Western Europe (%)
Place of birth for the foreign-born population - Greece (%)
Place of birth for the foreign-born population - Italy (%)
Place of birth for the foreign-born population - Portugal (%)
Place of birth for the foreign-born population - Spain (%)
Place of birth for the foreign-born population - Other Southern Europe (%)
Place of birth for the foreign-born population - Albania (%)
Place of birth for the foreign-born population - Belarus (%)
Place of birth for the foreign-born population - Bosnia and Herzegovina (%)
Place of birth for the foreign-born population - Bulgaria (%)
Place of birth for the foreign-born population - Croatia (%)
Place of birth for the foreign-born population - Czechoslovakia (%)
Place of birth for the foreign-born population - Hungary (%)
Place of birth for the foreign-born population - Latvia (%)
Place of birth for the foreign-born population - Lithuania (%)
Place of birth for the foreign-born population - North Macedonia (Macedonia) (%)
Place of birth for the foreign-born population - Moldova (%)
Place of birth for the foreign-born population - Poland (%)
Place of birth for the foreign-born population - Romania (%)
Place of birth for the foreign-born population - Russia (%)
Place of birth for the foreign-born population - Serbia (%)
Place of birth for the foreign-born population - Ukraine (%)
Place of birth for the foreign-born population - Other Eastern Europe (%)
Place of birth for the foreign-born population - China (%)
Place of birth for the foreign-born population - Hong Kong (%)
Place of birth for the foreign-born population - Taiwan (%)
Place of birth for the foreign-born population - Japan (%)
Place of birth for the foreign-born population - Korea (%)
Place of birth for the foreign-born population - Other Eastern Asia (%)
Place of birth for the foreign-born population - Afghanistan (%)
Place of birth for the foreign-born population - Bangladesh (%)
Place of birth for the foreign-born population - India (%)
Place of birth for the foreign-born population - Iran (%)
Place of birth for the foreign-born population - Kazakhstan (%)
Place of birth for the foreign-born population - Nepal (%)
Place of birth for the foreign-born population - Pakistan (%)
Place of birth for the foreign-born population - Sri Lanka (%)
Place of birth for the foreign-born population - Uzbekistan (%)
Place of birth for the foreign-born population - Other South Central Asia (%)
Place of birth for the foreign-born population - Burma (%)
Place of birth for the foreign-born population - Cambodia (%)
Place of birth for the foreign-born population - Indonesia (%)
Place of birth for the foreign-born population - Laos (%)
Place of birth for the foreign-born population - Malaysia (%)
Place of birth for the foreign-born population - Philippines (%)
Place of birth for the foreign-born population - Singapore (%)
Place of birth for the foreign-born population - Thailand (%)
Place of birth for the foreign-born population - Vietnam (%)
Place of birth for the foreign-born population - Other South Eastern Asia (%)
Place of birth for the foreign-born population - Armenia (%)
Place of birth for the foreign-born population - Iraq (%)
Place of birth for the foreign-born population - Israel (%)
Place of birth for the foreign-born population - Jordan (%)
Place of birth for the foreign-born population - Kuwait (%)
Place of birth for the foreign-born population - Lebanon (%)
Place of birth for the foreign-born population - Saudi Arabia (%)
Place of birth for the foreign-born population - Syria (%)
Place of birth for the foreign-born population - Turkey (%)
Place of birth for the foreign-born population - Yemen (%)
Place of birth for the foreign-born population - Other Western Asia (%)
Place of birth for the foreign-born population - Eritrea (%)
Place of birth for the foreign-born population - Ethiopia (%)
Place of birth for the foreign-born population - Kenya (%)
Place of birth for the foreign-born population - Somalia (%)
Place of birth for the foreign-born population - Uganda (%)
Place of birth for the foreign-born population - Zimbabwe (%)
Place of birth for the foreign-born population - Other Eastern Africa (%)
Place of birth for the foreign-born population - Cameroon (%)
Place of birth for the foreign-born population - Congo (%)
Place of birth for the foreign-born population - Democratic Republic of Congo (Zaire) (%)
Place of birth for the foreign-born population - Other Middle Africa (%)
Place of birth for the foreign-born population - Egypt (%)
Place of birth for the foreign-born population - Morocco (%)
Place of birth for the foreign-born population - Sudan (%)
Place of birth for the foreign-born population - Other Northern Africa (%)
Place of birth for the foreign-born population - South Africa (%)
Place of birth for the foreign-born population - Other Southern Africa (%)
Place of birth for the foreign-born population - Cabo Verde (%)
Place of birth for the foreign-born population - Ghana (%)
Place of birth for the foreign-born population - Liberia (%)
Place of birth for the foreign-born population - Nigeria (%)
Place of birth for the foreign-born population - Senegal (%)
Place of birth for the foreign-born population - Sierra Leone (%)
Place of birth for the foreign-born population - Other Western Africa (%)
Place of birth for the foreign-born population - Australia (%)
Place of birth for the foreign-born population - New Zealand (%)
Place of birth for the foreign-born population - Fiji (%)
Place of birth for the foreign-born population - Micronesia (%)
Place of birth for the foreign-born population - Bahamas (%)
Place of birth for the foreign-born population - Barbados (%)
Place of birth for the foreign-born population - Cuba (%)
Place of birth for the foreign-born population - Dominica (%)
Place of birth for the foreign-born population - Dominican Republic (%)
Place of birth for the foreign-born population - Grenada (%)
Place of birth for the foreign-born population - Haiti (%)
Place of birth for the foreign-born population - Jamaica (%)
Place of birth for the foreign-born population - St. Vincent and the Grenadines (%)
Place of birth for the foreign-born population - Trinidad and Tobago (%)
Place of birth for the foreign-born population - West Indies (%)
Place of birth for the foreign-born population - Other Caribbean (%)
Place of birth for the foreign-born population - Belize (%)
Place of birth for the foreign-born population - Costa Rica (%)
Place of birth for the foreign-born population - El Salvador (%)
Place of birth for the foreign-born population - Guatemala (%)
Place of birth for the foreign-born population - Honduras (%)
Place of birth for the foreign-born population - Mexico (%)
Place of birth for the foreign-born population - Nicaragua (%)
Place of birth for the foreign-born population - Panama (%)
Place of birth for the foreign-born population - Other Central America (%)
Place of birth for the foreign-born population - Argentina (%)
Place of birth for the foreign-born population - Bolivia (%)
Place of birth for the foreign-born population - Brazil (%)
Place of birth for the foreign-born population - Chile (%)
Place of birth for the foreign-born population - Colombia (%)
Place of birth for the foreign-born population - Ecuador (%)
Place of birth for the foreign-born population - Guyana (%)
Place of birth for the foreign-born population - Peru (%)
Place of birth for the foreign-born population - Uruguay (%)
Place of birth for the foreign-born population - Venezuela (%)
Place of birth for the foreign-born population - Other South America (%)
Place of birth for the foreign-born population - Canada (%)
Place of birth for the foreign-born population - Other Northern America (%)
Place of birth for the foreign-born population - Other (%)
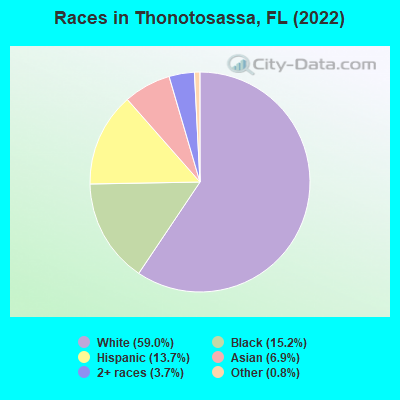
According to 2022 data, the most numerous races in Thonotosassa, FL are White alone (8,540 residents), Hispanic (1,980 residents), and Black alone (2,198 residents). 82.6% of Thonotosassa residents speak English at home. 8.8% of Thonotosassa, FL residents are foreign-born (3.6% born in Asia, 3.6% born in Latin America), which is 137.7% less than the foreign-born rate of 21.0% across the entire state of Florida.
Race distribution in Thonotosassa
2000 2022
10,458,509 65.4% White alone 2,682,715 16.8% Hispanic 2,264,268 14.2% Black alone 261,693 1.6% Asian alone 236,954 1.5% Two or more races 42,358 0.3% American Indian alone 28,994 0.2% Other race alone 6,887 0.04% Native Hawaiian and Other
11,309,403 50.8% White alone 6,025,039 27.1% Hispanic 3,241,015 14.6% Black alone 861,630 3.9% Two or more races 623,692 2.8% Asian alone 152,054 0.7% Other race alone 22,504 0.1% American Indian alone 9,486 0.04% Native Hawaiian and Other
Income and house value in Thonotosassa Median household income in 2022 $65,556 White non-Hispanic householders$52,345 Black householders$29,837 Some other race householders$33,782 Two or more races householders$39,391 Hispanic or Latino race householdersMedian 2022 house value $500,188 White Non-Hispanic householders$345,690 Black or African American householders$869,053 American Indian or Alaska Native householders $212,435 Asian householders$350,711 Two or more races householders$585,549 Hispanic or Latino householders
Median age by race in Thonotosassa
46.2 Median age for White residents46.2 46.2 47.9 Median age for Black or African American residents39.3 52.2 76.5 Median age for American Indian / Alaska Native residents77.4 -655,399,060.4 34.1 Median age for Asian residents14.8 37.6 -848,484,847.6 Median age for Native Hawaiian / Pacific Islander residents-776,729,559.0 -490,118,576.6 24.8 Median age for Other race residents32.6 13.2 22.2 Median age for Two or more races residents22.8 15.4 45.2 Median age for White alone residents43.9 46.6 31.2 Median age for Hispanic or Latino residents39.1 17.9
Owner/renter occupied households by race in Thonotosassa
House owners and renters - White residents 2,290 72.7% Owner occupied858 27.3% Renter occupiedHouse owners and renters - Black or African American residents 535 64.3% Owner occupied297 35.7% Renter occupiedHouse owners and renters - American Indian / Alaska Native residents 48 79.9% Owner occupied12 20.1% Renter occupiedHouse owners and renters - Asian residents 186 86.8% Owner occupied28 13.2% Renter occupiedHouse owners and renters - Other race residents 96 69.4% Owner occupied42 30.6% Renter occupiedHouse owners and renters - Two or more races residents 279 58.2% Owner occupied201 41.8% Renter occupiedHouse owners and renters - White alone residents 2,230 70.2% Owner occupied947 29.8% Renter occupiedHouse owners and renters - Hispanic or Latino residents 460 73.3% Owner occupied167 26.7% Renter occupied
Language usage in Thonotosassa
English speakers - Total 82.6% of residents of Thonotosassa speak English at home.
8.1% of residents speak Spanish at home 826 73.9% Speak English very well292 26.1% Speak English less than very well9.5% of residents speak other language at home 1,068 81.3% Speak English very well245 18.7% Speak English less than very well
English speakers - Born in the United States 88.4% of residents of Thonotosassa speak English at home.
6.3% of residents speak Spanish at home 331 90.4% Speak English very well35 9.6% Speak English less than very well5.1% of residents speak other language at home 267 89.9% Speak English very well30 10.1% Speak English less than very well
English speakers - Native, born elsewhere 32.3% of residents of Thonotosassa speak English at home.
58.4% of residents speak Spanish at home 91 45.7% Speak English very well108 54.3% Speak English less than very well15.5% of residents speak other language at home 53 100.0% Speak English very well
English speakers - Foreign-born 29.0% of residents of Thonotosassa speak English at home.
19.7% of residents speak Spanish at home 125 47.5% Speak English very well138 52.5% Speak English less than very well50.1% of residents speak other language at home 456 68.3% Speak English very well212 31.7% Speak English less than very well
White (Caucasian) - Speak only English Native:
99.0% (8,104)Foreign-born:
34.5% (51)
White (Caucasian) - Speak another language Native:
3.7% (303)Foreign-born:
68.2% (102)
Black or African American - Speak only English Native:
99.5% (1,818)Foreign-born:
84.9% (330)
Black or African American - Speak another language Native:
0.7% (14)Foreign-born:
14.4% (56)
Asian - Speak only English Native:
24.4% (103)Foreign-born:
6.1% (31)
Asian - Speak another language Native:
80.6% (341)Foreign-born:
93.6% (478)
Other race - Speak only English Native:
36.2% (134)Foreign-born:
5.3% (8)
Other race - Speak another language Native:
64.1% (236)Foreign-born:
94.9% (149)
Two or more races - Speak another language Native:
39.7% (493)Foreign-born:
100.0% (25)
White alone - Speak only English Native:
96.0% (7,869)Foreign-born:
33.8% (61)
White alone - Speak another language Native:
3.9% (320)Foreign-born:
65.7% (119)
Hispanic or Latino - Speak only English Native:
45.4% (647)Foreign-born:
9.7% (29)
Hispanic or Latino - Speak another language Native:
55.1% (784)Foreign-born:
89.8% (268)
Foreign-born residents in Thonotosassa 1,279 residents are foreign born (3.6% Asia , 3.6% Latin America ).
This city:
8.8%Florida:
21.1%
Marital status for residents in Thonotosassa Marital status - White (Caucasian) population 15 years and over
Males 37.6% Never married39.8% Now married2.1% Separated3.9% Widowed16.6% DivorcedFemales 19.4% Never married47.1% Now married1.5% Separated11.6% Widowed20.3% DivorcedWomen who gave birth in the past 12 months Now married:
100.0% (84)Unmarried:
0.0% (0)
Women who did not give birth in the past 12 months Now married:
42.9% (669)Unmarried:
57.1% (892)
Marital status - Black or African American population 15 years and over
Males 61.3% Never married26.7% Now married0.3% Separated4.5% Widowed7.1% DivorcedFemales 44.2% Never married20.8% Now married3.8% Separated13.6% Widowed17.6% DivorcedWomen who did not give birth in the past 12 months Now married:
8.7% (38)Unmarried:
91.3% (397)
Marital status - American Indian / Alaska Native population 15 years and over
Males 0.0% Never married75.0% Now married0.0% Separated25.0% Widowed0.0% DivorcedFemales 0.0% Never married41.7% Now married0.0% Separated0.0% Widowed58.3% DivorcedMarital status - Asian population 15 years and over
Males 21.0% Never married76.8% Now married0.0% Separated0.0% Widowed2.1% DivorcedFemales 26.2% Never married51.3% Now married0.0% Separated22.5% Widowed0.0% DivorcedWomen who gave birth in the past 12 months Now married:
100.0% (27)Unmarried:
0.0% (0)
Women who did not give birth in the past 12 months Now married:
49.2% (125)Unmarried:
50.8% (129)
Marital status - Other race population 15 years and over
Males 29.9% Never married65.3% Now married0.0% Separated4.8% Widowed0.0% DivorcedFemales 22.7% Never married68.2% Now married4.5% Separated4.5% Widowed0.0% DivorcedWomen who gave birth in the past 12 months Now married:
100.0% (66)Unmarried:
0.0% (0)
Women who did not give birth in the past 12 months Now married:
50.0% (34)Unmarried:
50.0% (34)
Marital status - Two or more races population 15 years and over
Males 54.5% Never married26.0% Now married0.0% Separated13.4% Widowed6.0% DivorcedFemales 26.6% Never married53.8% Now married1.8% Separated0.0% Widowed17.8% DivorcedWomen who gave birth in the past 12 months Now married:
100.0% (15)Unmarried:
0.0% (0)
Women who did not give birth in the past 12 months Now married:
37.4% (66)Unmarried:
62.6% (110)
Marital status - White alone, not Hispanic / Latino population 15 years and over
Males 40.2% Never married36.8% Now married2.4% Separated4.3% Widowed16.3% DivorcedFemales 18.2% Never married47.3% Now married1.6% Separated11.7% Widowed21.3% DivorcedWomen who gave birth in the past 12 months Now married:
100.0% (99)Unmarried:
0.0% (0)
Women who did not give birth in the past 12 months Now married:
43.5% (737)Unmarried:
56.5% (958)
Marital status - Hispanic or Latino population 15 years and over
Males 26.2% Never married55.5% Now married0.0% Separated8.1% Widowed10.1% DivorcedFemales 29.8% Never married60.1% Now married1.8% Separated6.1% Widowed2.2% DivorcedWomen who gave birth in the past 12 months Now married:
100.0% (44)Unmarried:
0.0% (0)
Women who did not give birth in the past 12 months Now married:
44.5% (118)Unmarried:
55.5% (147)
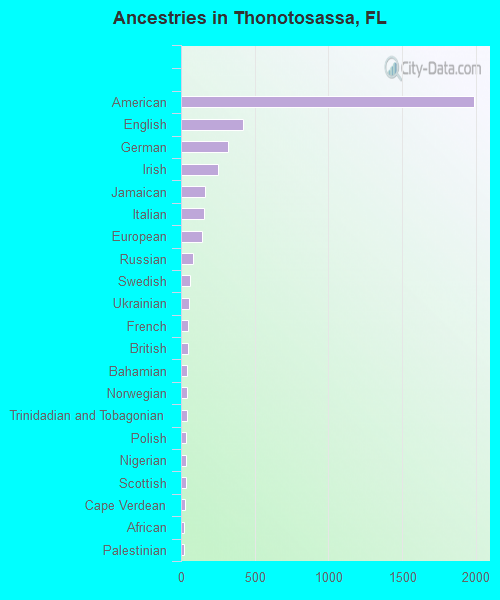
Ancestries in Thonotosassa
1,990 24.3% American419 5.1% English319 3.9% German254 3.1% Irish162 2.0% Jamaican158 1.9% Italian140 1.7% European79 1.0% Russian64 0.8% Swedish51 0.6% Ukrainian47 0.6% French45 0.6% British42 0.5% Bahamian39 0.5% Norwegian39 0.5% Trinidadian and Tobagonian36 0.4% Polish35 0.4% Nigerian31 0.4% Scottish28 0.3% Cape Verdean21 0.3% African19 0.2% Palestinian18 0.2% Welsh17 0.2% Egyptian17 0.2% Cajun17 0.2% Czech15 0.2% British West Indian14 0.2% Eastern European11 0.1% Celtic11 0.1% Scotch-Irish8 0.10% Brazilian8 0.10% Danish6 0.07% Dutch
Children Nativity (place of birth) in Thonotosassa
Children under 6 years - Living with two parents Both parents native 353 100.0% NativeBoth parents foreign-born 189 100.0% NativeOne native, one foreign-born parent 35 100.0% NativeChildren under 6 years - Living with one parent Native parent 68 100.0% NativeForeign-born parent 33 100.0% NativeChildren 6 to 17 years - Living with two parents Both parents native 807 98.2% Native15 1.8% Foreign-bornBoth parents foreign-born 350 92.0% Native30 8.0% Foreign-bornOne native, one foreign-born parent 109 100.0% NativeChildren 6 to 17 years - Living with one parent Native parent 506 100.0% NativeForeign-born parent 90 54.8% Native74 45.2% Foreign-born
Grandparents responsible for own grandchildren in Thonotosassa
Grandparents (30 to 59 years) White / Caucasian 25 49.1% Responsible for grandchildren26 50.9% Not responsible for grandchildrenBlack or African American 33 100.0% Responsible for grandchildrenWhite alone, not Hispanic / Latino 4 15.7% Responsible for grandchildren21 84.3% Not responsible for grandchildrenHispanic or Latino 51 100.0% Responsible for grandchildrenGrandparents (60 years and over) White / Caucasian 55 45.0% Responsible for grandchildren68 55.0% Not responsible for grandchildrenBlack or African American 45 55.9% Responsible for grandchildren35 44.1% Not responsible for grandchildrenWhite alone, not Hispanic / Latino 22 19.2% Responsible for grandchildren93 80.8% Not responsible for grandchildrenHispanic or Latino 16 81.3% Responsible for grandchildren4 18.7% Not responsible for grandchildren