Races in Thompsonville, Connecticut (CT) Detailed Stats
Data:
Races - White alone (%)
Races - White alone (% change since 2000)
Races - Black alone (%)
Races - Black alone (% change since 2000)
Races - American Indian alone (%)
Races - American Indian alone (% change since 2000)
Races - Asian alone (%)
Races - Asian alone (% change since 2000)
Races - Hispanic (%)
Races - Hispanic (% change since 2000)
Races - Native Hawaiian and Other Pacific Islander alone (%)
Races - Native Hawaiian and Other Pacific Islander alone (% change since 2000)
Races - Two or more races(%)
Races - Two or more races(% change since 2000)
Races - Other race alone (%)
Races - Other race alone (% change since 2000)
Racial diversity
Place of birth - Born in state of residence (%)
Place of birth - Born in state of residence (%) - White
Place of birth - Born in state of residence (%) - Black or African American
Place of birth - Born in state of residence (%) - Asian
Place of birth - Born in state of residence (%) - Hispanic or Latino
Place of birth - Born in state of residence (%) - American Indian and Alaska Native
Place of birth - Born in state of residence (%) - Multirace
Place of birth - Born in state of residence (%) - Other Race
Place of birth - Born in other state (%)
Place of birth - Born in other state (%) - White
Place of birth - Born in other state (%) - Black or African American
Place of birth - Born in other state (%) - Asian
Place of birth - Born in other state (%) - Hispanic or Latino
Place of birth - Born in other state (%) - American Indian and Alaska Native
Place of birth - Born in other state (%) - Multirace
Place of birth - Born in other state (%) - Other Race
Place of birth - Native, outside of US (%)
Place of birth - Native, outside of US (%) - White
Place of birth - Native, outside of US (%) - Black or African American
Place of birth - Native, outside of US (%) - Asian
Place of birth - Native, outside of US (%) - Hispanic or Latino
Place of birth - Native, outside of US (%) - American Indian and Alaska Native
Place of birth - Native, outside of US (%) - Multirace
Place of birth - Native, outside of US (%) - Other Race
Place of birth - Foreign born (%)
Place of birth - Foreign born (%) - White
Place of birth - Foreign born (%) - Black or African American
Place of birth - Foreign born (%) - Asian
Place of birth - Foreign born (%) - Hispanic or Latino
Place of birth - Foreign born (%) - American Indian and Alaska Native
Place of birth - Foreign born (%) - Multirace
Place of birth - Foreign born (%) - Other Race
Residents speaking English at home (%)
Residents speaking English at home - Born in the United States (%)
Residents speaking English at home - Native, born elsewhere (%)
Residents speaking English at home - Foreign born (%)
Residents speaking Spanish at home (%)
Residents speaking Spanish at home - Born in the United States (%)
Residents speaking Spanish at home - Native, born elsewhere (%)
Residents speaking Spanish at home - Foreign born (%)
Residents speaking other language at home (%)
Residents speaking other language at home - Born in the United States (%)
Residents speaking other language at home - Native, born elsewhere (%)
Residents speaking other language at home - Foreign born (%)
Marital status - Never married (%)
Marital status - Now married (%)
Marital status - Separated (%)
Marital status - Widowed (%)
Marital status - Divorced (%)
Ancestries Reported - Arab (%)
Ancestries Reported - Czech (%)
Ancestries Reported - Danish (%)
Ancestries Reported - Dutch (%)
Ancestries Reported - English (%)
Ancestries Reported - French (%)
Ancestries Reported - French Canadian (%)
Ancestries Reported - German (%)
Ancestries Reported - Greek (%)
Ancestries Reported - Hungarian (%)
Ancestries Reported - Irish (%)
Ancestries Reported - Italian (%)
Ancestries Reported - Lithuanian (%)
Ancestries Reported - Norwegian (%)
Ancestries Reported - Polish (%)
Ancestries Reported - Portuguese (%)
Ancestries Reported - Russian (%)
Ancestries Reported - Scotch-Irish (%)
Ancestries Reported - Scottish (%)
Ancestries Reported - Slovak (%)
Ancestries Reported - Subsaharan African (%)
Ancestries Reported - Swedish (%)
Ancestries Reported - Swiss (%)
Ancestries Reported - Ukrainian (%)
Ancestries Reported - United States (%)
Ancestries Reported - Welsh (%)
Ancestries Reported - West Indian (%)
Ancestries Reported - Other (%)
Geographical mobility - Same house 1 year ago (%)
Geographical mobility - Same house 1 year ago (%) - White
Geographical mobility - Same house 1 year ago (%) - Black or African American
Geographical mobility - Same house 1 year ago (%) - Asian
Geographical mobility - Same house 1 year ago (%) - Hispanic or Latino
Geographical mobility - Same house 1 year ago (%) - American Indian and Alaska Native
Geographical mobility - Same house 1 year ago (%) - Multirace
Geographical mobility - Same house 1 year ago (%) - Other Race
Geographical mobility - Moved within same county (%)
Geographical mobility - Moved within same county (%) - White
Geographical mobility - Moved within same county (%) - Black or African American
Geographical mobility - Moved within same county (%) - Asian
Geographical mobility - Moved within same county (%) - Hispanic or Latino
Geographical mobility - Moved within same county (%) - American Indian and Alaska Native
Geographical mobility - Moved within same county (%) - Multirace
Geographical mobility - Moved within same county (%) - Other Race
Geographical mobility - Moved from different county within same state (%)
Geographical mobility - Moved from different county within same state (%) - White
Geographical mobility - Moved from different county within same state (%) - Black or African American
Geographical mobility - Moved from different county within same state (%) - Asian
Geographical mobility - Moved from different county within same state (%) - Hispanic or Latino
Geographical mobility - Moved from different county within same state (%) - American Indian and Alaska Native
Geographical mobility - Moved from different county within same state (%) - Multirace
Geographical mobility - Moved from different county within same state (%) - Other Race
Geographical mobility - Moved from different state (%)
Geographical mobility - Moved from different state (%) - White
Geographical mobility - Moved from different state (%) - Black or African American
Geographical mobility - Moved from different state (%) - Asian
Geographical mobility - Moved from different state (%) - Hispanic or Latino
Geographical mobility - Moved from different state (%) - American Indian and Alaska Native
Geographical mobility - Moved from different state (%) - Multirace
Geographical mobility - Moved from different state (%) - Other Race
Geographical mobility - Moved from abroad (%)
Geographical mobility - Moved from abroad (%) - White
Geographical mobility - Moved from abroad (%) - Black or African American
Geographical mobility - Moved from abroad (%) - Asian
Geographical mobility - Moved from abroad (%) - Hispanic or Latino
Geographical mobility - Moved from abroad (%) - American Indian and Alaska Native
Geographical mobility - Moved from abroad (%) - Multirace
Geographical mobility - Moved from abroad (%) - Other Race
Place of birth for the foreign-born population - Ireland (%)
Place of birth for the foreign-born population - Denmark (%)
Place of birth for the foreign-born population - Norway (%)
Place of birth for the foreign-born population - Sweden (%)
Place of birth for the foreign-born population - United Kingdom (%)
Place of birth for the foreign-born population - England (%)
Place of birth for the foreign-born population - Scotland (%)
Place of birth for the foreign-born population - Other Northern Europe (%)
Place of birth for the foreign-born population - Austria (%)
Place of birth for the foreign-born population - Belgium (%)
Place of birth for the foreign-born population - France (%)
Place of birth for the foreign-born population - Germany (%)
Place of birth for the foreign-born population - Netherlands (%)
Place of birth for the foreign-born population - Switzerland (%)
Place of birth for the foreign-born population - Other Western Europe (%)
Place of birth for the foreign-born population - Greece (%)
Place of birth for the foreign-born population - Italy (%)
Place of birth for the foreign-born population - Portugal (%)
Place of birth for the foreign-born population - Spain (%)
Place of birth for the foreign-born population - Other Southern Europe (%)
Place of birth for the foreign-born population - Albania (%)
Place of birth for the foreign-born population - Belarus (%)
Place of birth for the foreign-born population - Bosnia and Herzegovina (%)
Place of birth for the foreign-born population - Bulgaria (%)
Place of birth for the foreign-born population - Croatia (%)
Place of birth for the foreign-born population - Czechoslovakia (%)
Place of birth for the foreign-born population - Hungary (%)
Place of birth for the foreign-born population - Latvia (%)
Place of birth for the foreign-born population - Lithuania (%)
Place of birth for the foreign-born population - North Macedonia (Macedonia) (%)
Place of birth for the foreign-born population - Moldova (%)
Place of birth for the foreign-born population - Poland (%)
Place of birth for the foreign-born population - Romania (%)
Place of birth for the foreign-born population - Russia (%)
Place of birth for the foreign-born population - Serbia (%)
Place of birth for the foreign-born population - Ukraine (%)
Place of birth for the foreign-born population - Other Eastern Europe (%)
Place of birth for the foreign-born population - China (%)
Place of birth for the foreign-born population - Hong Kong (%)
Place of birth for the foreign-born population - Taiwan (%)
Place of birth for the foreign-born population - Japan (%)
Place of birth for the foreign-born population - Korea (%)
Place of birth for the foreign-born population - Other Eastern Asia (%)
Place of birth for the foreign-born population - Afghanistan (%)
Place of birth for the foreign-born population - Bangladesh (%)
Place of birth for the foreign-born population - India (%)
Place of birth for the foreign-born population - Iran (%)
Place of birth for the foreign-born population - Kazakhstan (%)
Place of birth for the foreign-born population - Nepal (%)
Place of birth for the foreign-born population - Pakistan (%)
Place of birth for the foreign-born population - Sri Lanka (%)
Place of birth for the foreign-born population - Uzbekistan (%)
Place of birth for the foreign-born population - Other South Central Asia (%)
Place of birth for the foreign-born population - Burma (%)
Place of birth for the foreign-born population - Cambodia (%)
Place of birth for the foreign-born population - Indonesia (%)
Place of birth for the foreign-born population - Laos (%)
Place of birth for the foreign-born population - Malaysia (%)
Place of birth for the foreign-born population - Philippines (%)
Place of birth for the foreign-born population - Singapore (%)
Place of birth for the foreign-born population - Thailand (%)
Place of birth for the foreign-born population - Vietnam (%)
Place of birth for the foreign-born population - Other South Eastern Asia (%)
Place of birth for the foreign-born population - Armenia (%)
Place of birth for the foreign-born population - Iraq (%)
Place of birth for the foreign-born population - Israel (%)
Place of birth for the foreign-born population - Jordan (%)
Place of birth for the foreign-born population - Kuwait (%)
Place of birth for the foreign-born population - Lebanon (%)
Place of birth for the foreign-born population - Saudi Arabia (%)
Place of birth for the foreign-born population - Syria (%)
Place of birth for the foreign-born population - Turkey (%)
Place of birth for the foreign-born population - Yemen (%)
Place of birth for the foreign-born population - Other Western Asia (%)
Place of birth for the foreign-born population - Eritrea (%)
Place of birth for the foreign-born population - Ethiopia (%)
Place of birth for the foreign-born population - Kenya (%)
Place of birth for the foreign-born population - Somalia (%)
Place of birth for the foreign-born population - Uganda (%)
Place of birth for the foreign-born population - Zimbabwe (%)
Place of birth for the foreign-born population - Other Eastern Africa (%)
Place of birth for the foreign-born population - Cameroon (%)
Place of birth for the foreign-born population - Congo (%)
Place of birth for the foreign-born population - Democratic Republic of Congo (Zaire) (%)
Place of birth for the foreign-born population - Other Middle Africa (%)
Place of birth for the foreign-born population - Egypt (%)
Place of birth for the foreign-born population - Morocco (%)
Place of birth for the foreign-born population - Sudan (%)
Place of birth for the foreign-born population - Other Northern Africa (%)
Place of birth for the foreign-born population - South Africa (%)
Place of birth for the foreign-born population - Other Southern Africa (%)
Place of birth for the foreign-born population - Cabo Verde (%)
Place of birth for the foreign-born population - Ghana (%)
Place of birth for the foreign-born population - Liberia (%)
Place of birth for the foreign-born population - Nigeria (%)
Place of birth for the foreign-born population - Senegal (%)
Place of birth for the foreign-born population - Sierra Leone (%)
Place of birth for the foreign-born population - Other Western Africa (%)
Place of birth for the foreign-born population - Australia (%)
Place of birth for the foreign-born population - New Zealand (%)
Place of birth for the foreign-born population - Fiji (%)
Place of birth for the foreign-born population - Micronesia (%)
Place of birth for the foreign-born population - Bahamas (%)
Place of birth for the foreign-born population - Barbados (%)
Place of birth for the foreign-born population - Cuba (%)
Place of birth for the foreign-born population - Dominica (%)
Place of birth for the foreign-born population - Dominican Republic (%)
Place of birth for the foreign-born population - Grenada (%)
Place of birth for the foreign-born population - Haiti (%)
Place of birth for the foreign-born population - Jamaica (%)
Place of birth for the foreign-born population - St. Vincent and the Grenadines (%)
Place of birth for the foreign-born population - Trinidad and Tobago (%)
Place of birth for the foreign-born population - West Indies (%)
Place of birth for the foreign-born population - Other Caribbean (%)
Place of birth for the foreign-born population - Belize (%)
Place of birth for the foreign-born population - Costa Rica (%)
Place of birth for the foreign-born population - El Salvador (%)
Place of birth for the foreign-born population - Guatemala (%)
Place of birth for the foreign-born population - Honduras (%)
Place of birth for the foreign-born population - Mexico (%)
Place of birth for the foreign-born population - Nicaragua (%)
Place of birth for the foreign-born population - Panama (%)
Place of birth for the foreign-born population - Other Central America (%)
Place of birth for the foreign-born population - Argentina (%)
Place of birth for the foreign-born population - Bolivia (%)
Place of birth for the foreign-born population - Brazil (%)
Place of birth for the foreign-born population - Chile (%)
Place of birth for the foreign-born population - Colombia (%)
Place of birth for the foreign-born population - Ecuador (%)
Place of birth for the foreign-born population - Guyana (%)
Place of birth for the foreign-born population - Peru (%)
Place of birth for the foreign-born population - Uruguay (%)
Place of birth for the foreign-born population - Venezuela (%)
Place of birth for the foreign-born population - Other South America (%)
Place of birth for the foreign-born population - Canada (%)
Place of birth for the foreign-born population - Other Northern America (%)
Place of birth for the foreign-born population - Other (%)
Latest news about races in Thompsonville, CT collected exclusively by city-data.com from local newspapers, TV, and radio stations
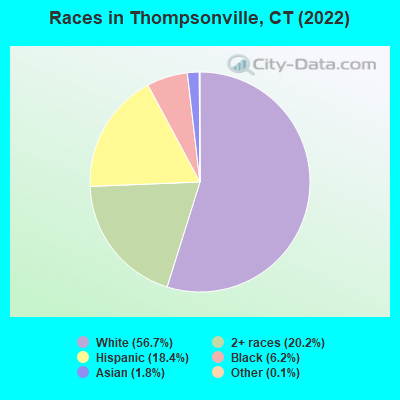
According to 2022 data, the most numerous races in Thompsonville, CT are White alone (4,611 residents), Hispanic (1,495 residents), and Black alone (500 residents). 86.3% of Thompsonville residents speak English at home. 4.7% of Thompsonville, CT residents are foreign-born (2.0% born in Asia, 1.5% born in Latin America, 0.8% born in Europe), which is 216.8% less than the foreign-born rate of 15.0% across the entire state of Connecticut.
Race distribution in Thompsonville
2000 2022
2,638,845 77.5% White alone 320,323 9.4% Hispanic 295,571 8.7% Black alone 81,564 2.4% Asian alone 52,896 1.6% Two or more races 8,141 0.2% Other race alone 7,267 0.2% American Indian alone 958 0.03% Native Hawaiian and Other
2,246,913 62.0% White alone 658,978 18.2% Hispanic 353,973 9.8% Black alone 172,929 4.8% Asian alone 159,631 4.4% Two or more races 29,761 0.8% Other race alone 3,428 0.09% American Indian alone 592 0.02% Native Hawaiian and Other
Income and house value in Thompsonville Median household income in 2022 $51,353 White non-Hispanic householders$81,739 Black householders$67,640 Asian householders$53,071 Hispanic or Latino race householdersMedian 2022 house value $236,929 White Non-Hispanic householders$279,158 Black or African American householders$192,872 Two or more races householders$824,887 Hispanic or Latino householders
Median age by race in Thompsonville
47.9 Median age for White residents46.6 50.4 37.1 Median age for Black or African American residents53.0 35.7 -742,173,111.6 Median age for American Indian / Alaska Native residents-701,030,927.1 -704,477,611.2 29.6 Median age for Asian residents20.6 30.0 -641,269,840.6 Median age for Native Hawaiian / Pacific Islander residents-414,239,481.8 -691,588,784.4 10.8 Median age for Other race residents10.9 8.2 7.1 Median age for Two or more races residents14.6 0.0 50.2 Median age for White alone residents47.4 51.8 15.6 Median age for Hispanic or Latino residents13.3 19.1
Owner/renter occupied households by race in Thompsonville
House owners and renters - White residents 1,117 42.8% Owner occupied1,495 57.2% Renter occupiedHouse owners and renters - Black or African American residents 257 88.3% Owner occupied34 11.7% Renter occupiedHouse owners and renters - Asian residents 9 8.9% Owner occupied88 91.1% Renter occupiedHouse owners and renters - Other race residents 132 100.0% Renter occupiedHouse owners and renters - Two or more races residents 32 50.6% Owner occupied31 49.4% Renter occupiedHouse owners and renters - White alone residents 1,123 43.6% Owner occupied1,456 56.4% Renter occupiedHouse owners and renters - Hispanic or Latino residents 23 7.8% Owner occupied274 92.2% Renter occupied
Language usage in Thompsonville
English speakers - Total 86.3% of residents of Thompsonville speak English at home.
9.3% of residents speak Spanish at home 581 84.1% Speak English very well110 15.9% Speak English less than very well4.0% of residents speak other language at home 198 66.4% Speak English very well100 33.6% Speak English less than very well
English speakers - Born in the United States 89.3% of residents of Thompsonville speak English at home.
7.7% of residents speak Spanish at home 212 100.0% Speak English very well2.7% of residents speak other language at home 62 82.7% Speak English very well13 17.3% Speak English less than very well
English speakers - Native, born elsewhere 0.0% of residents of Thompsonville speak English at home.
94.2% of residents speak Spanish at home 89 49.7% Speak English very well90 50.3% Speak English less than very well
English speakers - Foreign-born 36.5% of residents of Thompsonville speak English at home.
13.8% of residents speak Spanish at home 52 98.1% Speak English very well1 1.9% Speak English less than very well49.5% of residents speak other language at home 123 64.7% Speak English very well67 35.3% Speak English less than very well
White (Caucasian) - Speak only English Native:
91.2% (4,487)Foreign-born:
54.7% (35)
White (Caucasian) - Speak another language Native:
8.0% (392)Foreign-born:
49.5% (32)
Black or African American - Speak only English Native:
93.2% (389)Foreign-born:
65.8% (36)
Black or African American - Speak another language Native:
6.6% (28)Foreign-born:
34.1% (18)
Asian - Speak only English Native:
48.6% (9)Foreign-born:
5.5% (7)
Asian - Speak another language Native:
51.1% (10)Foreign-born:
95.1% (121)
Other race - Speak another language Native:
16.8% (156)Foreign-born:
100.0% (38)
Two or more races - Speak only English Native:
92.9% (849)Foreign-born:
44.5% (62)
Two or more races - Speak another language Native:
1.7% (16)Foreign-born:
33.6% (47)
White alone - Speak only English Native:
93.3% (4,223)Foreign-born:
61.4% (36)
White alone - Speak another language Native:
6.7% (304)Foreign-born:
39.6% (24)
Hispanic or Latino - Speak another language Native:
27.0% (383)Foreign-born:
100.0% (51)
Foreign-born residents in Thompsonville 385 residents are foreign born (2.0% Asia , 1.5% Latin America , 0.8% Europe ).
This city:
4.7%Connecticut:
15.0%
Marital status for residents in Thompsonville Marital status - White (Caucasian) population 15 years and over
Males 43.2% Never married36.3% Now married0.3% Separated1.4% Widowed18.9% DivorcedFemales 28.1% Never married37.1% Now married3.7% Separated9.7% Widowed21.4% DivorcedWomen who gave birth in the past 12 months Now married:
92.2% (207)Unmarried:
7.8% (17)
Women who did not give birth in the past 12 months Now married:
42.0% (397)Unmarried:
58.0% (549)
Marital status - Black or African American population 15 years and over
Males 37.1% Never married62.9% Now married0.0% Separated0.0% Widowed0.0% DivorcedFemales 37.0% Never married57.0% Now married0.0% Separated0.0% Widowed6.0% DivorcedWomen who gave birth in the past 12 months Now married:
0.0% (0)Unmarried:
100.0% (18)
Women who did not give birth in the past 12 months Now married:
63.4% (107)Unmarried:
36.6% (62)
Marital status - Asian population 15 years and over
Males 77.8% Never married22.2% Now married0.0% Separated0.0% Widowed0.0% DivorcedFemales 72.2% Never married23.5% Now married4.3% Separated0.0% Widowed0.0% DivorcedWomen who did not give birth in the past 12 months Now married:
8.8% (8)Unmarried:
91.2% (81)
Marital status - Other race population 15 years and over
Males 50.7% Never married18.7% Now married0.0% Separated0.0% Widowed30.6% DivorcedFemales 72.4% Never married6.5% Now married16.3% Separated4.9% Widowed0.0% DivorcedWomen who did not give birth in the past 12 months Now married:
8.2% (10)Unmarried:
91.8% (109)
Marital status - Two or more races population 15 years and over
Males 30.0% Never married70.0% Now married0.0% Separated0.0% Widowed0.0% DivorcedFemales 28.4% Never married23.2% Now married0.0% Separated0.0% Widowed48.4% DivorcedWomen who gave birth in the past 12 months Now married:
0.0% (0)Unmarried:
100.0% (9)
Women who did not give birth in the past 12 months Now married:
52.4% (34)Unmarried:
47.6% (31)
Marital status - White alone, not Hispanic / Latino population 15 years and over
Males 43.7% Never married35.5% Now married0.3% Separated1.5% Widowed19.0% DivorcedFemales 25.1% Never married36.1% Now married4.1% Separated10.6% Widowed24.1% DivorcedWomen who gave birth in the past 12 months Now married:
97.8% (219)Unmarried:
2.2% (5)
Women who did not give birth in the past 12 months Now married:
43.7% (343)Unmarried:
56.3% (441)
Marital status - Hispanic or Latino population 15 years and over
Males 44.6% Never married34.0% Now married0.0% Separated0.0% Widowed21.5% DivorcedFemales 58.0% Never married34.0% Now married4.9% Separated3.2% Widowed0.0% DivorcedWomen who gave birth in the past 12 months Now married:
0.0% (0)Unmarried:
100.0% (15)
Women who did not give birth in the past 12 months Now married:
27.4% (91)Unmarried:
72.6% (243)
Ancestries in Thompsonville
524 16.2% Italian286 8.9% American162 5.0% Irish137 4.2% French116 3.6% English78 2.4% French Canadian64 2.0% German51 1.6% European50 1.5% Jamaican34 1.1% Polish27 0.8% Eastern European27 0.8% Portuguese23 0.7% Trinidadian and Tobagonian20 0.6% Scottish19 0.6% Somali18 0.6% Haitian13 0.4% Guyanese13 0.4% Nigerian12 0.4% Egyptian11 0.3% Swedish7 0.2% Russian4 0.1% Lithuanian3 0.09% British1 0.03% Norwegian
Children Nativity (place of birth) in Thompsonville
Children under 6 years - Living with two parents Both parents native 645 100.0% NativeBoth parents foreign-born 14 100.0% Foreign-bornChildren under 6 years - Living with one parent Native parent 104 100.0% NativeChildren 6 to 17 years - Living with two parents Both parents native 908 99.6% Native4 0.4% Foreign-bornOne native, one foreign-born parent 8 100.0% NativeChildren 6 to 17 years - Living with one parent Native parent 257 100.0% NativeForeign-born parent 27 50.8% Native26 49.2% Foreign-born
Grandparents responsible for own grandchildren in Thompsonville
Grandparents (30 to 59 years) White / Caucasian 4 100.0% Not responsible for grandchildrenWhite alone, not Hispanic / Latino 5 100.0% Not responsible for grandchildren
Grandparents (60 years and over) White / Caucasian 13 100.0% Not responsible for grandchildrenWhite alone, not Hispanic / Latino 14 100.0% Not responsible for grandchildren