Races in Thomasville, North Carolina (NC) Detailed Stats
Data:
Races - White alone (%)
Races - White alone (% change since 2000)
Races - Black alone (%)
Races - Black alone (% change since 2000)
Races - American Indian alone (%)
Races - American Indian alone (% change since 2000)
Races - Asian alone (%)
Races - Asian alone (% change since 2000)
Races - Hispanic (%)
Races - Hispanic (% change since 2000)
Races - Native Hawaiian and Other Pacific Islander alone (%)
Races - Native Hawaiian and Other Pacific Islander alone (% change since 2000)
Races - Two or more races(%)
Races - Two or more races(% change since 2000)
Races - Other race alone (%)
Races - Other race alone (% change since 2000)
Racial diversity
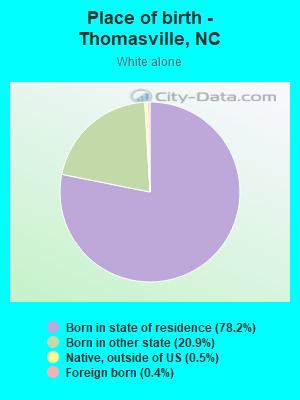
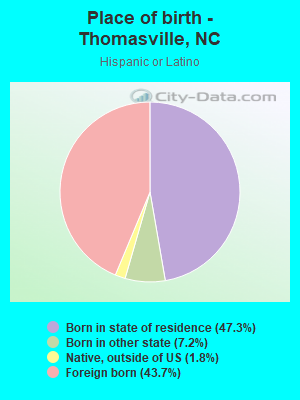
Place of birth - Born in state of residence (%)
Place of birth - Born in state of residence (%) - White
Place of birth - Born in state of residence (%) - Black or African American
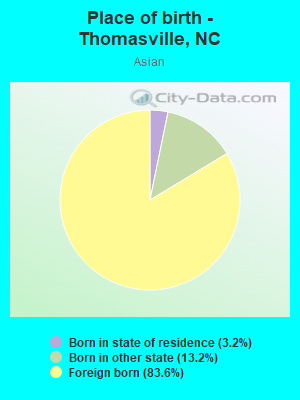
Place of birth - Born in state of residence (%) - Asian
Place of birth - Born in state of residence (%) - Hispanic or Latino
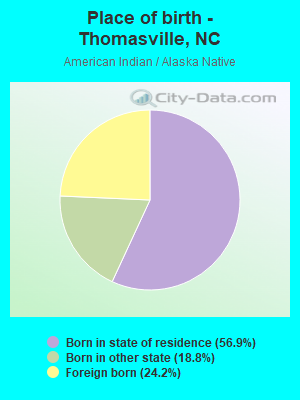
Place of birth - Born in state of residence (%) - American Indian and Alaska Native
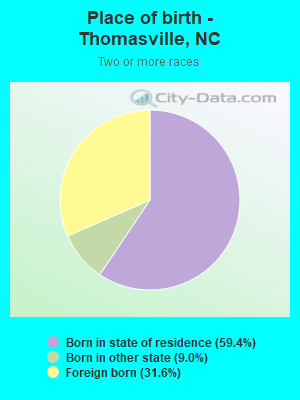
Place of birth - Born in state of residence (%) - Multirace
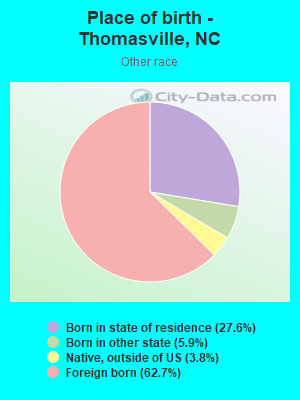
Place of birth - Born in state of residence (%) - Other Race
Place of birth - Born in other state (%)
Place of birth - Born in other state (%) - White
Place of birth - Born in other state (%) - Black or African American
Place of birth - Born in other state (%) - Asian
Place of birth - Born in other state (%) - Hispanic or Latino
Place of birth - Born in other state (%) - American Indian and Alaska Native
Place of birth - Born in other state (%) - Multirace
Place of birth - Born in other state (%) - Other Race
Place of birth - Native, outside of US (%)
Place of birth - Native, outside of US (%) - White
Place of birth - Native, outside of US (%) - Black or African American
Place of birth - Native, outside of US (%) - Asian
Place of birth - Native, outside of US (%) - Hispanic or Latino
Place of birth - Native, outside of US (%) - American Indian and Alaska Native
Place of birth - Native, outside of US (%) - Multirace
Place of birth - Native, outside of US (%) - Other Race
Place of birth - Foreign born (%)
Place of birth - Foreign born (%) - White
Place of birth - Foreign born (%) - Black or African American
Place of birth - Foreign born (%) - Asian
Place of birth - Foreign born (%) - Hispanic or Latino
Place of birth - Foreign born (%) - American Indian and Alaska Native
Place of birth - Foreign born (%) - Multirace
Place of birth - Foreign born (%) - Other Race
Residents speaking English at home (%)
Residents speaking English at home - Born in the United States (%)
Residents speaking English at home - Native, born elsewhere (%)
Residents speaking English at home - Foreign born (%)
Residents speaking Spanish at home (%)
Residents speaking Spanish at home - Born in the United States (%)
Residents speaking Spanish at home - Native, born elsewhere (%)
Residents speaking Spanish at home - Foreign born (%)
Residents speaking other language at home (%)
Residents speaking other language at home - Born in the United States (%)
Residents speaking other language at home - Native, born elsewhere (%)
Residents speaking other language at home - Foreign born (%)
Marital status - Never married (%)
Marital status - Now married (%)
Marital status - Separated (%)
Marital status - Widowed (%)
Marital status - Divorced (%)
Ancestries Reported - Arab (%)
Ancestries Reported - Czech (%)
Ancestries Reported - Danish (%)
Ancestries Reported - Dutch (%)
Ancestries Reported - English (%)
Ancestries Reported - French (%)
Ancestries Reported - French Canadian (%)
Ancestries Reported - German (%)
Ancestries Reported - Greek (%)
Ancestries Reported - Hungarian (%)
Ancestries Reported - Irish (%)
Ancestries Reported - Italian (%)
Ancestries Reported - Lithuanian (%)
Ancestries Reported - Norwegian (%)
Ancestries Reported - Polish (%)
Ancestries Reported - Portuguese (%)
Ancestries Reported - Russian (%)
Ancestries Reported - Scotch-Irish (%)
Ancestries Reported - Scottish (%)
Ancestries Reported - Slovak (%)
Ancestries Reported - Subsaharan African (%)
Ancestries Reported - Swedish (%)
Ancestries Reported - Swiss (%)
Ancestries Reported - Ukrainian (%)
Ancestries Reported - United States (%)
Ancestries Reported - Welsh (%)
Ancestries Reported - West Indian (%)
Ancestries Reported - Other (%)
Geographical mobility - Same house 1 year ago (%)
Geographical mobility - Same house 1 year ago (%) - White
Geographical mobility - Same house 1 year ago (%) - Black or African American
Geographical mobility - Same house 1 year ago (%) - Asian
Geographical mobility - Same house 1 year ago (%) - Hispanic or Latino
Geographical mobility - Same house 1 year ago (%) - American Indian and Alaska Native
Geographical mobility - Same house 1 year ago (%) - Multirace
Geographical mobility - Same house 1 year ago (%) - Other Race
Geographical mobility - Moved within same county (%)
Geographical mobility - Moved within same county (%) - White
Geographical mobility - Moved within same county (%) - Black or African American
Geographical mobility - Moved within same county (%) - Asian
Geographical mobility - Moved within same county (%) - Hispanic or Latino
Geographical mobility - Moved within same county (%) - American Indian and Alaska Native
Geographical mobility - Moved within same county (%) - Multirace
Geographical mobility - Moved within same county (%) - Other Race
Geographical mobility - Moved from different county within same state (%)
Geographical mobility - Moved from different county within same state (%) - White
Geographical mobility - Moved from different county within same state (%) - Black or African American
Geographical mobility - Moved from different county within same state (%) - Asian
Geographical mobility - Moved from different county within same state (%) - Hispanic or Latino
Geographical mobility - Moved from different county within same state (%) - American Indian and Alaska Native
Geographical mobility - Moved from different county within same state (%) - Multirace
Geographical mobility - Moved from different county within same state (%) - Other Race
Geographical mobility - Moved from different state (%)
Geographical mobility - Moved from different state (%) - White
Geographical mobility - Moved from different state (%) - Black or African American
Geographical mobility - Moved from different state (%) - Asian
Geographical mobility - Moved from different state (%) - Hispanic or Latino
Geographical mobility - Moved from different state (%) - American Indian and Alaska Native
Geographical mobility - Moved from different state (%) - Multirace
Geographical mobility - Moved from different state (%) - Other Race
Geographical mobility - Moved from abroad (%)
Geographical mobility - Moved from abroad (%) - White
Geographical mobility - Moved from abroad (%) - Black or African American
Geographical mobility - Moved from abroad (%) - Asian
Geographical mobility - Moved from abroad (%) - Hispanic or Latino
Geographical mobility - Moved from abroad (%) - American Indian and Alaska Native
Geographical mobility - Moved from abroad (%) - Multirace
Geographical mobility - Moved from abroad (%) - Other Race
Place of birth for the foreign-born population - Ireland (%)
Place of birth for the foreign-born population - Denmark (%)
Place of birth for the foreign-born population - Norway (%)
Place of birth for the foreign-born population - Sweden (%)
Place of birth for the foreign-born population - United Kingdom (%)
Place of birth for the foreign-born population - England (%)
Place of birth for the foreign-born population - Scotland (%)
Place of birth for the foreign-born population - Other Northern Europe (%)
Place of birth for the foreign-born population - Austria (%)
Place of birth for the foreign-born population - Belgium (%)
Place of birth for the foreign-born population - France (%)
Place of birth for the foreign-born population - Germany (%)
Place of birth for the foreign-born population - Netherlands (%)
Place of birth for the foreign-born population - Switzerland (%)
Place of birth for the foreign-born population - Other Western Europe (%)
Place of birth for the foreign-born population - Greece (%)
Place of birth for the foreign-born population - Italy (%)
Place of birth for the foreign-born population - Portugal (%)
Place of birth for the foreign-born population - Spain (%)
Place of birth for the foreign-born population - Other Southern Europe (%)
Place of birth for the foreign-born population - Albania (%)
Place of birth for the foreign-born population - Belarus (%)
Place of birth for the foreign-born population - Bosnia and Herzegovina (%)
Place of birth for the foreign-born population - Bulgaria (%)
Place of birth for the foreign-born population - Croatia (%)
Place of birth for the foreign-born population - Czechoslovakia (%)
Place of birth for the foreign-born population - Hungary (%)
Place of birth for the foreign-born population - Latvia (%)
Place of birth for the foreign-born population - Lithuania (%)
Place of birth for the foreign-born population - North Macedonia (Macedonia) (%)
Place of birth for the foreign-born population - Moldova (%)
Place of birth for the foreign-born population - Poland (%)
Place of birth for the foreign-born population - Romania (%)
Place of birth for the foreign-born population - Russia (%)
Place of birth for the foreign-born population - Serbia (%)
Place of birth for the foreign-born population - Ukraine (%)
Place of birth for the foreign-born population - Other Eastern Europe (%)
Place of birth for the foreign-born population - China (%)
Place of birth for the foreign-born population - Hong Kong (%)
Place of birth for the foreign-born population - Taiwan (%)
Place of birth for the foreign-born population - Japan (%)
Place of birth for the foreign-born population - Korea (%)
Place of birth for the foreign-born population - Other Eastern Asia (%)
Place of birth for the foreign-born population - Afghanistan (%)
Place of birth for the foreign-born population - Bangladesh (%)
Place of birth for the foreign-born population - India (%)
Place of birth for the foreign-born population - Iran (%)
Place of birth for the foreign-born population - Kazakhstan (%)
Place of birth for the foreign-born population - Nepal (%)
Place of birth for the foreign-born population - Pakistan (%)
Place of birth for the foreign-born population - Sri Lanka (%)
Place of birth for the foreign-born population - Uzbekistan (%)
Place of birth for the foreign-born population - Other South Central Asia (%)
Place of birth for the foreign-born population - Burma (%)
Place of birth for the foreign-born population - Cambodia (%)
Place of birth for the foreign-born population - Indonesia (%)
Place of birth for the foreign-born population - Laos (%)
Place of birth for the foreign-born population - Malaysia (%)
Place of birth for the foreign-born population - Philippines (%)
Place of birth for the foreign-born population - Singapore (%)
Place of birth for the foreign-born population - Thailand (%)
Place of birth for the foreign-born population - Vietnam (%)
Place of birth for the foreign-born population - Other South Eastern Asia (%)
Place of birth for the foreign-born population - Armenia (%)
Place of birth for the foreign-born population - Iraq (%)
Place of birth for the foreign-born population - Israel (%)
Place of birth for the foreign-born population - Jordan (%)
Place of birth for the foreign-born population - Kuwait (%)
Place of birth for the foreign-born population - Lebanon (%)
Place of birth for the foreign-born population - Saudi Arabia (%)
Place of birth for the foreign-born population - Syria (%)
Place of birth for the foreign-born population - Turkey (%)
Place of birth for the foreign-born population - Yemen (%)
Place of birth for the foreign-born population - Other Western Asia (%)
Place of birth for the foreign-born population - Eritrea (%)
Place of birth for the foreign-born population - Ethiopia (%)
Place of birth for the foreign-born population - Kenya (%)
Place of birth for the foreign-born population - Somalia (%)
Place of birth for the foreign-born population - Uganda (%)
Place of birth for the foreign-born population - Zimbabwe (%)
Place of birth for the foreign-born population - Other Eastern Africa (%)
Place of birth for the foreign-born population - Cameroon (%)
Place of birth for the foreign-born population - Congo (%)
Place of birth for the foreign-born population - Democratic Republic of Congo (Zaire) (%)
Place of birth for the foreign-born population - Other Middle Africa (%)
Place of birth for the foreign-born population - Egypt (%)
Place of birth for the foreign-born population - Morocco (%)
Place of birth for the foreign-born population - Sudan (%)
Place of birth for the foreign-born population - Other Northern Africa (%)
Place of birth for the foreign-born population - South Africa (%)
Place of birth for the foreign-born population - Other Southern Africa (%)
Place of birth for the foreign-born population - Cabo Verde (%)
Place of birth for the foreign-born population - Ghana (%)
Place of birth for the foreign-born population - Liberia (%)
Place of birth for the foreign-born population - Nigeria (%)
Place of birth for the foreign-born population - Senegal (%)
Place of birth for the foreign-born population - Sierra Leone (%)
Place of birth for the foreign-born population - Other Western Africa (%)
Place of birth for the foreign-born population - Australia (%)
Place of birth for the foreign-born population - New Zealand (%)
Place of birth for the foreign-born population - Fiji (%)
Place of birth for the foreign-born population - Micronesia (%)
Place of birth for the foreign-born population - Bahamas (%)
Place of birth for the foreign-born population - Barbados (%)
Place of birth for the foreign-born population - Cuba (%)
Place of birth for the foreign-born population - Dominica (%)
Place of birth for the foreign-born population - Dominican Republic (%)
Place of birth for the foreign-born population - Grenada (%)
Place of birth for the foreign-born population - Haiti (%)
Place of birth for the foreign-born population - Jamaica (%)
Place of birth for the foreign-born population - St. Vincent and the Grenadines (%)
Place of birth for the foreign-born population - Trinidad and Tobago (%)
Place of birth for the foreign-born population - West Indies (%)
Place of birth for the foreign-born population - Other Caribbean (%)
Place of birth for the foreign-born population - Belize (%)
Place of birth for the foreign-born population - Costa Rica (%)
Place of birth for the foreign-born population - El Salvador (%)
Place of birth for the foreign-born population - Guatemala (%)
Place of birth for the foreign-born population - Honduras (%)
Place of birth for the foreign-born population - Mexico (%)
Place of birth for the foreign-born population - Nicaragua (%)
Place of birth for the foreign-born population - Panama (%)
Place of birth for the foreign-born population - Other Central America (%)
Place of birth for the foreign-born population - Argentina (%)
Place of birth for the foreign-born population - Bolivia (%)
Place of birth for the foreign-born population - Brazil (%)
Place of birth for the foreign-born population - Chile (%)
Place of birth for the foreign-born population - Colombia (%)
Place of birth for the foreign-born population - Ecuador (%)
Place of birth for the foreign-born population - Guyana (%)
Place of birth for the foreign-born population - Peru (%)
Place of birth for the foreign-born population - Uruguay (%)
Place of birth for the foreign-born population - Venezuela (%)
Place of birth for the foreign-born population - Other South America (%)
Place of birth for the foreign-born population - Canada (%)
Place of birth for the foreign-born population - Other Northern America (%)
Place of birth for the foreign-born population - Other (%)
Latest news about races in Thomasville, NC collected exclusively by city-data.com from local newspapers, TV, and radio stations
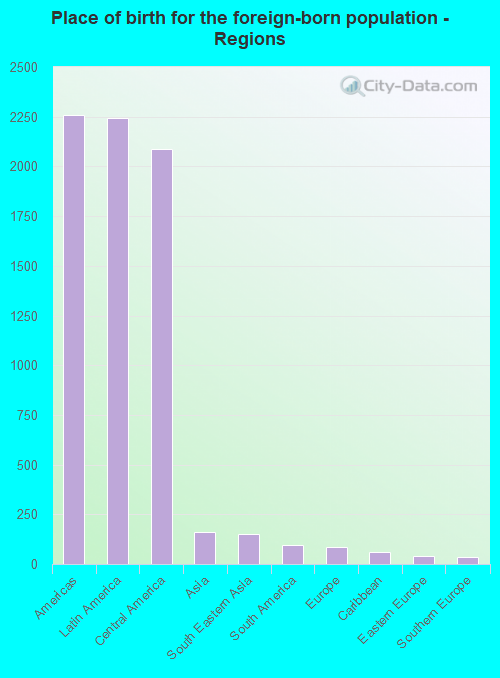
According to 2022 data, the most numerous races in Thomasville, NC are White alone (16,309 residents), Black alone (5,216 residents), and Hispanic (4,768 residents). 83.0% of Thomasville residents speak English at home. 9.1% of Thomasville, NC residents are foreign-born (7.8% born in Latin America), which is 12.2% greater than the foreign-born rate of 8.0% across the entire state of North Carolina.
Race distribution in Thomasville
2000 2022
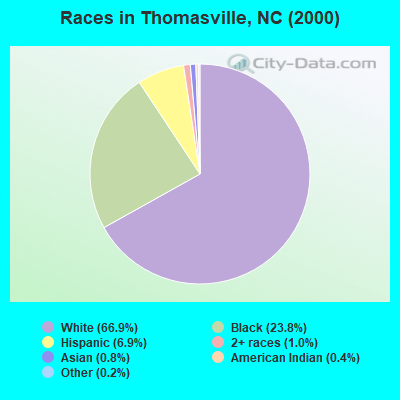
5,647,155 70.2% White alone 1,723,301 21.4% Black alone 378,963 4.7% Hispanic 112,416 1.4% Asian alone 95,333 1.2% American Indian alone 79,965 1.0% Two or more races 9,015 0.1% Other race alone 3,165 0.04% Native Hawaiian and Other
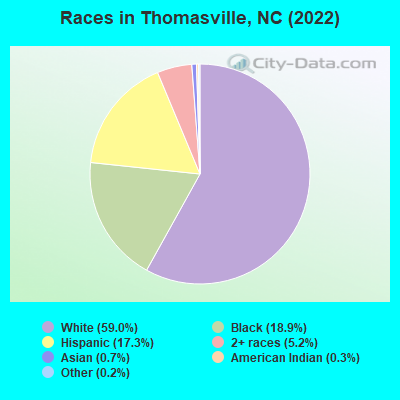
6,497,519 60.7% White alone 2,155,650 20.1% Black alone 1,114,799 10.4% Hispanic 438,061 4.1% Two or more races 341,052 3.2% Asian alone 91,758 0.9% American Indian alone 50,180 0.5% Other race alone 9,954 0.09% Native Hawaiian and Other
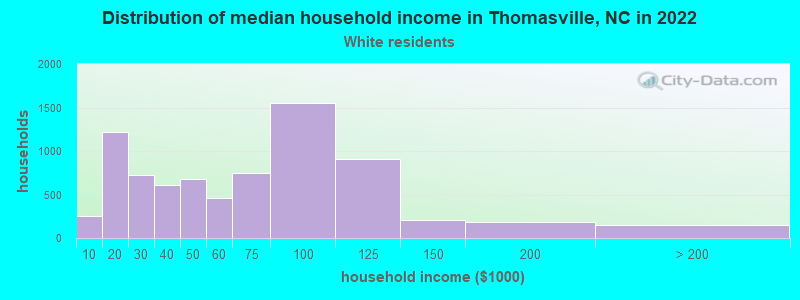
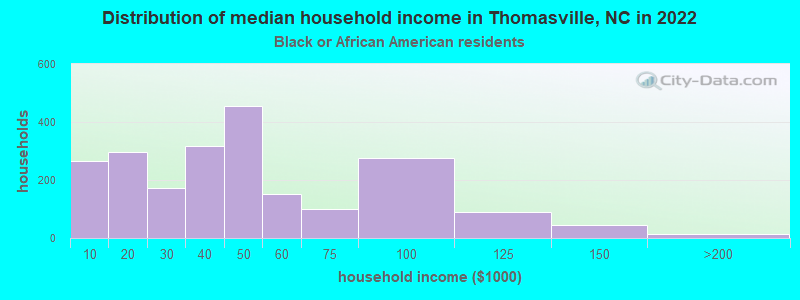
Income and house value in Thomasville Median household income in 2022 $59,358 White non-Hispanic householders$53,527 Black householders$84,706 Some other race householders$84,051 Two or more races householders$84,805 Hispanic or Latino race householdersMedian 2022 house value $180,839 White Non-Hispanic householders$152,781 Black or African American householders $460,317 Asian householders$169,440 Two or more races householders$188,072 Hispanic or Latino householders
Median age by race in Thomasville
42.3 Median age for White residents42.4 42.8 38.8 Median age for Black or African American residents37.6 37.0 32.4 Median age for American Indian / Alaska Native residents32.2 -682,971,013.8 51.5 Median age for Asian residents40.4 54.7 -666,666,666.0 Median age for Native Hawaiian / Pacific Islander residents-666,666,666.0 -666,666,666.0 18.1 Median age for Other race residents25.1 20.3 21.4 Median age for Two or more races residents22.1 21.0 44.2 Median age for White alone residents43.5 44.9 25.2 Median age for Hispanic or Latino residents25.1 25.2
Owner/renter occupied households by race in Thomasville
House owners and renters - White residents 4,839 64.1% Owner occupied2,710 35.9% Renter occupiedHouse owners and renters - Black or African American residents 932 44.5% Owner occupied1,163 55.5% Renter occupiedHouse owners and renters - American Indian / Alaska Native residents 15 100.0% Owner occupiedHouse owners and renters - Asian residents 113 96.3% Owner occupied4 3.7% Renter occupiedHouse owners and renters - Other race residents 146 37.8% Owner occupied241 62.2% Renter occupiedHouse owners and renters - Two or more races residents 506 54.3% Owner occupied426 45.7% Renter occupiedHouse owners and renters - White alone residents 4,496 63.7% Owner occupied2,556 36.3% Renter occupiedHouse owners and renters - Hispanic or Latino residents 730 61.1% Owner occupied465 38.9% Renter occupied
Language usage in Thomasville
English speakers - Total 83.0% of residents of Thomasville speak English at home.
17.8% of residents speak Spanish at home 2,382 52.5% Speak English very well2,154 47.5% Speak English less than very well1.4% of residents speak other language at home 229 64.3% Speak English very well127 35.7% Speak English less than very well
English speakers - Born in the United States 89.0% of residents of Thomasville speak English at home.
6.9% of residents speak Spanish at home 368 96.6% Speak English very well13 3.4% Speak English less than very well3.0% of residents speak other language at home 164 100.0% Speak English very well
English speakers - Native, born elsewhere 51.7% of residents of Thomasville speak English at home.
47.2% of residents speak Spanish at home 51 61.4% Speak English very well32 38.6% Speak English less than very well
English speakers - Foreign-born 13.4% of residents of Thomasville speak English at home.
96.4% of residents speak Spanish at home 283 12.3% Speak English very well2,021 87.7% Speak English less than very well7.2% of residents speak other language at home 42 24.3% Speak English very well131 75.7% Speak English less than very well
White (Caucasian) - Speak only English Native:
94.9% (14,814)Foreign-born:
24.2% (102)
White (Caucasian) - Speak another language Native:
3.6% (559)Foreign-born:
100.0% (422)
Black or African American - Speak only English Native:
99.4% (4,483)Foreign-born:
80.9% (36)
Black or African American - Speak another language Native:
0.7% (32)Foreign-born:
19.8% (9)
Asian - Speak only English Native:
98.6% (27)Foreign-born:
10.9% (18)
Other race - Speak only English Native:
42.9% (107)Foreign-born:
15.4% (101)
Other race - Speak another language Native:
57.4% (143)Foreign-born:
83.5% (546)
Two or more races - Speak only English Native:
44.2% (1,353)Foreign-born:
0.3% (5)
Two or more races - Speak another language Native:
66.9% (2,049)Foreign-born:
100.0% (1,637)
White alone - Speak only English Native:
98.2% (14,774)Foreign-born:
42.9% (28)
White alone - Speak another language Native:
1.8% (277)Foreign-born:
55.2% (35)
Hispanic or Latino - Speak only English Native:
10.6% (244)Foreign-born:
3.4% (71)
Hispanic or Latino - Speak another language Native:
100.0% (2,299)Foreign-born:
95.5% (1,992)
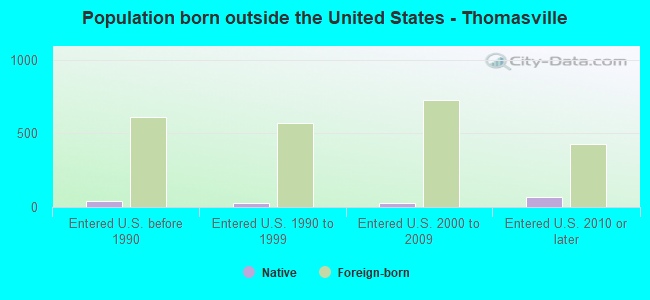
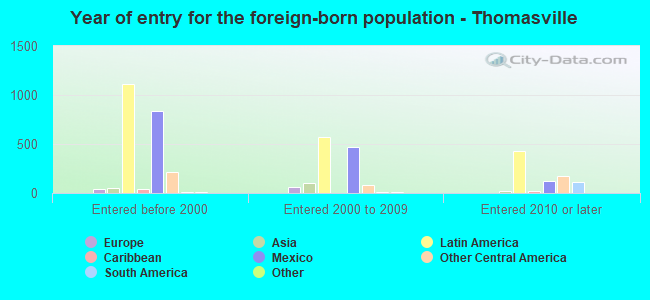
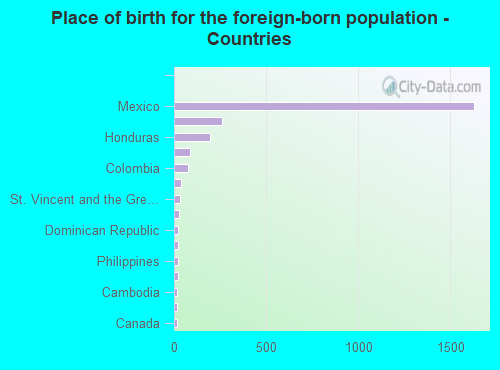
Foreign-born residents in Thomasville 2,518 residents are foreign born (7.8% Latin America ).
This city:
9.1%North Carolina:
8.3%
Marital status for residents in Thomasville Marital status - White (Caucasian) population 15 years and over
Males 27.5% Never married53.2% Now married2.0% Separated2.7% Widowed14.7% DivorcedFemales 21.9% Never married44.7% Now married3.8% Separated15.0% Widowed14.6% DivorcedWomen who gave birth in the past 12 months Now married:
45.8% (135)Unmarried:
54.2% (160)
Women who did not give birth in the past 12 months Now married:
51.8% (1,756)Unmarried:
48.2% (1,634)
Marital status - Black or African American population 15 years and over
Males 43.4% Never married42.4% Now married2.6% Separated3.3% Widowed8.2% DivorcedFemales 47.9% Never married26.9% Now married3.2% Separated16.2% Widowed5.9% DivorcedWomen who gave birth in the past 12 months Now married:
0.0% (0)Unmarried:
100.0% (83)
Women who did not give birth in the past 12 months Now married:
20.8% (225)Unmarried:
79.2% (853)
Marital status - American Indian / Alaska Native population 15 years and over
Males 0.0% Never married100.0% Now married0.0% Separated0.0% Widowed0.0% DivorcedFemales 0.0% Never married100.0% Now married0.0% Separated0.0% Widowed0.0% DivorcedMarital status - Asian population 15 years and over
Males 33.3% Never married66.7% Now married0.0% Separated0.0% Widowed0.0% DivorcedFemales 8.3% Never married42.2% Now married9.2% Separated40.4% Widowed0.0% DivorcedWomen who did not give birth in the past 12 months Now married:
64.0% (17)Unmarried:
36.0% (9)
Marital status - Other race population 15 years and over
Males 49.6% Never married36.1% Now married0.0% Separated7.0% Widowed7.3% DivorcedFemales 48.4% Never married43.3% Now married0.0% Separated0.0% Widowed8.3% DivorcedWomen who did not give birth in the past 12 months Now married:
40.5% (93)Unmarried:
59.5% (137)
Marital status - Two or more races population 15 years and over
Males 39.4% Never married47.5% Now married6.1% Separated0.0% Widowed6.9% DivorcedFemales 39.6% Never married53.4% Now married1.2% Separated1.7% Widowed4.1% DivorcedWomen who gave birth in the past 12 months Now married:
100.0% (25)Unmarried:
0.0% (0)
Women who did not give birth in the past 12 months Now married:
57.5% (463)Unmarried:
42.5% (342)
Marital status - White alone, not Hispanic / Latino population 15 years and over
Males 24.9% Never married55.0% Now married2.3% Separated3.0% Widowed14.9% DivorcedFemales 19.9% Never married45.4% Now married3.9% Separated15.6% Widowed15.1% DivorcedWomen who gave birth in the past 12 months Now married:
53.2% (140)Unmarried:
46.8% (123)
Women who did not give birth in the past 12 months Now married:
51.9% (1,597)Unmarried:
48.1% (1,482)
Marital status - Hispanic or Latino population 15 years and over
Males 48.9% Never married39.1% Now married2.5% Separated1.5% Widowed8.1% DivorcedFemales 49.6% Never married40.7% Now married1.0% Separated3.3% Widowed5.4% DivorcedWomen who gave birth in the past 12 months Now married:
29.5% (19)Unmarried:
70.5% (45)
Women who did not give birth in the past 12 months Now married:
45.1% (436)Unmarried:
54.9% (530)
Ancestries in Thomasville
1,433 11.1% English1,296 10.0% Irish1,277 9.9% American870 6.7% German493 3.8% Scottish275 2.1% European194 1.5% West Indian163 1.3% Brazilian141 1.1% African136 1.1% Italian122 0.9% Scotch-Irish60 0.5% Ukrainian36 0.3% Dutch36 0.3% Polish22 0.2% French18 0.1% Welsh11 0.09% Canadian10 0.08% Eastern European5 0.04% Egyptian
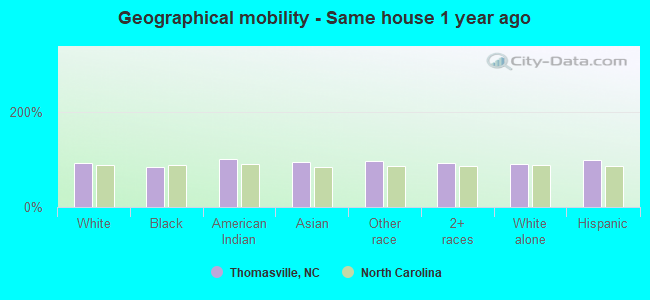
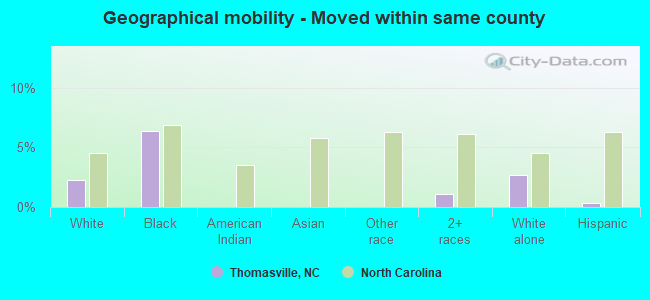
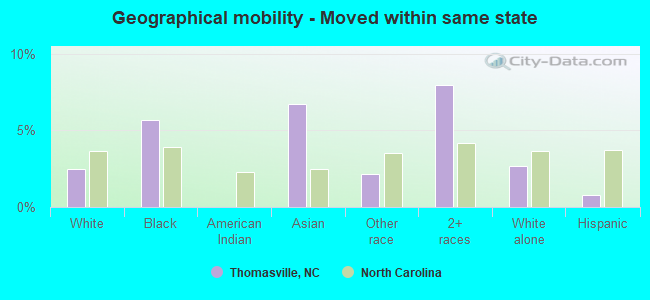
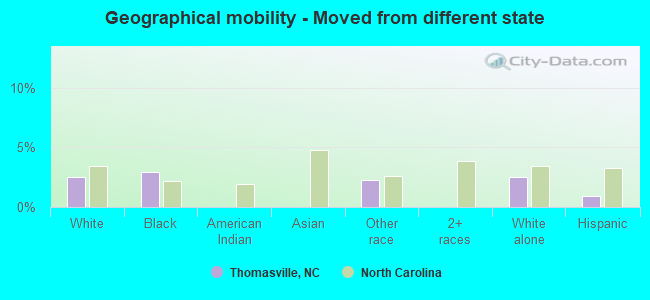
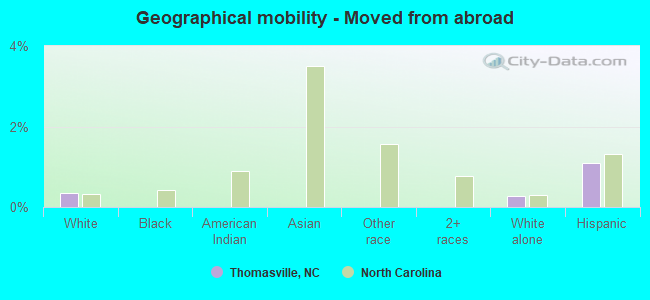
Geographical mobility in Thomasville Same house 1 year ago 15,955 91.9% White (Caucasian)4,338 83.2% Black or African American61 100.0% American Indian / Alaska Native195 93.7% Asian1,009 96.1% Other race3,821 92.9% Two or more races14,658 91.2% White alone, not Hispanic / Latino4,536 98.6% Hispanic or LatinoMoved within same county 389 2.2% White / Caucasian334 6.4% Black or African American45 1.1% Two or more races435 2.7% White alone, not Hispanic / Latino15 0.3% Hispanic or LatinoMoved within same state 434 2.5% White / Caucasian296 5.7% Black or African American14 6.7% Asian23 2.2% Other race328 8.0% Two or more races429 2.7% White alone, not Hispanic / Latino35 0.8% Hispanic or LatinoMoved from different state 444 2.6% White / Caucasian153 2.9% Black or African American24 2.3% Other race399 2.5% White alone, not Hispanic / Latino43 0.9% Hispanic or LatinoMoved from abroad 61 0.4% White43 0.3% White alone, not Hispanic / Latino50 1.1% Hispanic or Latino
Children Nativity (place of birth) in Thomasville
Children under 6 years - Living with two parents Both parents native 995 100.0% NativeBoth parents foreign-born 121 100.0% NativeOne native, one foreign-born parent 51 100.0% NativeChildren under 6 years - Living with one parent Native parent 1,247 100.0% NativeForeign-born parent 168 100.0% NativeChildren 6 to 17 years - Living with two parents Both parents native 1,863 100.0% NativeBoth parents foreign-born 175 64.5% Native96 35.5% Foreign-bornOne native, one foreign-born parent 22 100.0% NativeChildren 6 to 17 years - Living with one parent Native parent 1,185 100.0% NativeForeign-born parent 172 48.4% Native184 51.6% Foreign-born
Grandparents responsible for own grandchildren in Thomasville
Grandparents (30 to 59 years) White / Caucasian 272 74.0% Responsible for grandchildren96 26.0% Not responsible for grandchildrenBlack or African American 11 100.0% Not responsible for grandchildrenTwo or more races 226 100.0% Not responsible for grandchildrenWhite alone, not Hispanic / Latino 191 66.7% Responsible for grandchildren96 33.3% Not responsible for grandchildrenHispanic or Latino 35 15.9% Responsible for grandchildren184 84.1% Not responsible for grandchildrenGrandparents (60 years and over) White / Caucasian 39 32.9% Responsible for grandchildren79 67.1% Not responsible for grandchildrenBlack or African American 65 41.8% Responsible for grandchildren91 58.2% Not responsible for grandchildrenWhite alone, not Hispanic / Latino 39 37.3% Responsible for grandchildren65 62.7% Not responsible for grandchildrenHispanic or Latino 10 100.0% Not responsible for grandchildren