Races in The Hammocks, Florida (FL) Detailed Stats
Data:
Races - White alone (%)
Races - White alone (% change since 2000)
Races - Black alone (%)
Races - Black alone (% change since 2000)
Races - American Indian alone (%)
Races - American Indian alone (% change since 2000)
Races - Asian alone (%)
Races - Asian alone (% change since 2000)
Races - Hispanic (%)
Races - Hispanic (% change since 2000)
Races - Native Hawaiian and Other Pacific Islander alone (%)
Races - Native Hawaiian and Other Pacific Islander alone (% change since 2000)
Races - Two or more races(%)
Races - Two or more races(% change since 2000)
Races - Other race alone (%)
Races - Other race alone (% change since 2000)
Racial diversity
Place of birth - Born in state of residence (%)
Place of birth - Born in state of residence (%) - White
Place of birth - Born in state of residence (%) - Black or African American
Place of birth - Born in state of residence (%) - Asian
Place of birth - Born in state of residence (%) - Hispanic or Latino
Place of birth - Born in state of residence (%) - American Indian and Alaska Native
Place of birth - Born in state of residence (%) - Multirace
Place of birth - Born in state of residence (%) - Other Race
Place of birth - Born in other state (%)
Place of birth - Born in other state (%) - White
Place of birth - Born in other state (%) - Black or African American
Place of birth - Born in other state (%) - Asian
Place of birth - Born in other state (%) - Hispanic or Latino
Place of birth - Born in other state (%) - American Indian and Alaska Native
Place of birth - Born in other state (%) - Multirace
Place of birth - Born in other state (%) - Other Race
Place of birth - Native, outside of US (%)
Place of birth - Native, outside of US (%) - White
Place of birth - Native, outside of US (%) - Black or African American
Place of birth - Native, outside of US (%) - Asian
Place of birth - Native, outside of US (%) - Hispanic or Latino
Place of birth - Native, outside of US (%) - American Indian and Alaska Native
Place of birth - Native, outside of US (%) - Multirace
Place of birth - Native, outside of US (%) - Other Race
Place of birth - Foreign born (%)
Place of birth - Foreign born (%) - White
Place of birth - Foreign born (%) - Black or African American
Place of birth - Foreign born (%) - Asian
Place of birth - Foreign born (%) - Hispanic or Latino
Place of birth - Foreign born (%) - American Indian and Alaska Native
Place of birth - Foreign born (%) - Multirace
Place of birth - Foreign born (%) - Other Race
Residents speaking English at home (%)
Residents speaking English at home - Born in the United States (%)
Residents speaking English at home - Native, born elsewhere (%)
Residents speaking English at home - Foreign born (%)
Residents speaking Spanish at home (%)
Residents speaking Spanish at home - Born in the United States (%)
Residents speaking Spanish at home - Native, born elsewhere (%)
Residents speaking Spanish at home - Foreign born (%)
Residents speaking other language at home (%)
Residents speaking other language at home - Born in the United States (%)
Residents speaking other language at home - Native, born elsewhere (%)
Residents speaking other language at home - Foreign born (%)
Marital status - Never married (%)
Marital status - Now married (%)
Marital status - Separated (%)
Marital status - Widowed (%)
Marital status - Divorced (%)
Ancestries Reported - Arab (%)
Ancestries Reported - Czech (%)
Ancestries Reported - Danish (%)
Ancestries Reported - Dutch (%)
Ancestries Reported - English (%)
Ancestries Reported - French (%)
Ancestries Reported - French Canadian (%)
Ancestries Reported - German (%)
Ancestries Reported - Greek (%)
Ancestries Reported - Hungarian (%)
Ancestries Reported - Irish (%)
Ancestries Reported - Italian (%)
Ancestries Reported - Lithuanian (%)
Ancestries Reported - Norwegian (%)
Ancestries Reported - Polish (%)
Ancestries Reported - Portuguese (%)
Ancestries Reported - Russian (%)
Ancestries Reported - Scotch-Irish (%)
Ancestries Reported - Scottish (%)
Ancestries Reported - Slovak (%)
Ancestries Reported - Subsaharan African (%)
Ancestries Reported - Swedish (%)
Ancestries Reported - Swiss (%)
Ancestries Reported - Ukrainian (%)
Ancestries Reported - United States (%)
Ancestries Reported - Welsh (%)
Ancestries Reported - West Indian (%)
Ancestries Reported - Other (%)
Geographical mobility - Same house 1 year ago (%)
Geographical mobility - Same house 1 year ago (%) - White
Geographical mobility - Same house 1 year ago (%) - Black or African American
Geographical mobility - Same house 1 year ago (%) - Asian
Geographical mobility - Same house 1 year ago (%) - Hispanic or Latino
Geographical mobility - Same house 1 year ago (%) - American Indian and Alaska Native
Geographical mobility - Same house 1 year ago (%) - Multirace
Geographical mobility - Same house 1 year ago (%) - Other Race
Geographical mobility - Moved within same county (%)
Geographical mobility - Moved within same county (%) - White
Geographical mobility - Moved within same county (%) - Black or African American
Geographical mobility - Moved within same county (%) - Asian
Geographical mobility - Moved within same county (%) - Hispanic or Latino
Geographical mobility - Moved within same county (%) - American Indian and Alaska Native
Geographical mobility - Moved within same county (%) - Multirace
Geographical mobility - Moved within same county (%) - Other Race
Geographical mobility - Moved from different county within same state (%)
Geographical mobility - Moved from different county within same state (%) - White
Geographical mobility - Moved from different county within same state (%) - Black or African American
Geographical mobility - Moved from different county within same state (%) - Asian
Geographical mobility - Moved from different county within same state (%) - Hispanic or Latino
Geographical mobility - Moved from different county within same state (%) - American Indian and Alaska Native
Geographical mobility - Moved from different county within same state (%) - Multirace
Geographical mobility - Moved from different county within same state (%) - Other Race
Geographical mobility - Moved from different state (%)
Geographical mobility - Moved from different state (%) - White
Geographical mobility - Moved from different state (%) - Black or African American
Geographical mobility - Moved from different state (%) - Asian
Geographical mobility - Moved from different state (%) - Hispanic or Latino
Geographical mobility - Moved from different state (%) - American Indian and Alaska Native
Geographical mobility - Moved from different state (%) - Multirace
Geographical mobility - Moved from different state (%) - Other Race
Geographical mobility - Moved from abroad (%)
Geographical mobility - Moved from abroad (%) - White
Geographical mobility - Moved from abroad (%) - Black or African American
Geographical mobility - Moved from abroad (%) - Asian
Geographical mobility - Moved from abroad (%) - Hispanic or Latino
Geographical mobility - Moved from abroad (%) - American Indian and Alaska Native
Geographical mobility - Moved from abroad (%) - Multirace
Geographical mobility - Moved from abroad (%) - Other Race
Place of birth for the foreign-born population - Ireland (%)
Place of birth for the foreign-born population - Denmark (%)
Place of birth for the foreign-born population - Norway (%)
Place of birth for the foreign-born population - Sweden (%)
Place of birth for the foreign-born population - United Kingdom (%)
Place of birth for the foreign-born population - England (%)
Place of birth for the foreign-born population - Scotland (%)
Place of birth for the foreign-born population - Other Northern Europe (%)
Place of birth for the foreign-born population - Austria (%)
Place of birth for the foreign-born population - Belgium (%)
Place of birth for the foreign-born population - France (%)
Place of birth for the foreign-born population - Germany (%)
Place of birth for the foreign-born population - Netherlands (%)
Place of birth for the foreign-born population - Switzerland (%)
Place of birth for the foreign-born population - Other Western Europe (%)
Place of birth for the foreign-born population - Greece (%)
Place of birth for the foreign-born population - Italy (%)
Place of birth for the foreign-born population - Portugal (%)
Place of birth for the foreign-born population - Spain (%)
Place of birth for the foreign-born population - Other Southern Europe (%)
Place of birth for the foreign-born population - Albania (%)
Place of birth for the foreign-born population - Belarus (%)
Place of birth for the foreign-born population - Bosnia and Herzegovina (%)
Place of birth for the foreign-born population - Bulgaria (%)
Place of birth for the foreign-born population - Croatia (%)
Place of birth for the foreign-born population - Czechoslovakia (%)
Place of birth for the foreign-born population - Hungary (%)
Place of birth for the foreign-born population - Latvia (%)
Place of birth for the foreign-born population - Lithuania (%)
Place of birth for the foreign-born population - North Macedonia (Macedonia) (%)
Place of birth for the foreign-born population - Moldova (%)
Place of birth for the foreign-born population - Poland (%)
Place of birth for the foreign-born population - Romania (%)
Place of birth for the foreign-born population - Russia (%)
Place of birth for the foreign-born population - Serbia (%)
Place of birth for the foreign-born population - Ukraine (%)
Place of birth for the foreign-born population - Other Eastern Europe (%)
Place of birth for the foreign-born population - China (%)
Place of birth for the foreign-born population - Hong Kong (%)
Place of birth for the foreign-born population - Taiwan (%)
Place of birth for the foreign-born population - Japan (%)
Place of birth for the foreign-born population - Korea (%)
Place of birth for the foreign-born population - Other Eastern Asia (%)
Place of birth for the foreign-born population - Afghanistan (%)
Place of birth for the foreign-born population - Bangladesh (%)
Place of birth for the foreign-born population - India (%)
Place of birth for the foreign-born population - Iran (%)
Place of birth for the foreign-born population - Kazakhstan (%)
Place of birth for the foreign-born population - Nepal (%)
Place of birth for the foreign-born population - Pakistan (%)
Place of birth for the foreign-born population - Sri Lanka (%)
Place of birth for the foreign-born population - Uzbekistan (%)
Place of birth for the foreign-born population - Other South Central Asia (%)
Place of birth for the foreign-born population - Burma (%)
Place of birth for the foreign-born population - Cambodia (%)
Place of birth for the foreign-born population - Indonesia (%)
Place of birth for the foreign-born population - Laos (%)
Place of birth for the foreign-born population - Malaysia (%)
Place of birth for the foreign-born population - Philippines (%)
Place of birth for the foreign-born population - Singapore (%)
Place of birth for the foreign-born population - Thailand (%)
Place of birth for the foreign-born population - Vietnam (%)
Place of birth for the foreign-born population - Other South Eastern Asia (%)
Place of birth for the foreign-born population - Armenia (%)
Place of birth for the foreign-born population - Iraq (%)
Place of birth for the foreign-born population - Israel (%)
Place of birth for the foreign-born population - Jordan (%)
Place of birth for the foreign-born population - Kuwait (%)
Place of birth for the foreign-born population - Lebanon (%)
Place of birth for the foreign-born population - Saudi Arabia (%)
Place of birth for the foreign-born population - Syria (%)
Place of birth for the foreign-born population - Turkey (%)
Place of birth for the foreign-born population - Yemen (%)
Place of birth for the foreign-born population - Other Western Asia (%)
Place of birth for the foreign-born population - Eritrea (%)
Place of birth for the foreign-born population - Ethiopia (%)
Place of birth for the foreign-born population - Kenya (%)
Place of birth for the foreign-born population - Somalia (%)
Place of birth for the foreign-born population - Uganda (%)
Place of birth for the foreign-born population - Zimbabwe (%)
Place of birth for the foreign-born population - Other Eastern Africa (%)
Place of birth for the foreign-born population - Cameroon (%)
Place of birth for the foreign-born population - Congo (%)
Place of birth for the foreign-born population - Democratic Republic of Congo (Zaire) (%)
Place of birth for the foreign-born population - Other Middle Africa (%)
Place of birth for the foreign-born population - Egypt (%)
Place of birth for the foreign-born population - Morocco (%)
Place of birth for the foreign-born population - Sudan (%)
Place of birth for the foreign-born population - Other Northern Africa (%)
Place of birth for the foreign-born population - South Africa (%)
Place of birth for the foreign-born population - Other Southern Africa (%)
Place of birth for the foreign-born population - Cabo Verde (%)
Place of birth for the foreign-born population - Ghana (%)
Place of birth for the foreign-born population - Liberia (%)
Place of birth for the foreign-born population - Nigeria (%)
Place of birth for the foreign-born population - Senegal (%)
Place of birth for the foreign-born population - Sierra Leone (%)
Place of birth for the foreign-born population - Other Western Africa (%)
Place of birth for the foreign-born population - Australia (%)
Place of birth for the foreign-born population - New Zealand (%)
Place of birth for the foreign-born population - Fiji (%)
Place of birth for the foreign-born population - Micronesia (%)
Place of birth for the foreign-born population - Bahamas (%)
Place of birth for the foreign-born population - Barbados (%)
Place of birth for the foreign-born population - Cuba (%)
Place of birth for the foreign-born population - Dominica (%)
Place of birth for the foreign-born population - Dominican Republic (%)
Place of birth for the foreign-born population - Grenada (%)
Place of birth for the foreign-born population - Haiti (%)
Place of birth for the foreign-born population - Jamaica (%)
Place of birth for the foreign-born population - St. Vincent and the Grenadines (%)
Place of birth for the foreign-born population - Trinidad and Tobago (%)
Place of birth for the foreign-born population - West Indies (%)
Place of birth for the foreign-born population - Other Caribbean (%)
Place of birth for the foreign-born population - Belize (%)
Place of birth for the foreign-born population - Costa Rica (%)
Place of birth for the foreign-born population - El Salvador (%)
Place of birth for the foreign-born population - Guatemala (%)
Place of birth for the foreign-born population - Honduras (%)
Place of birth for the foreign-born population - Mexico (%)
Place of birth for the foreign-born population - Nicaragua (%)
Place of birth for the foreign-born population - Panama (%)
Place of birth for the foreign-born population - Other Central America (%)
Place of birth for the foreign-born population - Argentina (%)
Place of birth for the foreign-born population - Bolivia (%)
Place of birth for the foreign-born population - Brazil (%)
Place of birth for the foreign-born population - Chile (%)
Place of birth for the foreign-born population - Colombia (%)
Place of birth for the foreign-born population - Ecuador (%)
Place of birth for the foreign-born population - Guyana (%)
Place of birth for the foreign-born population - Peru (%)
Place of birth for the foreign-born population - Uruguay (%)
Place of birth for the foreign-born population - Venezuela (%)
Place of birth for the foreign-born population - Other South America (%)
Place of birth for the foreign-born population - Canada (%)
Place of birth for the foreign-born population - Other Northern America (%)
Place of birth for the foreign-born population - Other (%)
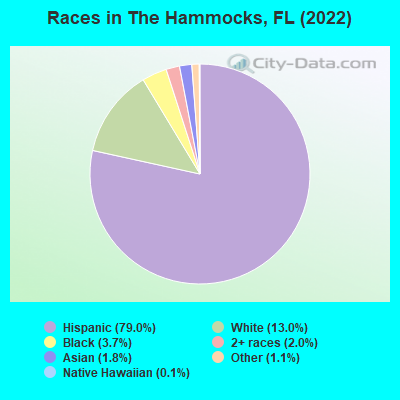
According to 2022 data, the most numerous races in The Hammocks, FL are White alone (7,734 residents), Hispanic (47,004 residents), and Black alone (2,188 residents). 17.1% of The Hammocks residents speak English at home. 55.8% of The Hammocks, FL residents are foreign-born (52.0% born in Latin America), which is 62.3% greater than the foreign-born rate of 21.0% across the entire state of Florida.
Race distribution in The Hammocks
2000 2022
10,458,509 65.4% White alone 2,682,715 16.8% Hispanic 2,264,268 14.2% Black alone 261,693 1.6% Asian alone 236,954 1.5% Two or more races 42,358 0.3% American Indian alone 28,994 0.2% Other race alone 6,887 0.04% Native Hawaiian and Other
11,309,403 50.8% White alone 6,025,039 27.1% Hispanic 3,241,015 14.6% Black alone 861,630 3.9% Two or more races 623,692 2.8% Asian alone 152,054 0.7% Other race alone 22,504 0.1% American Indian alone 9,486 0.04% Native Hawaiian and Other
Income and house value in The Hammocks Median household income in 2022 $95,358 White non-Hispanic householders$63,594 Black householders$85,031 American Indian and Alaska Native householders$70,636 Asian householders$90,644 Some other race householders$67,559 Two or more races householders$81,254 Hispanic or Latino race householdersMedian 2022 house value $503,996 White Non-Hispanic householders$464,178 Black or African American householders$336,834 American Indian or Alaska Native householders $495,028 Asian householders$483,907 Some other race householders$480,320 Two or more races householders$486,060 Hispanic or Latino householders
Median age by race in The Hammocks
35.6 Median age for White residents33.2 36.9 40.9 Median age for Black or African American residents37.2 41.4 24.9 Median age for American Indian / Alaska Native residents20.6 48.4 43.8 Median age for Asian residents44.8 42.6 -679,849,340.2 Median age for Native Hawaiian / Pacific Islander residents-858,307,848.3 -443,298,968.6 41.0 Median age for Other race residents38.5 43.4 47.2 Median age for Two or more races residents44.9 49.0 32.2 Median age for White alone residents33.0 30.2 42.7 Median age for Hispanic or Latino residents40.8 45.6
Owner/renter occupied households by race in The Hammocks
House owners and renters - White residents 3,892 66.2% Owner occupied1,991 33.8% Renter occupiedHouse owners and renters - Black or African American residents 383 40.1% Owner occupied571 59.9% Renter occupiedHouse owners and renters - American Indian / Alaska Native residents 19 19.8% Owner occupied78 80.2% Renter occupiedHouse owners and renters - Asian residents 293 75.0% Owner occupied98 25.0% Renter occupiedHouse owners and renters - Other race residents 1,178 47.4% Owner occupied1,309 52.6% Renter occupiedHouse owners and renters - Two or more races residents 6,988 65.1% Owner occupied3,754 34.9% Renter occupiedHouse owners and renters - White alone residents 1,462 60.4% Owner occupied958 39.6% Renter occupiedHouse owners and renters - Hispanic or Latino residents 9,912 62.8% Owner occupied5,869 37.2% Renter occupied
Language usage in The Hammocks
English speakers - Total 17.1% of residents of The Hammocks speak English at home.
78.5% of residents speak Spanish at home 28,503 63.9% Speak English very well16,097 36.1% Speak English less than very well4.0% of residents speak other language at home 1,818 80.9% Speak English very well428 19.1% Speak English less than very well
English speakers - Born in the United States 43.0% of residents of The Hammocks speak English at home.
53.8% of residents speak Spanish at home 2,940 91.4% Speak English very well276 8.6% Speak English less than very well2.5% of residents speak other language at home 147 100.0% Speak English very well
English speakers - Native, born elsewhere 11.9% of residents of The Hammocks speak English at home.
78.9% of residents speak Spanish at home 1,076 74.6% Speak English very well367 25.4% Speak English less than very well5.8% of residents speak other language at home 106 100.0% Speak English very well
English speakers - Foreign-born 5.6% of residents of The Hammocks speak English at home.
88.5% of residents speak Spanish at home 14,360 49.0% Speak English very well14,921 51.0% Speak English less than very well5.3% of residents speak other language at home 1,353 77.0% Speak English very well405 23.0% Speak English less than very well
White (Caucasian) - Speak only English Native:
44.7% (4,688)Foreign-born:
5.7% (368)
White (Caucasian) - Speak another language Native:
51.7% (5,424)Foreign-born:
92.8% (5,955)
Black or African American - Speak only English Native:
83.7% (1,130)Foreign-born:
34.9% (333)
Black or African American - Speak another language Native:
16.3% (219)Foreign-born:
65.8% (628)
American Indian / Alaska Native - Speak only English Native:
5.6% (13)Foreign-born:
31.8% (9)
American Indian / Alaska Native - Speak another language Native:
100.0% (229)Foreign-born:
76.4% (22)
Asian - Speak only English Native:
63.7% (195)Foreign-born:
30.7% (249)
Asian - Speak another language Native:
36.7% (112)Foreign-born:
67.0% (543)
Other race - Speak only English Native:
16.2% (479)Foreign-born:
5.5% (258)
Other race - Speak another language Native:
83.8% (2,479)Foreign-born:
94.5% (4,407)
Two or more races - Speak only English Native:
18.9% (1,664)Foreign-born:
3.4% (708)
Two or more races - Speak another language Native:
81.1% (7,152)Foreign-born:
96.5% (20,048)
White alone - Speak only English Native:
61.6% (3,783)Foreign-born:
34.7% (432)
White alone - Speak another language Native:
37.5% (2,306)Foreign-born:
67.4% (839)
Hispanic or Latino - Speak only English Native:
14.4% (2,167)Foreign-born:
2.1% (632)
Hispanic or Latino - Speak another language Native:
85.5% (12,876)Foreign-born:
97.8% (28,965)
Foreign-born residents in The Hammocks 33,197 residents are foreign born (52.0% Latin America ).
This city:
55.8%Florida:
21.1%
Marital status for residents in The Hammocks Marital status - White (Caucasian) population 15 years and over
Males 34.3% Never married57.8% Now married1.9% Separated1.1% Widowed4.9% DivorcedFemales 28.5% Never married49.5% Now married3.1% Separated6.9% Widowed12.0% DivorcedWomen who gave birth in the past 12 months Now married:
85.8% (199)Unmarried:
14.2% (33)
Women who did not give birth in the past 12 months Now married:
46.9% (1,906)Unmarried:
53.1% (2,156)
Marital status - Black or African American population 15 years and over
Males 29.5% Never married50.3% Now married0.7% Separated0.2% Widowed19.3% DivorcedFemales 34.5% Never married43.2% Now married3.6% Separated1.2% Widowed17.6% DivorcedWomen who did not give birth in the past 12 months Now married:
30.6% (149)Unmarried:
69.4% (337)
Marital status - American Indian / Alaska Native population 15 years and over
Males 84.2% Never married4.2% Now married0.0% Separated0.0% Widowed11.6% DivorcedFemales 82.6% Never married17.4% Now married0.0% Separated0.0% Widowed0.0% DivorcedWomen who did not give birth in the past 12 months Now married:
14.6% (21)Unmarried:
85.4% (121)
Marital status - Asian population 15 years and over
Males 33.5% Never married63.9% Now married0.0% Separated0.0% Widowed2.6% DivorcedFemales 13.6% Never married70.4% Now married4.0% Separated8.9% Widowed3.1% DivorcedWomen who did not give birth in the past 12 months Now married:
75.4% (249)Unmarried:
24.6% (81)
Marital status - Other race population 15 years and over
Males 31.3% Never married59.2% Now married1.4% Separated0.0% Widowed8.0% DivorcedFemales 26.0% Never married49.0% Now married0.4% Separated7.0% Widowed17.6% DivorcedWomen who gave birth in the past 12 months Now married:
46.5% (84)Unmarried:
53.5% (96)
Women who did not give birth in the past 12 months Now married:
44.5% (804)Unmarried:
55.5% (1,005)
Marital status - Two or more races population 15 years and over
Males 32.3% Never married59.6% Now married1.3% Separated1.3% Widowed5.5% DivorcedFemales 27.1% Never married50.0% Now married1.6% Separated5.4% Widowed15.9% DivorcedWomen who gave birth in the past 12 months Now married:
100.0% (57)Unmarried:
0.0% (0)
Women who did not give birth in the past 12 months Now married:
47.4% (3,212)Unmarried:
52.6% (3,557)
Marital status - White alone, not Hispanic / Latino population 15 years and over
Males 36.7% Never married54.5% Now married0.5% Separated1.1% Widowed7.2% DivorcedFemales 33.0% Never married55.3% Now married0.0% Separated6.0% Widowed5.7% DivorcedWomen who gave birth in the past 12 months Now married:
84.9% (43)Unmarried:
15.1% (8)
Women who did not give birth in the past 12 months Now married:
49.6% (839)Unmarried:
50.4% (851)
Marital status - Hispanic or Latino population 15 years and over
Males 32.7% Never married59.1% Now married1.9% Separated1.1% Widowed5.2% DivorcedFemales 27.3% Never married48.9% Now married2.6% Separated6.3% Widowed14.9% DivorcedWomen who gave birth in the past 12 months Now married:
76.6% (385)Unmarried:
23.4% (118)
Women who did not give birth in the past 12 months Now married:
46.7% (5,132)Unmarried:
53.3% (5,856)
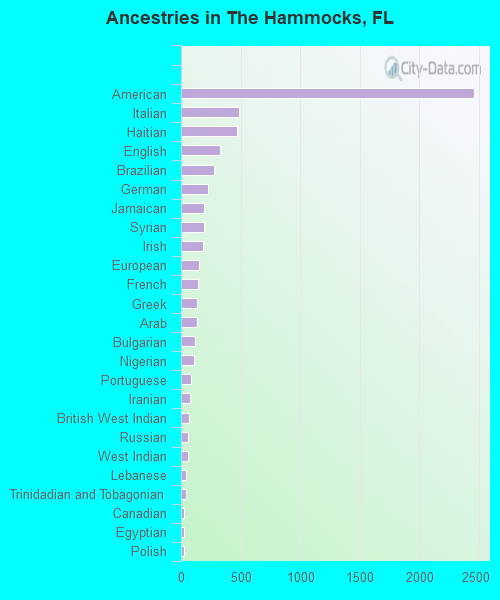
Ancestries in The Hammocks
2,460 5.7% American489 1.1% Italian468 1.1% Haitian323 0.8% English276 0.6% Brazilian227 0.5% German195 0.5% Jamaican192 0.4% Syrian188 0.4% Irish155 0.4% European146 0.3% French134 0.3% Greek131 0.3% Arab121 0.3% Bulgarian109 0.3% Nigerian80 0.2% Portuguese74 0.2% Iranian66 0.2% British West Indian61 0.1% Russian58 0.1% West Indian40 0.09% Lebanese39 0.09% Trinidadian and Tobagonian28 0.07% Canadian25 0.06% Egyptian23 0.05% Polish21 0.05% Austrian19 0.04% Scottish14 0.03% Eastern European12 0.03% Welsh11 0.03% Scotch-Irish10 0.02% Guyanese8 0.02% Israeli7 0.02% Norwegian7 0.02% Slovene7 0.02% Armenian6 0.01% Czech6 0.01% African5 0.01% Palestinian4 0.01% Dutch
Geographical mobility in The Hammocks Same house 1 year ago 15,098 86.1% White (Caucasian)2,013 86.7% Black or African American296 100.0% American Indian / Alaska Native1,059 90.2% Asian60 100.0% Native Hawaiian / Pacific Islander6,596 82.3% Other race29,269 95.9% Two or more races6,846 88.9% White alone, not Hispanic / Latino42,101 90.4% Hispanic or LatinoMoved within same county 1,489 8.5% White / Caucasian97 4.2% Black or African American127 10.9% Asian889 11.1% Other race1,047 3.4% Two or more races439 5.7% White alone, not Hispanic / Latino2,881 6.2% Hispanic or LatinoMoved within same state 101 0.6% White / Caucasian23 1.0% Black or African American1 0.0% Other race38 0.5% White alone, not Hispanic / Latino110 0.2% Hispanic or LatinoMoved from different state 329 1.9% White / Caucasian240 10.4% Black or African American240 3.0% Other race14 0.0% Two or more races142 1.8% White alone, not Hispanic / Latino405 0.9% Hispanic or LatinoMoved from abroad 442 2.5% White10 0.8% Asian184 2.3% Other race51 0.2% Two or more races164 2.1% White alone, not Hispanic / Latino847 1.8% Hispanic or Latino
Children Nativity (place of birth) in The Hammocks
Children under 6 years - Living with two parents Both parents native 1,038 100.0% NativeBoth parents foreign-born 874 87.0% Native130 13.0% Foreign-bornOne native, one foreign-born parent 525 100.0% NativeChildren under 6 years - Living with one parent Native parent 230 98.0% Native5 2.0% Foreign-bornForeign-born parent 528 83.7% Native103 16.3% Foreign-bornChildren 6 to 17 years - Living with two parents Both parents native 1,664 100.0% NativeBoth parents foreign-born 2,281 74.4% Native786 25.6% Foreign-bornOne native, one foreign-born parent 1,146 93.8% Native76 6.2% Foreign-bornChildren 6 to 17 years - Living with one parent Foreign-born parent 2,369 66.0% Native1,222 34.0% Foreign-born
Place of birth for residents in The Hammocks 31,105 Americas31,075 Latin America16,101 Caribbean11,318 South America3,655 Central America1,123 Asia814 Europe488 Southern Europe422 South Central Asia294 Western Asia243 South Eastern Asia161 Eastern Asia147 Africa142 Western Europe142 Eastern Europe111 Western Africa104 China39 Northern Europe29 Northern America20 Eastern Africa14 Northern Africa6 Oceania6 Australia and New Zealand Subregion14,103 Cuba3,513 Colombia3,387 Venezuela2,195 Nicaragua1,637 Peru940 Ecuador893 Dominican Republic795 Argentina532 Haiti443 Mexico410 Guatemala311 Jamaica311 Chile261 India259 El Salvador248 Spain212 Bolivia183 Brazil157 Honduras157 Panama153 Uruguay128 Vietnam125 Italy125 Trinidad and Tobago113 Greece111 Nigeria109 Guyana108 Germany106 Israel99 Philippines95 Syria88 Pakistan87 St. Vincent and the Grenadines75 Saudi Arabia74 China71 Bulgaria56 Korea55 Iran52 Russia29 Taiwan29 Canada26 Dominica22 England21 Belgium20 Kenya20 Costa Rica19 St. Lucia15 Lebanon15 Sri Lanka14 Egypt14 Thailand12 Ireland10 Poland8 Belize7 Netherlands6 Australia3 United Kingdom3 Austria
Grandparents responsible for own grandchildren in The Hammocks
Grandparents (30 to 59 years) White / Caucasian 63 28.5% Responsible for grandchildren159 71.5% Not responsible for grandchildrenOther race 35 17.5% Responsible for grandchildren167 82.5% Not responsible for grandchildrenTwo or more races 712 100.0% Not responsible for grandchildrenHispanic or Latino 137 15.6% Responsible for grandchildren744 84.4% Not responsible for grandchildrenGrandparents (60 years and over) White / Caucasian 51 13.2% Responsible for grandchildren338 86.8% Not responsible for grandchildrenOther race 111 34.6% Responsible for grandchildren209 65.4% Not responsible for grandchildrenTwo or more races 80 7.6% Responsible for grandchildren969 92.4% Not responsible for grandchildrenHispanic or Latino 293 22.6% Responsible for grandchildren1,003 77.4% Not responsible for grandchildren