Races in Templeton, Massachusetts (MA) Detailed Stats
Ancestries, Foreign-born residents, place of birth

Recent posts about races in Templeton, Massachusetts on our local forum with over 2,400,000 registered users:
 | 2022 Real Estate Observations (1122 replies) |
| Big MA Ancestry Data Thread by Town (31 replies) |
| Hubbardston vs Templeton MA (5 replies) |
| Southerner wanting to move up north. Advice please (155 replies) |
| Ductless Minisplit Install (134 replies) |
| Rename Yawkey Way? (34 replies) |
1.5% of Templeton, MA residents are foreign-born , which is 1099.8% less than the foreign-born rate of 18.0% across the entire state of Massachusetts.
Race distribution in Templeton

- 6,61597.3%White alone
- 981.4%Hispanic
- 310.5%Two or more races
- 240.4%Black alone
- 190.3%Asian alone
- 100.1%American Indian alone
- 20.03%Other race alone

2000
2022
-
- 5,198,35981.9%White alone
- 428,7296.8%Hispanic
- 318,3295.0%Black alone
- 236,7863.7%Asian alone
- 110,3381.7%Two or more races
- 43,5860.7%Other race alone
- 11,2640.2%American Indian alone
- 1,7060.03%Native Hawaiian and Other
Pacific Islander alone

-
- 4,676,62767.0%White alone
- 911,03813.0%Hispanic
- 501,4637.2%Asian alone
- 459,7406.6%Black alone
- 341,8894.9%Two or more races
- 84,4031.2%Other race alone
- 5,8380.08%American Indian alone
- 9760.01%Native Hawaiian and Other
Pacific Islander alone

Income and house value in Templeton
- Median household income in 2022
- $88,689White non-Hispanic householders
- $8,164American Indian and Alaska Native householders
- $159,323Hispanic or Latino race householders
- Median 2022 house value
- $306,534White Non-Hispanic householders
- $262,349Hispanic or Latino householders
Household income for White non-Hispanic householders

Household income for American Indian and Alaska Native householders

Household income for Hispanic or Latino race householders

Foreign-born residents in Templeton
102 residents are foreign born
| This city: | 1.5% |
| Massachusetts: | 12.2% |
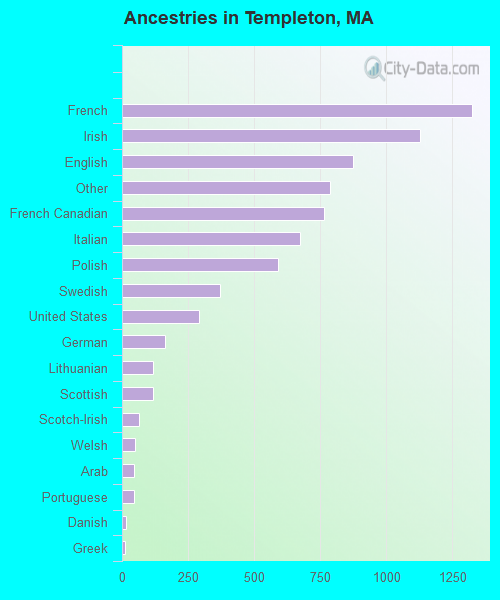
Ancestries in Templeton

- 1,32217.7%French
- 1,12615.1%Irish
- 87211.7%English
- 78810.5%Other
- 76310.2%French Canadian
- 6749.0%Italian
- 5897.9%Polish
- 3694.9%Swedish
- 2903.9%United States
- 1642.2%German
- 1181.6%Lithuanian
- 1181.6%Scottish
- 650.9%Scotch-Irish
- 480.6%Welsh
- 470.6%Arab
- 470.6%Portuguese
- 170.2%Danish
- 130.2%Greek
- 120.2%Norwegian
- 100.1%Russian
- 90.1%Czech
- 70.09%Dutch
- 60.08%Hungarian
Zip codes: 01468.