Races in Taylor, Michigan (MI) Detailed Stats
Data:
Races - White alone (%)
Races - White alone (% change since 2000)
Races - Black alone (%)
Races - Black alone (% change since 2000)
Races - American Indian alone (%)
Races - American Indian alone (% change since 2000)
Races - Asian alone (%)
Races - Asian alone (% change since 2000)
Races - Hispanic (%)
Races - Hispanic (% change since 2000)
Races - Native Hawaiian and Other Pacific Islander alone (%)
Races - Native Hawaiian and Other Pacific Islander alone (% change since 2000)
Races - Two or more races(%)
Races - Two or more races(% change since 2000)
Races - Other race alone (%)
Races - Other race alone (% change since 2000)
Racial diversity
Place of birth - Born in state of residence (%)
Place of birth - Born in state of residence (%) - White
Place of birth - Born in state of residence (%) - Black or African American
Place of birth - Born in state of residence (%) - Asian
Place of birth - Born in state of residence (%) - Hispanic or Latino
Place of birth - Born in state of residence (%) - American Indian and Alaska Native
Place of birth - Born in state of residence (%) - Multirace
Place of birth - Born in state of residence (%) - Other Race
Place of birth - Born in other state (%)
Place of birth - Born in other state (%) - White
Place of birth - Born in other state (%) - Black or African American
Place of birth - Born in other state (%) - Asian
Place of birth - Born in other state (%) - Hispanic or Latino
Place of birth - Born in other state (%) - American Indian and Alaska Native
Place of birth - Born in other state (%) - Multirace
Place of birth - Born in other state (%) - Other Race
Place of birth - Native, outside of US (%)
Place of birth - Native, outside of US (%) - White
Place of birth - Native, outside of US (%) - Black or African American
Place of birth - Native, outside of US (%) - Asian
Place of birth - Native, outside of US (%) - Hispanic or Latino
Place of birth - Native, outside of US (%) - American Indian and Alaska Native
Place of birth - Native, outside of US (%) - Multirace
Place of birth - Native, outside of US (%) - Other Race
Place of birth - Foreign born (%)
Place of birth - Foreign born (%) - White
Place of birth - Foreign born (%) - Black or African American
Place of birth - Foreign born (%) - Asian
Place of birth - Foreign born (%) - Hispanic or Latino
Place of birth - Foreign born (%) - American Indian and Alaska Native
Place of birth - Foreign born (%) - Multirace
Place of birth - Foreign born (%) - Other Race
Residents speaking English at home (%)
Residents speaking English at home - Born in the United States (%)
Residents speaking English at home - Native, born elsewhere (%)
Residents speaking English at home - Foreign born (%)
Residents speaking Spanish at home (%)
Residents speaking Spanish at home - Born in the United States (%)
Residents speaking Spanish at home - Native, born elsewhere (%)
Residents speaking Spanish at home - Foreign born (%)
Residents speaking other language at home (%)
Residents speaking other language at home - Born in the United States (%)
Residents speaking other language at home - Native, born elsewhere (%)
Residents speaking other language at home - Foreign born (%)
Marital status - Never married (%)
Marital status - Now married (%)
Marital status - Separated (%)
Marital status - Widowed (%)
Marital status - Divorced (%)
Ancestries Reported - Arab (%)
Ancestries Reported - Czech (%)
Ancestries Reported - Danish (%)
Ancestries Reported - Dutch (%)
Ancestries Reported - English (%)
Ancestries Reported - French (%)
Ancestries Reported - French Canadian (%)
Ancestries Reported - German (%)
Ancestries Reported - Greek (%)
Ancestries Reported - Hungarian (%)
Ancestries Reported - Irish (%)
Ancestries Reported - Italian (%)
Ancestries Reported - Lithuanian (%)
Ancestries Reported - Norwegian (%)
Ancestries Reported - Polish (%)
Ancestries Reported - Portuguese (%)
Ancestries Reported - Russian (%)
Ancestries Reported - Scotch-Irish (%)
Ancestries Reported - Scottish (%)
Ancestries Reported - Slovak (%)
Ancestries Reported - Subsaharan African (%)
Ancestries Reported - Swedish (%)
Ancestries Reported - Swiss (%)
Ancestries Reported - Ukrainian (%)
Ancestries Reported - United States (%)
Ancestries Reported - Welsh (%)
Ancestries Reported - West Indian (%)
Ancestries Reported - Other (%)
Geographical mobility - Same house 1 year ago (%)
Geographical mobility - Same house 1 year ago (%) - White
Geographical mobility - Same house 1 year ago (%) - Black or African American
Geographical mobility - Same house 1 year ago (%) - Asian
Geographical mobility - Same house 1 year ago (%) - Hispanic or Latino
Geographical mobility - Same house 1 year ago (%) - American Indian and Alaska Native
Geographical mobility - Same house 1 year ago (%) - Multirace
Geographical mobility - Same house 1 year ago (%) - Other Race
Geographical mobility - Moved within same county (%)
Geographical mobility - Moved within same county (%) - White
Geographical mobility - Moved within same county (%) - Black or African American
Geographical mobility - Moved within same county (%) - Asian
Geographical mobility - Moved within same county (%) - Hispanic or Latino
Geographical mobility - Moved within same county (%) - American Indian and Alaska Native
Geographical mobility - Moved within same county (%) - Multirace
Geographical mobility - Moved within same county (%) - Other Race
Geographical mobility - Moved from different county within same state (%)
Geographical mobility - Moved from different county within same state (%) - White
Geographical mobility - Moved from different county within same state (%) - Black or African American
Geographical mobility - Moved from different county within same state (%) - Asian
Geographical mobility - Moved from different county within same state (%) - Hispanic or Latino
Geographical mobility - Moved from different county within same state (%) - American Indian and Alaska Native
Geographical mobility - Moved from different county within same state (%) - Multirace
Geographical mobility - Moved from different county within same state (%) - Other Race
Geographical mobility - Moved from different state (%)
Geographical mobility - Moved from different state (%) - White
Geographical mobility - Moved from different state (%) - Black or African American
Geographical mobility - Moved from different state (%) - Asian
Geographical mobility - Moved from different state (%) - Hispanic or Latino
Geographical mobility - Moved from different state (%) - American Indian and Alaska Native
Geographical mobility - Moved from different state (%) - Multirace
Geographical mobility - Moved from different state (%) - Other Race
Geographical mobility - Moved from abroad (%)
Geographical mobility - Moved from abroad (%) - White
Geographical mobility - Moved from abroad (%) - Black or African American
Geographical mobility - Moved from abroad (%) - Asian
Geographical mobility - Moved from abroad (%) - Hispanic or Latino
Geographical mobility - Moved from abroad (%) - American Indian and Alaska Native
Geographical mobility - Moved from abroad (%) - Multirace
Geographical mobility - Moved from abroad (%) - Other Race
Place of birth for the foreign-born population - Ireland (%)
Place of birth for the foreign-born population - Denmark (%)
Place of birth for the foreign-born population - Norway (%)
Place of birth for the foreign-born population - Sweden (%)
Place of birth for the foreign-born population - United Kingdom (%)
Place of birth for the foreign-born population - England (%)
Place of birth for the foreign-born population - Scotland (%)
Place of birth for the foreign-born population - Other Northern Europe (%)
Place of birth for the foreign-born population - Austria (%)
Place of birth for the foreign-born population - Belgium (%)
Place of birth for the foreign-born population - France (%)
Place of birth for the foreign-born population - Germany (%)
Place of birth for the foreign-born population - Netherlands (%)
Place of birth for the foreign-born population - Switzerland (%)
Place of birth for the foreign-born population - Other Western Europe (%)
Place of birth for the foreign-born population - Greece (%)
Place of birth for the foreign-born population - Italy (%)
Place of birth for the foreign-born population - Portugal (%)
Place of birth for the foreign-born population - Spain (%)
Place of birth for the foreign-born population - Other Southern Europe (%)
Place of birth for the foreign-born population - Albania (%)
Place of birth for the foreign-born population - Belarus (%)
Place of birth for the foreign-born population - Bosnia and Herzegovina (%)
Place of birth for the foreign-born population - Bulgaria (%)
Place of birth for the foreign-born population - Croatia (%)
Place of birth for the foreign-born population - Czechoslovakia (%)
Place of birth for the foreign-born population - Hungary (%)
Place of birth for the foreign-born population - Latvia (%)
Place of birth for the foreign-born population - Lithuania (%)
Place of birth for the foreign-born population - North Macedonia (Macedonia) (%)
Place of birth for the foreign-born population - Moldova (%)
Place of birth for the foreign-born population - Poland (%)
Place of birth for the foreign-born population - Romania (%)
Place of birth for the foreign-born population - Russia (%)
Place of birth for the foreign-born population - Serbia (%)
Place of birth for the foreign-born population - Ukraine (%)
Place of birth for the foreign-born population - Other Eastern Europe (%)
Place of birth for the foreign-born population - China (%)
Place of birth for the foreign-born population - Hong Kong (%)
Place of birth for the foreign-born population - Taiwan (%)
Place of birth for the foreign-born population - Japan (%)
Place of birth for the foreign-born population - Korea (%)
Place of birth for the foreign-born population - Other Eastern Asia (%)
Place of birth for the foreign-born population - Afghanistan (%)
Place of birth for the foreign-born population - Bangladesh (%)
Place of birth for the foreign-born population - India (%)
Place of birth for the foreign-born population - Iran (%)
Place of birth for the foreign-born population - Kazakhstan (%)
Place of birth for the foreign-born population - Nepal (%)
Place of birth for the foreign-born population - Pakistan (%)
Place of birth for the foreign-born population - Sri Lanka (%)
Place of birth for the foreign-born population - Uzbekistan (%)
Place of birth for the foreign-born population - Other South Central Asia (%)
Place of birth for the foreign-born population - Burma (%)
Place of birth for the foreign-born population - Cambodia (%)
Place of birth for the foreign-born population - Indonesia (%)
Place of birth for the foreign-born population - Laos (%)
Place of birth for the foreign-born population - Malaysia (%)
Place of birth for the foreign-born population - Philippines (%)
Place of birth for the foreign-born population - Singapore (%)
Place of birth for the foreign-born population - Thailand (%)
Place of birth for the foreign-born population - Vietnam (%)
Place of birth for the foreign-born population - Other South Eastern Asia (%)
Place of birth for the foreign-born population - Armenia (%)
Place of birth for the foreign-born population - Iraq (%)
Place of birth for the foreign-born population - Israel (%)
Place of birth for the foreign-born population - Jordan (%)
Place of birth for the foreign-born population - Kuwait (%)
Place of birth for the foreign-born population - Lebanon (%)
Place of birth for the foreign-born population - Saudi Arabia (%)
Place of birth for the foreign-born population - Syria (%)
Place of birth for the foreign-born population - Turkey (%)
Place of birth for the foreign-born population - Yemen (%)
Place of birth for the foreign-born population - Other Western Asia (%)
Place of birth for the foreign-born population - Eritrea (%)
Place of birth for the foreign-born population - Ethiopia (%)
Place of birth for the foreign-born population - Kenya (%)
Place of birth for the foreign-born population - Somalia (%)
Place of birth for the foreign-born population - Uganda (%)
Place of birth for the foreign-born population - Zimbabwe (%)
Place of birth for the foreign-born population - Other Eastern Africa (%)
Place of birth for the foreign-born population - Cameroon (%)
Place of birth for the foreign-born population - Congo (%)
Place of birth for the foreign-born population - Democratic Republic of Congo (Zaire) (%)
Place of birth for the foreign-born population - Other Middle Africa (%)
Place of birth for the foreign-born population - Egypt (%)
Place of birth for the foreign-born population - Morocco (%)
Place of birth for the foreign-born population - Sudan (%)
Place of birth for the foreign-born population - Other Northern Africa (%)
Place of birth for the foreign-born population - South Africa (%)
Place of birth for the foreign-born population - Other Southern Africa (%)
Place of birth for the foreign-born population - Cabo Verde (%)
Place of birth for the foreign-born population - Ghana (%)
Place of birth for the foreign-born population - Liberia (%)
Place of birth for the foreign-born population - Nigeria (%)
Place of birth for the foreign-born population - Senegal (%)
Place of birth for the foreign-born population - Sierra Leone (%)
Place of birth for the foreign-born population - Other Western Africa (%)
Place of birth for the foreign-born population - Australia (%)
Place of birth for the foreign-born population - New Zealand (%)
Place of birth for the foreign-born population - Fiji (%)
Place of birth for the foreign-born population - Micronesia (%)
Place of birth for the foreign-born population - Bahamas (%)
Place of birth for the foreign-born population - Barbados (%)
Place of birth for the foreign-born population - Cuba (%)
Place of birth for the foreign-born population - Dominica (%)
Place of birth for the foreign-born population - Dominican Republic (%)
Place of birth for the foreign-born population - Grenada (%)
Place of birth for the foreign-born population - Haiti (%)
Place of birth for the foreign-born population - Jamaica (%)
Place of birth for the foreign-born population - St. Vincent and the Grenadines (%)
Place of birth for the foreign-born population - Trinidad and Tobago (%)
Place of birth for the foreign-born population - West Indies (%)
Place of birth for the foreign-born population - Other Caribbean (%)
Place of birth for the foreign-born population - Belize (%)
Place of birth for the foreign-born population - Costa Rica (%)
Place of birth for the foreign-born population - El Salvador (%)
Place of birth for the foreign-born population - Guatemala (%)
Place of birth for the foreign-born population - Honduras (%)
Place of birth for the foreign-born population - Mexico (%)
Place of birth for the foreign-born population - Nicaragua (%)
Place of birth for the foreign-born population - Panama (%)
Place of birth for the foreign-born population - Other Central America (%)
Place of birth for the foreign-born population - Argentina (%)
Place of birth for the foreign-born population - Bolivia (%)
Place of birth for the foreign-born population - Brazil (%)
Place of birth for the foreign-born population - Chile (%)
Place of birth for the foreign-born population - Colombia (%)
Place of birth for the foreign-born population - Ecuador (%)
Place of birth for the foreign-born population - Guyana (%)
Place of birth for the foreign-born population - Peru (%)
Place of birth for the foreign-born population - Uruguay (%)
Place of birth for the foreign-born population - Venezuela (%)
Place of birth for the foreign-born population - Other South America (%)
Place of birth for the foreign-born population - Canada (%)
Place of birth for the foreign-born population - Other Northern America (%)
Place of birth for the foreign-born population - Other (%)
Latest news about races in Taylor, MI collected exclusively by city-data.com from local newspapers, TV, and radio stations
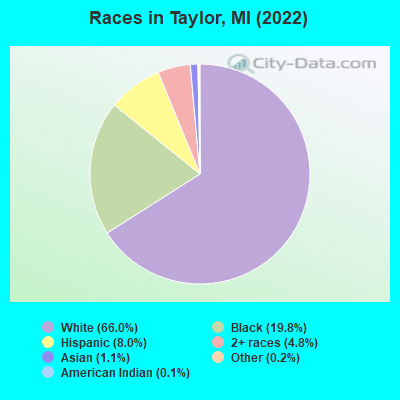
According to 2022 data, the most numerous races in Taylor, MI are White alone (40,986 residents), Black alone (12,287 residents), and Hispanic (4,967 residents). 90.8% of Taylor residents speak English at home. 5.7% of Taylor, MI residents are foreign-born (2.8% born in Asia, 1.4% born in Latin America, 0.8% born in Europe), which is 4.5% less than the foreign-born rate of 6.0% across the entire state of Michigan.
Race distribution in Taylor
2000 2022
7,806,691 78.6% White alone 1,402,047 14.1% Black alone 323,877 3.3% Hispanic 175,311 1.8% Asian alone 163,487 1.6% Two or more races 53,421 0.5% American Indian alone 11,465 0.1% Other race alone 2,145 0.02% Native Hawaiian and Other
7,289,051 72.6% White alone 1,310,464 13.1% Black alone 572,405 5.7% Hispanic 450,031 4.5% Two or more races 335,732 3.3% Asian alone 45,217 0.5% Other race alone 29,011 0.3% American Indian alone 2,207 0.02% Native Hawaiian and Other
Income and house value in Taylor Median household income in 2022 $61,287 White non-Hispanic householders$42,999 Black householders$126,023 Some other race householders$46,892 Two or more races householders$72,055 Hispanic or Latino race householdersMedian 2022 house value $147,429 White Non-Hispanic householders$161,569 Black or African American householders$145,364 American Indian or Alaska Native householders $176,185 Asian householders$160,139 Some other race householders$132,496 Two or more races householders$156,167 Hispanic or Latino householders
Median age by race in Taylor
47.2 Median age for White residents44.7 49.2 25.6 Median age for Black or African American residents23.3 27.4 49.9 Median age for American Indian / Alaska Native residents7.0 52.1 42.9 Median age for Asian residents42.1 46.2 -934,108,526.2 Median age for Native Hawaiian / Pacific Islander residents-674,772,035.8 -699,588,476.7 33.3 Median age for Other race residents24.9 35.5 21.4 Median age for Two or more races residents21.6 21.6 47.3 Median age for White alone residents45.1 49.2 28.3 Median age for Hispanic or Latino residents28.0 28.9
Owner/renter occupied households by race in Taylor
House owners and renters - White residents 14,225 78.6% Owner occupied3,880 21.4% Renter occupiedHouse owners and renters - Black or African American residents 972 20.9% Owner occupied3,682 79.1% Renter occupiedHouse owners and renters - American Indian / Alaska Native residents 61 58.8% Owner occupied43 41.2% Renter occupiedHouse owners and renters - Asian residents 143 44.3% Owner occupied179 55.7% Renter occupiedHouse owners and renters - Other race residents 387 86.1% Owner occupied62 13.9% Renter occupiedHouse owners and renters - Two or more races residents 694 56.8% Owner occupied528 43.2% Renter occupiedHouse owners and renters - White alone residents 14,024 78.9% Owner occupied3,750 21.1% Renter occupiedHouse owners and renters - Hispanic or Latino residents 1,109 76.3% Owner occupied344 23.7% Renter occupied
Language usage in Taylor
English speakers - Total 90.8% of residents of Taylor speak English at home.
3.3% of residents speak Spanish at home 1,337 69.0% Speak English very well601 31.0% Speak English less than very well5.6% of residents speak other language at home 1,959 60.0% Speak English very well1,308 40.0% Speak English less than very well
English speakers - Born in the United States 92.5% of residents of Taylor speak English at home.
6.5% of residents speak Spanish at home 373 76.7% Speak English very well113 23.3% Speak English less than very well1.1% of residents speak other language at home 77 91.7% Speak English very well7 8.3% Speak English less than very well
English speakers - Native, born elsewhere 55.5% of residents of Taylor speak English at home.
25.3% of residents speak Spanish at home 79 85.9% Speak English very well13 14.1% Speak English less than very well19.0% of residents speak other language at home 64 92.8% Speak English very well5 7.2% Speak English less than very well
English speakers - Foreign-born 11.5% of residents of Taylor speak English at home.
19.9% of residents speak Spanish at home 300 41.7% Speak English very well419 58.3% Speak English less than very well66.5% of residents speak other language at home 1,143 47.5% Speak English very well1,261 52.5% Speak English less than very well
White (Caucasian) - Speak only English Native:
98.3% (37,074)Foreign-born:
13.8% (286)
White (Caucasian) - Speak another language Native:
2.5% (949)Foreign-born:
86.2% (1,784)
Black or African American - Speak only English Native:
99.1% (10,561)Foreign-born:
32.0% (51)
Black or African American - Speak another language Native:
0.9% (99)Foreign-born:
67.3% (108)
Asian - Speak only English Native:
61.3% (119)Foreign-born:
3.7% (18)
Asian - Speak another language Native:
36.6% (71)Foreign-born:
94.8% (473)
Other race - Speak only English Native:
45.8% (533)Foreign-born:
1.3% (2)
Other race - Speak another language Native:
52.1% (607)Foreign-born:
100.0% (115)
Two or more races - Speak only English Native:
88.9% (3,900)Foreign-born:
6.8% (55)
Two or more races - Speak another language Native:
10.1% (444)Foreign-born:
94.5% (759)
White alone - Speak only English Native:
98.4% (36,503)Foreign-born:
14.1% (292)
White alone - Speak another language Native:
2.1% (767)Foreign-born:
85.9% (1,775)
Hispanic or Latino - Speak only English Native:
68.9% (2,703)Foreign-born:
0.2% (1)
Hispanic or Latino - Speak another language Native:
30.5% (1,197)Foreign-born:
100.0% (705)
Foreign-born residents in Taylor 3,565 residents are foreign born (2.8% Asia , 1.4% Latin America , 0.8% Europe ).
This city:
5.7%Michigan:
6.9%
Marital status for residents in Taylor Marital status - White (Caucasian) population 15 years and over
Males 37.4% Never married43.0% Now married0.2% Separated5.0% Widowed14.4% DivorcedFemales 26.1% Never married45.0% Now married1.2% Separated11.6% Widowed16.2% DivorcedWomen who gave birth in the past 12 months Now married:
66.1% (205)Unmarried:
33.9% (106)
Women who did not give birth in the past 12 months Now married:
42.5% (3,373)Unmarried:
57.5% (4,556)
Marital status - Black or African American population 15 years and over
Males 60.8% Never married23.3% Now married2.1% Separated0.6% Widowed13.2% DivorcedFemales 61.1% Never married17.2% Now married5.0% Separated3.7% Widowed13.0% DivorcedWomen who gave birth in the past 12 months Now married:
0.0% (0)Unmarried:
100.0% (478)
Women who did not give birth in the past 12 months Now married:
24.9% (863)Unmarried:
75.1% (2,599)
Marital status - American Indian / Alaska Native population 15 years and over
Males 31.0% Never married69.0% Now married0.0% Separated0.0% Widowed0.0% DivorcedFemales 0.0% Never married60.0% Now married12.7% Separated4.5% Widowed22.7% DivorcedWomen who gave birth in the past 12 months Now married:
100.0% (7)Unmarried:
0.0% (0)
Women who did not give birth in the past 12 months Now married:
100.0% (52)Unmarried:
0.0% (0)
Marital status - Asian population 15 years and over
Males 32.3% Never married55.0% Now married0.0% Separated7.6% Widowed5.2% DivorcedFemales 6.0% Never married55.4% Now married0.0% Separated5.1% Widowed33.5% DivorcedWomen who gave birth in the past 12 months Now married:
100.0% (5)Unmarried:
0.0% (0)
Women who did not give birth in the past 12 months Now married:
85.1% (111)Unmarried:
14.9% (19)
Marital status - Other race population 15 years and over
Males 26.0% Never married68.6% Now married0.0% Separated4.9% Widowed0.6% DivorcedFemales 16.0% Never married75.2% Now married0.0% Separated5.9% Widowed2.8% DivorcedWomen who gave birth in the past 12 months Now married:
100.0% (6)Unmarried:
0.0% (0)
Women who did not give birth in the past 12 months Now married:
62.7% (112)Unmarried:
37.3% (67)
Marital status - Two or more races population 15 years and over
Males 50.8% Never married39.3% Now married3.0% Separated0.9% Widowed6.0% DivorcedFemales 52.2% Never married32.9% Now married0.0% Separated5.2% Widowed9.7% DivorcedWomen who gave birth in the past 12 months Now married:
72.2% (80)Unmarried:
27.8% (31)
Women who did not give birth in the past 12 months Now married:
26.3% (432)Unmarried:
73.7% (1,208)
Marital status - White alone, not Hispanic / Latino population 15 years and over
Males 37.1% Never married43.1% Now married0.2% Separated5.2% Widowed14.5% DivorcedFemales 26.2% Never married45.0% Now married1.0% Separated11.6% Widowed16.3% DivorcedWomen who gave birth in the past 12 months Now married:
65.8% (187)Unmarried:
34.2% (97)
Women who did not give birth in the past 12 months Now married:
42.2% (3,297)Unmarried:
57.8% (4,513)
Marital status - Hispanic or Latino population 15 years and over
Males 45.6% Never married45.0% Now married1.5% Separated1.6% Widowed6.3% DivorcedFemales 25.2% Never married58.4% Now married2.8% Separated6.1% Widowed7.4% DivorcedWomen who gave birth in the past 12 months Now married:
88.8% (90)Unmarried:
11.2% (11)
Women who did not give birth in the past 12 months Now married:
57.6% (560)Unmarried:
42.4% (412)
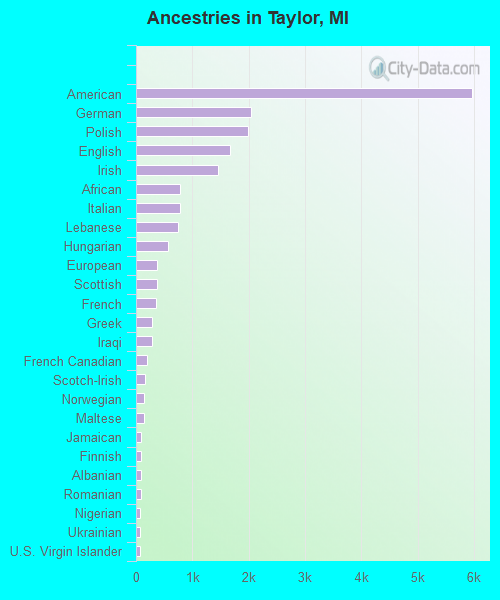
Ancestries in Taylor
5,970 18.0% American2,047 6.2% German1,995 6.0% Polish1,671 5.0% English1,451 4.4% Irish784 2.4% African773 2.3% Italian742 2.2% Lebanese562 1.7% Hungarian379 1.1% European378 1.1% Scottish350 1.1% French289 0.9% Greek278 0.8% Iraqi190 0.6% French Canadian163 0.5% Scotch-Irish147 0.4% Norwegian138 0.4% Maltese94 0.3% Jamaican90 0.3% Finnish86 0.3% Albanian82 0.2% Romanian79 0.2% Nigerian77 0.2% Ukrainian72 0.2% U.S. Virgin Islander63 0.2% Canadian55 0.2% Eastern European51 0.2% Syrian39 0.1% Dutch31 0.09% Egyptian26 0.08% Danish22 0.07% West Indian21 0.06% British20 0.06% Yugoslavian19 0.06% Arab19 0.06% Slovak16 0.05% Luxembourger15 0.05% Welsh13 0.04% Russian12 0.04% Austrian9 0.03% Northern European9 0.03% Macedonian8 0.02% Palestinian7 0.02% Slavic7 0.02% Croatian6 0.02% Scandinavian6 0.02% Czechoslovakian3 0.01% Zimbabwean2 0.01% Belgian
Geographical mobility in Taylor Same house 1 year ago 38,296 92.5% White (Caucasian)10,044 83.5% Black or African American158 78.3% American Indian / Alaska Native568 80.3% Asian1,254 95.4% Other race5,120 86.7% Two or more races37,612 92.3% White alone, not Hispanic / Latino4,408 89.4% Hispanic or LatinoMoved within same county 1,842 4.4% White / Caucasian1,687 14.0% Black or African American119 16.9% Asian4 0.3% Other race646 10.9% Two or more races1,893 4.6% White alone, not Hispanic / Latino404 8.2% Hispanic or LatinoMoved within same state 647 1.6% White / Caucasian44 0.4% Black or African American31 15.3% American Indian / Alaska Native80 1.4% Two or more races655 1.6% White alone, not Hispanic / Latino46 0.9% Hispanic or LatinoMoved from different state 524 1.3% White / Caucasian189 1.6% Black or African American13 1.8% Asian20 1.5% Other race511 1.3% White alone, not Hispanic / Latino38 0.8% Hispanic or LatinoMoved from abroad 42 0.1% White13 0.1% Black or African American4 2.2% American Indian / Alaska Native44 0.1% White alone, not Hispanic / Latino
Children Nativity (place of birth) in Taylor
Children under 6 years - Living with two parents Both parents native 1,410 100.0% NativeBoth parents foreign-born 240 100.0% NativeOne native, one foreign-born parent 277 100.0% NativeChildren under 6 years - Living with one parent Native parent 2,388 100.0% NativeForeign-born parent 54 51.6% Native50 48.4% Foreign-bornChildren 6 to 17 years - Living with two parents Both parents native 3,451 99.8% Native9 0.2% Foreign-bornBoth parents foreign-born 257 57.5% Native191 42.5% Foreign-bornOne native, one foreign-born parent 447 100.0% NativeChildren 6 to 17 years - Living with one parent Native parent 3,536 100.0% NativeForeign-born parent 150 59.6% Native102 40.4% Foreign-born
Grandparents responsible for own grandchildren in Taylor
Grandparents (30 to 59 years) White / Caucasian 178 70.6% Responsible for grandchildren74 29.4% Not responsible for grandchildrenBlack or African American 39 50.8% Responsible for grandchildren38 49.2% Not responsible for grandchildrenTwo or more races 53 100.0% Not responsible for grandchildrenWhite alone, not Hispanic / Latino 178 69.4% Responsible for grandchildren79 30.6% Not responsible for grandchildrenHispanic or Latino 52 100.0% Not responsible for grandchildrenGrandparents (60 years and over) White / Caucasian 164 51.6% Responsible for grandchildren154 48.4% Not responsible for grandchildrenBlack or African American 50 100.0% Not responsible for grandchildrenTwo or more races 38 50.3% Responsible for grandchildren38 49.7% Not responsible for grandchildrenWhite alone, not Hispanic / Latino 153 48.9% Responsible for grandchildren160 51.1% Not responsible for grandchildrenHispanic or Latino 20 36.5% Responsible for grandchildren34 63.5% Not responsible for grandchildren