Races in Tamiami, Florida (FL) Detailed Stats
Data:
Races - White alone (%)
Races - White alone (% change since 2000)
Races - Black alone (%)
Races - Black alone (% change since 2000)
Races - American Indian alone (%)
Races - American Indian alone (% change since 2000)
Races - Asian alone (%)
Races - Asian alone (% change since 2000)
Races - Hispanic (%)
Races - Hispanic (% change since 2000)
Races - Native Hawaiian and Other Pacific Islander alone (%)
Races - Native Hawaiian and Other Pacific Islander alone (% change since 2000)
Races - Two or more races(%)
Races - Two or more races(% change since 2000)
Races - Other race alone (%)
Races - Other race alone (% change since 2000)
Racial diversity
Place of birth - Born in state of residence (%)
Place of birth - Born in state of residence (%) - White
Place of birth - Born in state of residence (%) - Black or African American
Place of birth - Born in state of residence (%) - Asian
Place of birth - Born in state of residence (%) - Hispanic or Latino
Place of birth - Born in state of residence (%) - American Indian and Alaska Native
Place of birth - Born in state of residence (%) - Multirace
Place of birth - Born in state of residence (%) - Other Race
Place of birth - Born in other state (%)
Place of birth - Born in other state (%) - White
Place of birth - Born in other state (%) - Black or African American
Place of birth - Born in other state (%) - Asian
Place of birth - Born in other state (%) - Hispanic or Latino
Place of birth - Born in other state (%) - American Indian and Alaska Native
Place of birth - Born in other state (%) - Multirace
Place of birth - Born in other state (%) - Other Race
Place of birth - Native, outside of US (%)
Place of birth - Native, outside of US (%) - White
Place of birth - Native, outside of US (%) - Black or African American
Place of birth - Native, outside of US (%) - Asian
Place of birth - Native, outside of US (%) - Hispanic or Latino
Place of birth - Native, outside of US (%) - American Indian and Alaska Native
Place of birth - Native, outside of US (%) - Multirace
Place of birth - Native, outside of US (%) - Other Race
Place of birth - Foreign born (%)
Place of birth - Foreign born (%) - White
Place of birth - Foreign born (%) - Black or African American
Place of birth - Foreign born (%) - Asian
Place of birth - Foreign born (%) - Hispanic or Latino
Place of birth - Foreign born (%) - American Indian and Alaska Native
Place of birth - Foreign born (%) - Multirace
Place of birth - Foreign born (%) - Other Race
Residents speaking English at home (%)
Residents speaking English at home - Born in the United States (%)
Residents speaking English at home - Native, born elsewhere (%)
Residents speaking English at home - Foreign born (%)
Residents speaking Spanish at home (%)
Residents speaking Spanish at home - Born in the United States (%)
Residents speaking Spanish at home - Native, born elsewhere (%)
Residents speaking Spanish at home - Foreign born (%)
Residents speaking other language at home (%)
Residents speaking other language at home - Born in the United States (%)
Residents speaking other language at home - Native, born elsewhere (%)
Residents speaking other language at home - Foreign born (%)
Marital status - Never married (%)
Marital status - Now married (%)
Marital status - Separated (%)
Marital status - Widowed (%)
Marital status - Divorced (%)
Ancestries Reported - Arab (%)
Ancestries Reported - Czech (%)
Ancestries Reported - Danish (%)
Ancestries Reported - Dutch (%)
Ancestries Reported - English (%)
Ancestries Reported - French (%)
Ancestries Reported - French Canadian (%)
Ancestries Reported - German (%)
Ancestries Reported - Greek (%)
Ancestries Reported - Hungarian (%)
Ancestries Reported - Irish (%)
Ancestries Reported - Italian (%)
Ancestries Reported - Lithuanian (%)
Ancestries Reported - Norwegian (%)
Ancestries Reported - Polish (%)
Ancestries Reported - Portuguese (%)
Ancestries Reported - Russian (%)
Ancestries Reported - Scotch-Irish (%)
Ancestries Reported - Scottish (%)
Ancestries Reported - Slovak (%)
Ancestries Reported - Subsaharan African (%)
Ancestries Reported - Swedish (%)
Ancestries Reported - Swiss (%)
Ancestries Reported - Ukrainian (%)
Ancestries Reported - United States (%)
Ancestries Reported - Welsh (%)
Ancestries Reported - West Indian (%)
Ancestries Reported - Other (%)
Geographical mobility - Same house 1 year ago (%)
Geographical mobility - Same house 1 year ago (%) - White
Geographical mobility - Same house 1 year ago (%) - Black or African American
Geographical mobility - Same house 1 year ago (%) - Asian
Geographical mobility - Same house 1 year ago (%) - Hispanic or Latino
Geographical mobility - Same house 1 year ago (%) - American Indian and Alaska Native
Geographical mobility - Same house 1 year ago (%) - Multirace
Geographical mobility - Same house 1 year ago (%) - Other Race
Geographical mobility - Moved within same county (%)
Geographical mobility - Moved within same county (%) - White
Geographical mobility - Moved within same county (%) - Black or African American
Geographical mobility - Moved within same county (%) - Asian
Geographical mobility - Moved within same county (%) - Hispanic or Latino
Geographical mobility - Moved within same county (%) - American Indian and Alaska Native
Geographical mobility - Moved within same county (%) - Multirace
Geographical mobility - Moved within same county (%) - Other Race
Geographical mobility - Moved from different county within same state (%)
Geographical mobility - Moved from different county within same state (%) - White
Geographical mobility - Moved from different county within same state (%) - Black or African American
Geographical mobility - Moved from different county within same state (%) - Asian
Geographical mobility - Moved from different county within same state (%) - Hispanic or Latino
Geographical mobility - Moved from different county within same state (%) - American Indian and Alaska Native
Geographical mobility - Moved from different county within same state (%) - Multirace
Geographical mobility - Moved from different county within same state (%) - Other Race
Geographical mobility - Moved from different state (%)
Geographical mobility - Moved from different state (%) - White
Geographical mobility - Moved from different state (%) - Black or African American
Geographical mobility - Moved from different state (%) - Asian
Geographical mobility - Moved from different state (%) - Hispanic or Latino
Geographical mobility - Moved from different state (%) - American Indian and Alaska Native
Geographical mobility - Moved from different state (%) - Multirace
Geographical mobility - Moved from different state (%) - Other Race
Geographical mobility - Moved from abroad (%)
Geographical mobility - Moved from abroad (%) - White
Geographical mobility - Moved from abroad (%) - Black or African American
Geographical mobility - Moved from abroad (%) - Asian
Geographical mobility - Moved from abroad (%) - Hispanic or Latino
Geographical mobility - Moved from abroad (%) - American Indian and Alaska Native
Geographical mobility - Moved from abroad (%) - Multirace
Geographical mobility - Moved from abroad (%) - Other Race
Place of birth for the foreign-born population - Ireland (%)
Place of birth for the foreign-born population - Denmark (%)
Place of birth for the foreign-born population - Norway (%)
Place of birth for the foreign-born population - Sweden (%)
Place of birth for the foreign-born population - United Kingdom (%)
Place of birth for the foreign-born population - England (%)
Place of birth for the foreign-born population - Scotland (%)
Place of birth for the foreign-born population - Other Northern Europe (%)
Place of birth for the foreign-born population - Austria (%)
Place of birth for the foreign-born population - Belgium (%)
Place of birth for the foreign-born population - France (%)
Place of birth for the foreign-born population - Germany (%)
Place of birth for the foreign-born population - Netherlands (%)
Place of birth for the foreign-born population - Switzerland (%)
Place of birth for the foreign-born population - Other Western Europe (%)
Place of birth for the foreign-born population - Greece (%)
Place of birth for the foreign-born population - Italy (%)
Place of birth for the foreign-born population - Portugal (%)
Place of birth for the foreign-born population - Spain (%)
Place of birth for the foreign-born population - Other Southern Europe (%)
Place of birth for the foreign-born population - Albania (%)
Place of birth for the foreign-born population - Belarus (%)
Place of birth for the foreign-born population - Bosnia and Herzegovina (%)
Place of birth for the foreign-born population - Bulgaria (%)
Place of birth for the foreign-born population - Croatia (%)
Place of birth for the foreign-born population - Czechoslovakia (%)
Place of birth for the foreign-born population - Hungary (%)
Place of birth for the foreign-born population - Latvia (%)
Place of birth for the foreign-born population - Lithuania (%)
Place of birth for the foreign-born population - North Macedonia (Macedonia) (%)
Place of birth for the foreign-born population - Moldova (%)
Place of birth for the foreign-born population - Poland (%)
Place of birth for the foreign-born population - Romania (%)
Place of birth for the foreign-born population - Russia (%)
Place of birth for the foreign-born population - Serbia (%)
Place of birth for the foreign-born population - Ukraine (%)
Place of birth for the foreign-born population - Other Eastern Europe (%)
Place of birth for the foreign-born population - China (%)
Place of birth for the foreign-born population - Hong Kong (%)
Place of birth for the foreign-born population - Taiwan (%)
Place of birth for the foreign-born population - Japan (%)
Place of birth for the foreign-born population - Korea (%)
Place of birth for the foreign-born population - Other Eastern Asia (%)
Place of birth for the foreign-born population - Afghanistan (%)
Place of birth for the foreign-born population - Bangladesh (%)
Place of birth for the foreign-born population - India (%)
Place of birth for the foreign-born population - Iran (%)
Place of birth for the foreign-born population - Kazakhstan (%)
Place of birth for the foreign-born population - Nepal (%)
Place of birth for the foreign-born population - Pakistan (%)
Place of birth for the foreign-born population - Sri Lanka (%)
Place of birth for the foreign-born population - Uzbekistan (%)
Place of birth for the foreign-born population - Other South Central Asia (%)
Place of birth for the foreign-born population - Burma (%)
Place of birth for the foreign-born population - Cambodia (%)
Place of birth for the foreign-born population - Indonesia (%)
Place of birth for the foreign-born population - Laos (%)
Place of birth for the foreign-born population - Malaysia (%)
Place of birth for the foreign-born population - Philippines (%)
Place of birth for the foreign-born population - Singapore (%)
Place of birth for the foreign-born population - Thailand (%)
Place of birth for the foreign-born population - Vietnam (%)
Place of birth for the foreign-born population - Other South Eastern Asia (%)
Place of birth for the foreign-born population - Armenia (%)
Place of birth for the foreign-born population - Iraq (%)
Place of birth for the foreign-born population - Israel (%)
Place of birth for the foreign-born population - Jordan (%)
Place of birth for the foreign-born population - Kuwait (%)
Place of birth for the foreign-born population - Lebanon (%)
Place of birth for the foreign-born population - Saudi Arabia (%)
Place of birth for the foreign-born population - Syria (%)
Place of birth for the foreign-born population - Turkey (%)
Place of birth for the foreign-born population - Yemen (%)
Place of birth for the foreign-born population - Other Western Asia (%)
Place of birth for the foreign-born population - Eritrea (%)
Place of birth for the foreign-born population - Ethiopia (%)
Place of birth for the foreign-born population - Kenya (%)
Place of birth for the foreign-born population - Somalia (%)
Place of birth for the foreign-born population - Uganda (%)
Place of birth for the foreign-born population - Zimbabwe (%)
Place of birth for the foreign-born population - Other Eastern Africa (%)
Place of birth for the foreign-born population - Cameroon (%)
Place of birth for the foreign-born population - Congo (%)
Place of birth for the foreign-born population - Democratic Republic of Congo (Zaire) (%)
Place of birth for the foreign-born population - Other Middle Africa (%)
Place of birth for the foreign-born population - Egypt (%)
Place of birth for the foreign-born population - Morocco (%)
Place of birth for the foreign-born population - Sudan (%)
Place of birth for the foreign-born population - Other Northern Africa (%)
Place of birth for the foreign-born population - South Africa (%)
Place of birth for the foreign-born population - Other Southern Africa (%)
Place of birth for the foreign-born population - Cabo Verde (%)
Place of birth for the foreign-born population - Ghana (%)
Place of birth for the foreign-born population - Liberia (%)
Place of birth for the foreign-born population - Nigeria (%)
Place of birth for the foreign-born population - Senegal (%)
Place of birth for the foreign-born population - Sierra Leone (%)
Place of birth for the foreign-born population - Other Western Africa (%)
Place of birth for the foreign-born population - Australia (%)
Place of birth for the foreign-born population - New Zealand (%)
Place of birth for the foreign-born population - Fiji (%)
Place of birth for the foreign-born population - Micronesia (%)
Place of birth for the foreign-born population - Bahamas (%)
Place of birth for the foreign-born population - Barbados (%)
Place of birth for the foreign-born population - Cuba (%)
Place of birth for the foreign-born population - Dominica (%)
Place of birth for the foreign-born population - Dominican Republic (%)
Place of birth for the foreign-born population - Grenada (%)
Place of birth for the foreign-born population - Haiti (%)
Place of birth for the foreign-born population - Jamaica (%)
Place of birth for the foreign-born population - St. Vincent and the Grenadines (%)
Place of birth for the foreign-born population - Trinidad and Tobago (%)
Place of birth for the foreign-born population - West Indies (%)
Place of birth for the foreign-born population - Other Caribbean (%)
Place of birth for the foreign-born population - Belize (%)
Place of birth for the foreign-born population - Costa Rica (%)
Place of birth for the foreign-born population - El Salvador (%)
Place of birth for the foreign-born population - Guatemala (%)
Place of birth for the foreign-born population - Honduras (%)
Place of birth for the foreign-born population - Mexico (%)
Place of birth for the foreign-born population - Nicaragua (%)
Place of birth for the foreign-born population - Panama (%)
Place of birth for the foreign-born population - Other Central America (%)
Place of birth for the foreign-born population - Argentina (%)
Place of birth for the foreign-born population - Bolivia (%)
Place of birth for the foreign-born population - Brazil (%)
Place of birth for the foreign-born population - Chile (%)
Place of birth for the foreign-born population - Colombia (%)
Place of birth for the foreign-born population - Ecuador (%)
Place of birth for the foreign-born population - Guyana (%)
Place of birth for the foreign-born population - Peru (%)
Place of birth for the foreign-born population - Uruguay (%)
Place of birth for the foreign-born population - Venezuela (%)
Place of birth for the foreign-born population - Other South America (%)
Place of birth for the foreign-born population - Canada (%)
Place of birth for the foreign-born population - Other Northern America (%)
Place of birth for the foreign-born population - Other (%)
Irish Celtic Festival, Palmetto Heritage Festival, Festival of the Arts, Paul Anka & Baseball, all this weekend! (0 replies)Gem Jewelry & Bead Show, Special Olympics Paddle Competition, Opera Open House, Wrestling & More, all this weekend! (0 replies)DeSoto Heritage Grand Parade, SRQ Comic-Con, Rowing Championships, BIG Car Show, Tattoo Expo & more, all this weekend! (1 reply)Downtown SRQ Blues Festival, Quilts on Parade, Gamble Plantation Open House, NHRA Pro Mods & more, all this weekend! (2 replies)Sarasota & Manatee Counties news thread (5141 replies)Der Dutchman, Owen’s Fish Camp, Nicky’s On Palm: Restaurant News (278 replies)
Latest news about races in Tamiami, FL collected exclusively by city-data.com from local newspapers, TV, and radio stations
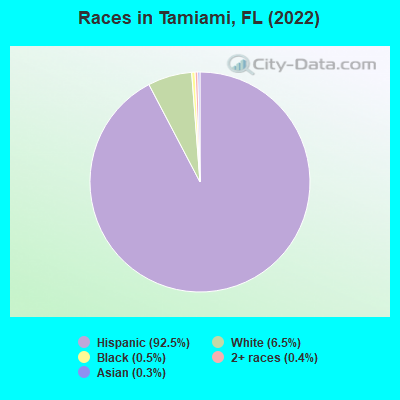
According to 2022 data, the most numerous races in Tamiami, FL are White alone (3,396 residents), Hispanic (48,631 residents), and Black alone (286 residents). 7.7% of Tamiami residents speak English at home. 67.2% of Tamiami, FL residents are foreign-born (65.8% born in Latin America), which is 68.8% greater than the foreign-born rate of 21.0% across the entire state of Florida.
Race distribution in Tamiami
2000 2022
10,458,509 65.4% White alone 2,682,715 16.8% Hispanic 2,264,268 14.2% Black alone 261,693 1.6% Asian alone 236,954 1.5% Two or more races 42,358 0.3% American Indian alone 28,994 0.2% Other race alone 6,887 0.04% Native Hawaiian and Other
11,309,403 50.8% White alone 6,025,039 27.1% Hispanic 3,241,015 14.6% Black alone 861,630 3.9% Two or more races 623,692 2.8% Asian alone 152,054 0.7% Other race alone 22,504 0.1% American Indian alone 9,486 0.04% Native Hawaiian and Other
Income and house value in Tamiami Median household income in 2022 $73,014 White non-Hispanic householders$67,577 Black householders$104,493 Asian householders$59,846 Some other race householders$74,598 Two or more races householders$74,750 Hispanic or Latino race householdersMedian 2022 house value $521,611 White Non-Hispanic householders$427,893 Black or African American householders$840,105 American Indian or Alaska Native householders $527,959 Asian householders$524,972 Some other race householders$507,050 Two or more races householders$527,959 Hispanic or Latino householders
Median age by race in Tamiami
40.6 Median age for White residents39.6 41.2 38.0 Median age for Black or African American residents35.6 51.3 52.7 Median age for American Indian / Alaska Native residents-543,352,600.6 87.2 37.9 Median age for Asian residents41.4 34.9 -679,849,340.2 Median age for Native Hawaiian / Pacific Islander residents-858,307,848.3 -443,298,968.6 52.8 Median age for Other race residents50.4 55.4 51.0 Median age for Two or more races residents48.5 53.9 22.8 Median age for White alone residents23.8 21.3 48.2 Median age for Hispanic or Latino residents46.5 49.7
Owner/renter occupied households by race in Tamiami
House owners and renters - White residents 4,262 75.9% Owner occupied1,351 24.1% Renter occupiedHouse owners and renters - Black or African American residents 88 90.5% Owner occupied9 9.5% Renter occupiedHouse owners and renters - American Indian / Alaska Native residents 109 100.0% Owner occupiedHouse owners and renters - Asian residents 26 100.0% Owner occupiedHouse owners and renters - Other race residents 671 74.4% Owner occupied231 25.6% Renter occupiedHouse owners and renters - Two or more races residents 9,224 71.3% Owner occupied3,712 28.7% Renter occupiedHouse owners and renters - White alone residents 509 80.6% Owner occupied123 19.4% Renter occupiedHouse owners and renters - Hispanic or Latino residents 12,831 72.9% Owner occupied4,769 27.1% Renter occupied
Language usage in Tamiami
English speakers - Total 7.7% of residents of Tamiami speak English at home.
90.4% of residents speak Spanish at home 25,162 55.0% Speak English very well20,556 45.0% Speak English less than very well1.6% of residents speak other language at home 564 71.2% Speak English very well228 28.8% Speak English less than very well
English speakers - Born in the United States 39.1% of residents of Tamiami speak English at home.
56.1% of residents speak Spanish at home 1,466 95.9% Speak English very well63 4.1% Speak English less than very well4.1% of residents speak other language at home 98 86.7% Speak English very well15 13.3% Speak English less than very well
English speakers - Native, born elsewhere 4.4% of residents of Tamiami speak English at home.
86.2% of residents speak Spanish at home 1,127 75.4% Speak English very well367 24.6% Speak English less than very well4.4% of residents speak other language at home 76 100.0% Speak English very well
English speakers - Foreign-born 3.2% of residents of Tamiami speak English at home.
95.2% of residents speak Spanish at home 13,813 41.3% Speak English very well19,623 58.7% Speak English less than very well1.2% of residents speak other language at home 263 61.3% Speak English very well166 38.7% Speak English less than very well
White (Caucasian) - Speak only English Native:
23.4% (1,808)Foreign-born:
6.0% (452)
White (Caucasian) - Speak another language Native:
65.5% (5,049)Foreign-born:
92.7% (6,974)
Black or African American - Speak only English Native:
70.8% (184)Foreign-born:
30.7% (64)
Black or African American - Speak another language Native:
29.2% (76)Foreign-born:
69.5% (144)
American Indian / Alaska Native - Speak another language Native:
53.4% (70)Foreign-born:
98.3% (39)
Asian - Speak another language Native:
92.0% (77)Foreign-born:
100.0% (96)
Other race - Speak only English Native:
10.1% (63)Foreign-born:
3.3% (62)
Other race - Speak another language Native:
89.9% (567)Foreign-born:
96.8% (1,824)
Two or more races - Speak only English Native:
12.5% (834)Foreign-born:
1.8% (458)
Two or more races - Speak another language Native:
87.7% (5,854)Foreign-born:
97.8% (25,131)
White alone - Speak only English Native:
50.0% (1,300)Foreign-born:
26.7% (133)
White alone - Speak another language Native:
48.3% (1,257)Foreign-born:
73.4% (365)
Hispanic or Latino - Speak only English Native:
10.0% (1,260)Foreign-born:
2.7% (923)
Hispanic or Latino - Speak another language Native:
89.7% (11,248)Foreign-born:
97.2% (33,377)
Foreign-born residents in Tamiami 35,337 residents are foreign born (65.8% Latin America ).
This city:
67.2%Florida:
21.1%
Marital status for residents in Tamiami Marital status - White (Caucasian) population 15 years and over
Males 35.1% Never married55.3% Now married1.4% Separated1.1% Widowed7.0% DivorcedFemales 28.8% Never married43.5% Now married1.7% Separated9.8% Widowed16.2% DivorcedWomen who gave birth in the past 12 months Now married:
64.5% (129)Unmarried:
35.5% (71)
Women who did not give birth in the past 12 months Now married:
37.8% (1,428)Unmarried:
62.2% (2,352)
Marital status - Black or African American population 15 years and over
Males 47.5% Never married42.5% Now married0.0% Separated0.0% Widowed10.0% DivorcedFemales 31.7% Never married27.5% Now married12.7% Separated13.2% Widowed14.8% DivorcedWomen who did not give birth in the past 12 months Now married:
50.9% (51)Unmarried:
49.1% (49)
Marital status - American Indian / Alaska Native population 15 years and over
Males 0.0% Never married0.0% Now married0.0% Separated0.0% Widowed100.0% DivorcedFemales 0.0% Never married18.8% Now married20.3% Separated0.0% Widowed60.9% DivorcedWomen who gave birth in the past 12 months Now married:
100.0% (21)Unmarried:
0.0% (0)
Marital status - Asian population 15 years and over
Males 57.3% Never married42.7% Now married0.0% Separated0.0% Widowed0.0% DivorcedFemales 33.0% Never married67.0% Now married0.0% Separated0.0% Widowed0.0% DivorcedWomen who did not give birth in the past 12 months Now married:
56.2% (43)Unmarried:
43.8% (33)
Marital status - Other race population 15 years and over
Males 35.0% Never married43.2% Now married1.4% Separated0.0% Widowed20.5% DivorcedFemales 38.1% Never married39.4% Now married4.1% Separated5.8% Widowed12.5% DivorcedWomen who gave birth in the past 12 months Now married:
0.0% (0)Unmarried:
100.0% (40)
Women who did not give birth in the past 12 months Now married:
27.6% (112)Unmarried:
72.4% (293)
Marital status - Two or more races population 15 years and over
Males 38.1% Never married48.3% Now married0.9% Separated3.0% Widowed9.6% DivorcedFemales 23.0% Never married43.8% Now married1.3% Separated12.8% Widowed19.1% DivorcedWomen who gave birth in the past 12 months Now married:
43.9% (75)Unmarried:
56.1% (96)
Women who did not give birth in the past 12 months Now married:
40.5% (2,395)Unmarried:
59.5% (3,514)
Marital status - White alone, not Hispanic / Latino population 15 years and over
Males 64.1% Never married29.6% Now married0.4% Separated1.4% Widowed4.5% DivorcedFemales 41.5% Never married43.5% Now married1.3% Separated6.0% Widowed7.7% DivorcedWomen who gave birth in the past 12 months Now married:
70.8% (33)Unmarried:
29.2% (13)
Women who did not give birth in the past 12 months Now married:
33.2% (216)Unmarried:
66.8% (433)
Marital status - Hispanic or Latino population 15 years and over
Males 34.9% Never married53.0% Now married1.3% Separated1.9% Widowed9.0% DivorcedFemales 26.2% Never married43.2% Now married1.8% Separated11.1% Widowed17.8% DivorcedWomen who gave birth in the past 12 months Now married:
56.1% (255)Unmarried:
43.9% (200)
Women who did not give birth in the past 12 months Now married:
38.9% (3,871)Unmarried:
61.1% (6,092)
Ancestries in Tamiami
516 1.3% American179 0.5% European162 0.4% Brazilian145 0.4% Italian101 0.3% English83 0.2% German55 0.1% Trinidadian and Tobagonian44 0.1% Irish40 0.1% Jordanian39 0.1% Lebanese36 0.09% French36 0.09% Romanian30 0.08% Russian27 0.07% Belizean23 0.06% Scotch-Irish19 0.05% Egyptian17 0.04% Polish17 0.04% Haitian15 0.04% British15 0.04% Israeli13 0.03% French Canadian11 0.03% Austrian11 0.03% Ukrainian10 0.03% Iranian8 0.02% Danish7 0.02% Jamaican2 0.01% Canadian
Geographical mobility in Tamiami Same house 1 year ago 15,246 90.9% White (Caucasian)344 73.5% Black or African American191 100.0% American Indian / Alaska Native169 95.9% Asian2,374 91.4% Other race31,284 94.4% Two or more races2,844 85.7% White alone, not Hispanic / Latino45,391 93.8% Hispanic or LatinoMoved within same county 758 4.5% White / Caucasian32 6.8% Black or African American12 6.7% Asian103 4.0% Other race1,070 3.2% Two or more races244 7.4% White alone, not Hispanic / Latino1,631 3.4% Hispanic or LatinoMoved within same state 85 0.5% White / Caucasian61 13.0% Black or African American122 0.4% Two or more races67 2.0% White alone, not Hispanic / Latino155 0.3% Hispanic or LatinoMoved from different state 173 1.0% White / Caucasian29 6.2% Black or African American26 1.0% Other race36 0.1% Two or more races126 3.8% White alone, not Hispanic / Latino113 0.2% Hispanic or LatinoMoved from abroad 366 2.2% White162 6.3% Other race641 1.9% Two or more races24 0.7% White alone, not Hispanic / Latino1,436 3.0% Hispanic or Latino
Children Nativity (place of birth) in Tamiami
Children under 6 years - Living with two parents Both parents native 346 99.3% Native2 0.7% Foreign-bornBoth parents foreign-born 587 95.7% Native26 4.3% Foreign-bornOne native, one foreign-born parent 237 93.5% Native16 6.5% Foreign-bornChildren under 6 years - Living with one parent Native parent 138 71.9% Native54 28.1% Foreign-bornForeign-born parent 606 64.7% Native331 35.3% Foreign-bornChildren 6 to 17 years - Living with two parents Both parents native 761 100.0% NativeBoth parents foreign-born 1,505 73.5% Native542 26.5% Foreign-bornOne native, one foreign-born parent 666 91.4% Native63 8.6% Foreign-bornChildren 6 to 17 years - Living with one parent Native parent 176 100.0% NativeForeign-born parent 1,279 59.2% Native880 40.8% Foreign-born
Grandparents responsible for own grandchildren in Tamiami
Grandparents (30 to 59 years) White / Caucasian 290 100.0% Not responsible for grandchildrenBlack or African American 6 35.6% Responsible for grandchildren11 64.4% Not responsible for grandchildrenOther race 78 100.0% Not responsible for grandchildrenTwo or more races 385 100.0% Not responsible for grandchildrenHispanic or Latino 727 100.0% Not responsible for grandchildrenGrandparents (60 years and over) White / Caucasian 65 9.1% Responsible for grandchildren652 90.9% Not responsible for grandchildrenBlack or African American 9 60.5% Responsible for grandchildren6 39.5% Not responsible for grandchildrenOther race 1 21.7% Responsible for grandchildren5 78.3% Not responsible for grandchildrenTwo or more races 66 9.3% Responsible for grandchildren644 90.7% Not responsible for grandchildrenHispanic or Latino 183 13.0% Responsible for grandchildren1,228 87.0% Not responsible for grandchildren