Races in Swansea, Massachusetts (MA) Detailed Stats
Ancestries, Foreign-born residents, place of birth

Recent posts about races in Swansea, Massachusetts on our local forum with over 2,400,000 registered users:
 | Big MA Ancestry Data Thread by Town (31 replies) |
| How is Swansea for young family- schools/culture? (20 replies) |
| Physical Media Stores in Massachusetts (29 replies) |
| Fall River demographics? (8 replies) |
| Swansea Touisset waterfront/Brayton Point? (6 replies) |
| Qs re: living in Dartmouth (7 replies) |
8.1% of Swansea, MA residents are foreign-born (6.7% born in Europe), which is 121.2% less than the foreign-born rate of 18.0% across the entire state of Massachusetts.
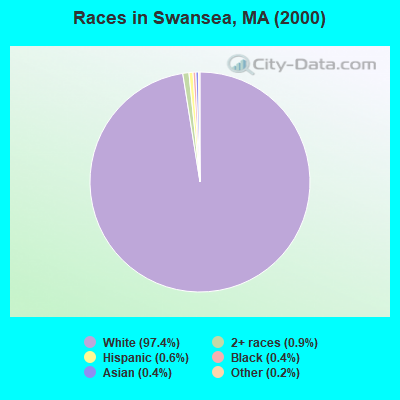
Race distribution in Swansea

- 15,49497.4%White alone
- 1510.9%Two or more races
- 960.6%Hispanic
- 560.4%Asian alone
- 590.4%Black alone
- 340.2%Other race alone
- 110.07%American Indian alone
2000
2022
-
- 5,198,35981.9%White alone
- 428,7296.8%Hispanic
- 318,3295.0%Black alone
- 236,7863.7%Asian alone
- 110,3381.7%Two or more races
- 43,5860.7%Other race alone
- 11,2640.2%American Indian alone
- 1,7060.03%Native Hawaiian and Other
Pacific Islander alone

-
- 4,676,62767.0%White alone
- 911,03813.0%Hispanic
- 501,4637.2%Asian alone
- 459,7406.6%Black alone
- 341,8894.9%Two or more races
- 84,4031.2%Other race alone
- 5,8380.08%American Indian alone
- 9760.01%Native Hawaiian and Other
Pacific Islander alone

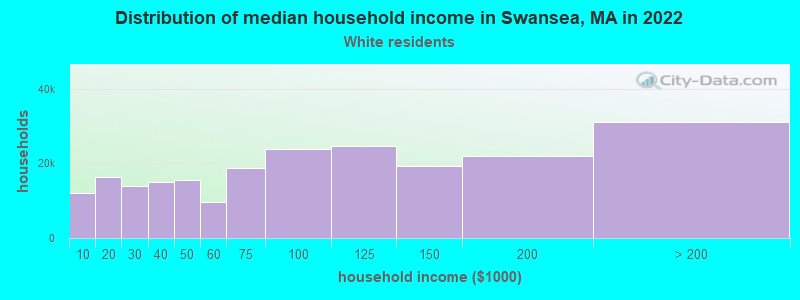
Income and house value in Swansea
- Median household income in 2022
- $100,447White non-Hispanic householders
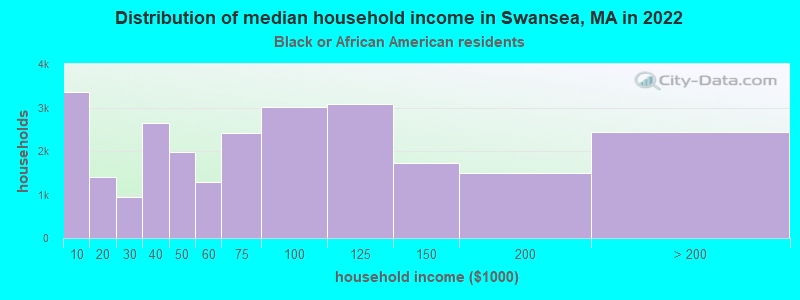
- $170,197Black householders
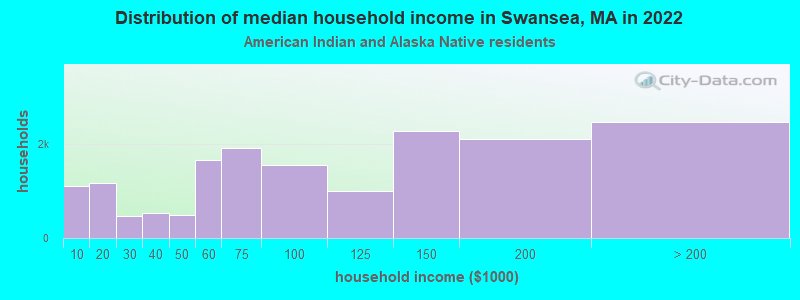
- over $200,000American Indian and Alaska Native householders
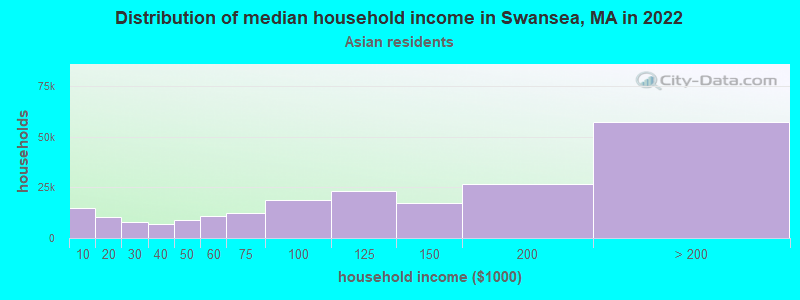
- $142,847Asian householders
- $197,896Some other race householders
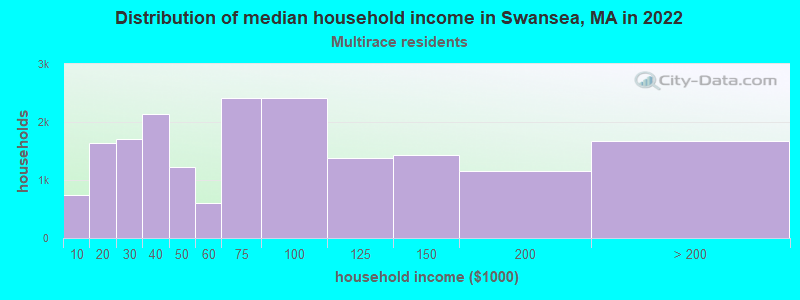
- $72,665Two or more races householders
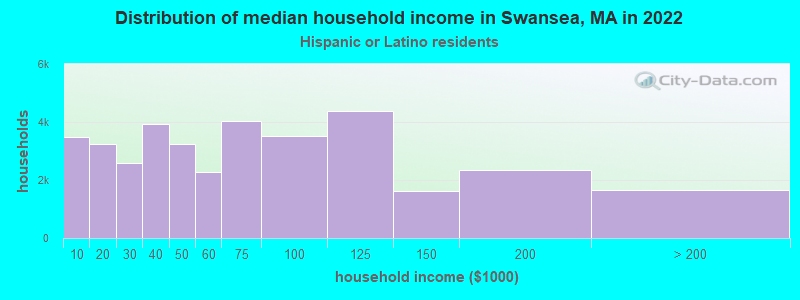
- $122,374Hispanic or Latino race householders
- Median 2022 house value
- $411,442White Non-Hispanic householders
- $403,806Black or African American householders
- $518,634Asian householders
- $403,806Some other race householders
- $386,479Two or more races householders
- $403,806Hispanic or Latino householders
Household income for White non-Hispanic householders
Household income for Black householders
Household income for American Indian and Alaska Native householders
Household income for Asian householders
Household income for Two or more races householders
Household income for Hispanic or Latino race householders
Foreign-born residents in Swansea
1,294 residents are foreign born (6.7% Europe).
| This city: | 8.1% |
| Massachusetts: | 12.2% |
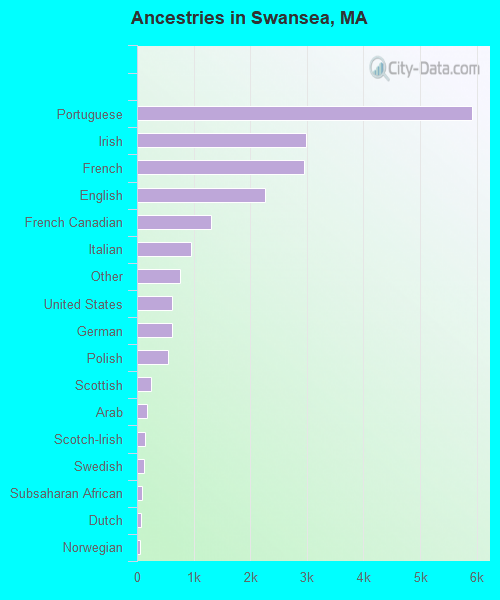
Ancestries in Swansea

- 5,92229.7%Portuguese
- 2,98014.9%Irish
- 2,95614.8%French
- 2,25911.3%English
- 1,2996.5%French Canadian
- 9564.8%Italian
- 7623.8%Other
- 6203.1%United States
- 6183.1%German
- 5402.7%Polish
- 2401.2%Scottish
- 1830.9%Arab
- 1440.7%Scotch-Irish
- 1270.6%Swedish
- 890.4%Subsaharan African
- 660.3%Dutch
- 590.3%Norwegian
- 350.2%Ukrainian
- 310.2%Welsh
- 300.2%Danish
- 230.1%Russian
- 120.06%West Indian
- 80.04%Swiss
- 70.04%Czech
Zip codes: 02777.