Races in Sunset, Florida (FL) Detailed Stats
Data:
Races - White alone (%)
Races - White alone (% change since 2000)
Races - Black alone (%)
Races - Black alone (% change since 2000)
Races - American Indian alone (%)
Races - American Indian alone (% change since 2000)
Races - Asian alone (%)
Races - Asian alone (% change since 2000)
Races - Hispanic (%)
Races - Hispanic (% change since 2000)
Races - Native Hawaiian and Other Pacific Islander alone (%)
Races - Native Hawaiian and Other Pacific Islander alone (% change since 2000)
Races - Two or more races(%)
Races - Two or more races(% change since 2000)
Races - Other race alone (%)
Races - Other race alone (% change since 2000)
Racial diversity
Place of birth - Born in state of residence (%)
Place of birth - Born in state of residence (%) - White
Place of birth - Born in state of residence (%) - Black or African American
Place of birth - Born in state of residence (%) - Asian
Place of birth - Born in state of residence (%) - Hispanic or Latino
Place of birth - Born in state of residence (%) - American Indian and Alaska Native
Place of birth - Born in state of residence (%) - Multirace
Place of birth - Born in state of residence (%) - Other Race
Place of birth - Born in other state (%)
Place of birth - Born in other state (%) - White
Place of birth - Born in other state (%) - Black or African American
Place of birth - Born in other state (%) - Asian
Place of birth - Born in other state (%) - Hispanic or Latino
Place of birth - Born in other state (%) - American Indian and Alaska Native
Place of birth - Born in other state (%) - Multirace
Place of birth - Born in other state (%) - Other Race
Place of birth - Native, outside of US (%)
Place of birth - Native, outside of US (%) - White
Place of birth - Native, outside of US (%) - Black or African American
Place of birth - Native, outside of US (%) - Asian
Place of birth - Native, outside of US (%) - Hispanic or Latino
Place of birth - Native, outside of US (%) - American Indian and Alaska Native
Place of birth - Native, outside of US (%) - Multirace
Place of birth - Native, outside of US (%) - Other Race
Place of birth - Foreign born (%)
Place of birth - Foreign born (%) - White
Place of birth - Foreign born (%) - Black or African American
Place of birth - Foreign born (%) - Asian
Place of birth - Foreign born (%) - Hispanic or Latino
Place of birth - Foreign born (%) - American Indian and Alaska Native
Place of birth - Foreign born (%) - Multirace
Place of birth - Foreign born (%) - Other Race
Residents speaking English at home (%)
Residents speaking English at home - Born in the United States (%)
Residents speaking English at home - Native, born elsewhere (%)
Residents speaking English at home - Foreign born (%)
Residents speaking Spanish at home (%)
Residents speaking Spanish at home - Born in the United States (%)
Residents speaking Spanish at home - Native, born elsewhere (%)
Residents speaking Spanish at home - Foreign born (%)
Residents speaking other language at home (%)
Residents speaking other language at home - Born in the United States (%)
Residents speaking other language at home - Native, born elsewhere (%)
Residents speaking other language at home - Foreign born (%)
Marital status - Never married (%)
Marital status - Now married (%)
Marital status - Separated (%)
Marital status - Widowed (%)
Marital status - Divorced (%)
Ancestries Reported - Arab (%)
Ancestries Reported - Czech (%)
Ancestries Reported - Danish (%)
Ancestries Reported - Dutch (%)
Ancestries Reported - English (%)
Ancestries Reported - French (%)
Ancestries Reported - French Canadian (%)
Ancestries Reported - German (%)
Ancestries Reported - Greek (%)
Ancestries Reported - Hungarian (%)
Ancestries Reported - Irish (%)
Ancestries Reported - Italian (%)
Ancestries Reported - Lithuanian (%)
Ancestries Reported - Norwegian (%)
Ancestries Reported - Polish (%)
Ancestries Reported - Portuguese (%)
Ancestries Reported - Russian (%)
Ancestries Reported - Scotch-Irish (%)
Ancestries Reported - Scottish (%)
Ancestries Reported - Slovak (%)
Ancestries Reported - Subsaharan African (%)
Ancestries Reported - Swedish (%)
Ancestries Reported - Swiss (%)
Ancestries Reported - Ukrainian (%)
Ancestries Reported - United States (%)
Ancestries Reported - Welsh (%)
Ancestries Reported - West Indian (%)
Ancestries Reported - Other (%)
Geographical mobility - Same house 1 year ago (%)
Geographical mobility - Same house 1 year ago (%) - White
Geographical mobility - Same house 1 year ago (%) - Black or African American
Geographical mobility - Same house 1 year ago (%) - Asian
Geographical mobility - Same house 1 year ago (%) - Hispanic or Latino
Geographical mobility - Same house 1 year ago (%) - American Indian and Alaska Native
Geographical mobility - Same house 1 year ago (%) - Multirace
Geographical mobility - Same house 1 year ago (%) - Other Race
Geographical mobility - Moved within same county (%)
Geographical mobility - Moved within same county (%) - White
Geographical mobility - Moved within same county (%) - Black or African American
Geographical mobility - Moved within same county (%) - Asian
Geographical mobility - Moved within same county (%) - Hispanic or Latino
Geographical mobility - Moved within same county (%) - American Indian and Alaska Native
Geographical mobility - Moved within same county (%) - Multirace
Geographical mobility - Moved within same county (%) - Other Race
Geographical mobility - Moved from different county within same state (%)
Geographical mobility - Moved from different county within same state (%) - White
Geographical mobility - Moved from different county within same state (%) - Black or African American
Geographical mobility - Moved from different county within same state (%) - Asian
Geographical mobility - Moved from different county within same state (%) - Hispanic or Latino
Geographical mobility - Moved from different county within same state (%) - American Indian and Alaska Native
Geographical mobility - Moved from different county within same state (%) - Multirace
Geographical mobility - Moved from different county within same state (%) - Other Race
Geographical mobility - Moved from different state (%)
Geographical mobility - Moved from different state (%) - White
Geographical mobility - Moved from different state (%) - Black or African American
Geographical mobility - Moved from different state (%) - Asian
Geographical mobility - Moved from different state (%) - Hispanic or Latino
Geographical mobility - Moved from different state (%) - American Indian and Alaska Native
Geographical mobility - Moved from different state (%) - Multirace
Geographical mobility - Moved from different state (%) - Other Race
Geographical mobility - Moved from abroad (%)
Geographical mobility - Moved from abroad (%) - White
Geographical mobility - Moved from abroad (%) - Black or African American
Geographical mobility - Moved from abroad (%) - Asian
Geographical mobility - Moved from abroad (%) - Hispanic or Latino
Geographical mobility - Moved from abroad (%) - American Indian and Alaska Native
Geographical mobility - Moved from abroad (%) - Multirace
Geographical mobility - Moved from abroad (%) - Other Race
Place of birth for the foreign-born population - Ireland (%)
Place of birth for the foreign-born population - Denmark (%)
Place of birth for the foreign-born population - Norway (%)
Place of birth for the foreign-born population - Sweden (%)
Place of birth for the foreign-born population - United Kingdom (%)
Place of birth for the foreign-born population - England (%)
Place of birth for the foreign-born population - Scotland (%)
Place of birth for the foreign-born population - Other Northern Europe (%)
Place of birth for the foreign-born population - Austria (%)
Place of birth for the foreign-born population - Belgium (%)
Place of birth for the foreign-born population - France (%)
Place of birth for the foreign-born population - Germany (%)
Place of birth for the foreign-born population - Netherlands (%)
Place of birth for the foreign-born population - Switzerland (%)
Place of birth for the foreign-born population - Other Western Europe (%)
Place of birth for the foreign-born population - Greece (%)
Place of birth for the foreign-born population - Italy (%)
Place of birth for the foreign-born population - Portugal (%)
Place of birth for the foreign-born population - Spain (%)
Place of birth for the foreign-born population - Other Southern Europe (%)
Place of birth for the foreign-born population - Albania (%)
Place of birth for the foreign-born population - Belarus (%)
Place of birth for the foreign-born population - Bosnia and Herzegovina (%)
Place of birth for the foreign-born population - Bulgaria (%)
Place of birth for the foreign-born population - Croatia (%)
Place of birth for the foreign-born population - Czechoslovakia (%)
Place of birth for the foreign-born population - Hungary (%)
Place of birth for the foreign-born population - Latvia (%)
Place of birth for the foreign-born population - Lithuania (%)
Place of birth for the foreign-born population - North Macedonia (Macedonia) (%)
Place of birth for the foreign-born population - Moldova (%)
Place of birth for the foreign-born population - Poland (%)
Place of birth for the foreign-born population - Romania (%)
Place of birth for the foreign-born population - Russia (%)
Place of birth for the foreign-born population - Serbia (%)
Place of birth for the foreign-born population - Ukraine (%)
Place of birth for the foreign-born population - Other Eastern Europe (%)
Place of birth for the foreign-born population - China (%)
Place of birth for the foreign-born population - Hong Kong (%)
Place of birth for the foreign-born population - Taiwan (%)
Place of birth for the foreign-born population - Japan (%)
Place of birth for the foreign-born population - Korea (%)
Place of birth for the foreign-born population - Other Eastern Asia (%)
Place of birth for the foreign-born population - Afghanistan (%)
Place of birth for the foreign-born population - Bangladesh (%)
Place of birth for the foreign-born population - India (%)
Place of birth for the foreign-born population - Iran (%)
Place of birth for the foreign-born population - Kazakhstan (%)
Place of birth for the foreign-born population - Nepal (%)
Place of birth for the foreign-born population - Pakistan (%)
Place of birth for the foreign-born population - Sri Lanka (%)
Place of birth for the foreign-born population - Uzbekistan (%)
Place of birth for the foreign-born population - Other South Central Asia (%)
Place of birth for the foreign-born population - Burma (%)
Place of birth for the foreign-born population - Cambodia (%)
Place of birth for the foreign-born population - Indonesia (%)
Place of birth for the foreign-born population - Laos (%)
Place of birth for the foreign-born population - Malaysia (%)
Place of birth for the foreign-born population - Philippines (%)
Place of birth for the foreign-born population - Singapore (%)
Place of birth for the foreign-born population - Thailand (%)
Place of birth for the foreign-born population - Vietnam (%)
Place of birth for the foreign-born population - Other South Eastern Asia (%)
Place of birth for the foreign-born population - Armenia (%)
Place of birth for the foreign-born population - Iraq (%)
Place of birth for the foreign-born population - Israel (%)
Place of birth for the foreign-born population - Jordan (%)
Place of birth for the foreign-born population - Kuwait (%)
Place of birth for the foreign-born population - Lebanon (%)
Place of birth for the foreign-born population - Saudi Arabia (%)
Place of birth for the foreign-born population - Syria (%)
Place of birth for the foreign-born population - Turkey (%)
Place of birth for the foreign-born population - Yemen (%)
Place of birth for the foreign-born population - Other Western Asia (%)
Place of birth for the foreign-born population - Eritrea (%)
Place of birth for the foreign-born population - Ethiopia (%)
Place of birth for the foreign-born population - Kenya (%)
Place of birth for the foreign-born population - Somalia (%)
Place of birth for the foreign-born population - Uganda (%)
Place of birth for the foreign-born population - Zimbabwe (%)
Place of birth for the foreign-born population - Other Eastern Africa (%)
Place of birth for the foreign-born population - Cameroon (%)
Place of birth for the foreign-born population - Congo (%)
Place of birth for the foreign-born population - Democratic Republic of Congo (Zaire) (%)
Place of birth for the foreign-born population - Other Middle Africa (%)
Place of birth for the foreign-born population - Egypt (%)
Place of birth for the foreign-born population - Morocco (%)
Place of birth for the foreign-born population - Sudan (%)
Place of birth for the foreign-born population - Other Northern Africa (%)
Place of birth for the foreign-born population - South Africa (%)
Place of birth for the foreign-born population - Other Southern Africa (%)
Place of birth for the foreign-born population - Cabo Verde (%)
Place of birth for the foreign-born population - Ghana (%)
Place of birth for the foreign-born population - Liberia (%)
Place of birth for the foreign-born population - Nigeria (%)
Place of birth for the foreign-born population - Senegal (%)
Place of birth for the foreign-born population - Sierra Leone (%)
Place of birth for the foreign-born population - Other Western Africa (%)
Place of birth for the foreign-born population - Australia (%)
Place of birth for the foreign-born population - New Zealand (%)
Place of birth for the foreign-born population - Fiji (%)
Place of birth for the foreign-born population - Micronesia (%)
Place of birth for the foreign-born population - Bahamas (%)
Place of birth for the foreign-born population - Barbados (%)
Place of birth for the foreign-born population - Cuba (%)
Place of birth for the foreign-born population - Dominica (%)
Place of birth for the foreign-born population - Dominican Republic (%)
Place of birth for the foreign-born population - Grenada (%)
Place of birth for the foreign-born population - Haiti (%)
Place of birth for the foreign-born population - Jamaica (%)
Place of birth for the foreign-born population - St. Vincent and the Grenadines (%)
Place of birth for the foreign-born population - Trinidad and Tobago (%)
Place of birth for the foreign-born population - West Indies (%)
Place of birth for the foreign-born population - Other Caribbean (%)
Place of birth for the foreign-born population - Belize (%)
Place of birth for the foreign-born population - Costa Rica (%)
Place of birth for the foreign-born population - El Salvador (%)
Place of birth for the foreign-born population - Guatemala (%)
Place of birth for the foreign-born population - Honduras (%)
Place of birth for the foreign-born population - Mexico (%)
Place of birth for the foreign-born population - Nicaragua (%)
Place of birth for the foreign-born population - Panama (%)
Place of birth for the foreign-born population - Other Central America (%)
Place of birth for the foreign-born population - Argentina (%)
Place of birth for the foreign-born population - Bolivia (%)
Place of birth for the foreign-born population - Brazil (%)
Place of birth for the foreign-born population - Chile (%)
Place of birth for the foreign-born population - Colombia (%)
Place of birth for the foreign-born population - Ecuador (%)
Place of birth for the foreign-born population - Guyana (%)
Place of birth for the foreign-born population - Peru (%)
Place of birth for the foreign-born population - Uruguay (%)
Place of birth for the foreign-born population - Venezuela (%)
Place of birth for the foreign-born population - Other South America (%)
Place of birth for the foreign-born population - Canada (%)
Place of birth for the foreign-born population - Other Northern America (%)
Place of birth for the foreign-born population - Other (%)
Latest news about races in Sunset, FL collected exclusively by city-data.com from local newspapers, TV, and radio stations
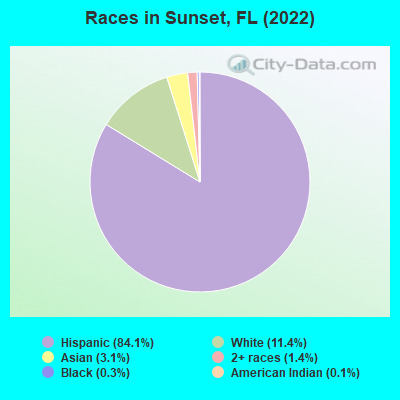
According to 2022 data, the most numerous races in Sunset, FL are White alone (1,572 residents), Hispanic (11,602 residents), and Black alone (47 residents). 16.0% of Sunset residents speak English at home. 57.5% of Sunset, FL residents are foreign-born (53.0% born in Latin America), which is 63.4% greater than the foreign-born rate of 21.0% across the entire state of Florida.
Race distribution in Sunset
2000 2022
10,458,509 65.4% White alone 2,682,715 16.8% Hispanic 2,264,268 14.2% Black alone 261,693 1.6% Asian alone 236,954 1.5% Two or more races 42,358 0.3% American Indian alone 28,994 0.2% Other race alone 6,887 0.04% Native Hawaiian and Other
11,309,403 50.8% White alone 6,025,039 27.1% Hispanic 3,241,015 14.6% Black alone 861,630 3.9% Two or more races 623,692 2.8% Asian alone 152,054 0.7% Other race alone 22,504 0.1% American Indian alone 9,486 0.04% Native Hawaiian and Other
Income and house value in Sunset Median household income in 2022 $125,735 White non-Hispanic householders$124,485 Asian householders$87,732 Some other race householders$101,739 Two or more races householders$100,631 Hispanic or Latino race householdersMedian 2022 house value $546,093 White Non-Hispanic householders$482,626 Black or African American householders $474,605 Asian householders$568,411 Some other race householders$435,898 Two or more races householders$576,082 Hispanic or Latino householders
Median age by race in Sunset
41.9 Median age for White residents42.8 41.3 51.2 Median age for Black or African American residents43.0 53.5 45.6 Median age for American Indian / Alaska Native residents37.9 -762,696,213.5 42.0 Median age for Asian residents45.0 38.3 -679,849,340.2 Median age for Native Hawaiian / Pacific Islander residents-858,307,848.3 -443,298,968.6 34.0 Median age for Other race residents34.0 48.0 52.2 Median age for Two or more races residents49.7 56.0 44.1 Median age for White alone residents41.7 47.9 48.3 Median age for Hispanic or Latino residents48.3 48.6
Owner/renter occupied households by race in Sunset
House owners and renters - White residents 1,326 77.7% Owner occupied380 22.3% Renter occupiedHouse owners and renters - American Indian / Alaska Native residents 23 100.0% Renter occupiedHouse owners and renters - Asian residents 137 93.0% Owner occupied10 7.0% Renter occupiedHouse owners and renters - Other race residents 53 28.4% Owner occupied134 71.6% Renter occupiedHouse owners and renters - Two or more races residents 2,792 81.1% Owner occupied651 18.9% Renter occupiedHouse owners and renters - White alone residents 451 92.6% Owner occupied36 7.4% Renter occupiedHouse owners and renters - Hispanic or Latino residents 3,464 75.3% Owner occupied1,135 24.7% Renter occupied
Language usage in Sunset
English speakers - Total 16.0% of residents of Sunset speak English at home.
80.0% of residents speak Spanish at home 6,699 64.6% Speak English very well3,667 35.4% Speak English less than very well3.6% of residents speak other language at home 432 93.7% Speak English very well29 6.3% Speak English less than very well
English speakers - Born in the United States 59.2% of residents of Sunset speak English at home.
40.0% of residents speak Spanish at home 450 93.2% Speak English very well33 6.8% Speak English less than very well
English speakers - Native, born elsewhere 18.8% of residents of Sunset speak English at home.
72.5% of residents speak Spanish at home 86 51.8% Speak English very well80 48.2% Speak English less than very well7.9% of residents speak other language at home 18 100.0% Speak English very well
English speakers - Foreign-born 5.9% of residents of Sunset speak English at home.
89.2% of residents speak Spanish at home 3,624 51.4% Speak English very well3,433 48.6% Speak English less than very well4.2% of residents speak other language at home 302 91.5% Speak English very well28 8.5% Speak English less than very well
White (Caucasian) - Speak only English Native:
51.7% (1,225)Foreign-born:
6.5% (113)
White (Caucasian) - Speak another language Native:
47.1% (1,118)Foreign-born:
92.4% (1,613)
Black or African American - Speak only English Native:
55.2% (15)Foreign-born:
98.0% (19)
Black or African American - Speak another language Native:
44.8% (12)Foreign-born:
9.2% (2)
Asian - Speak only English Native:
71.7% (87)Foreign-born:
34.9% (96)
Asian - Speak another language Native:
29.1% (35)Foreign-born:
62.0% (171)
Other race - Speak only English Native:
62.0% (22)Foreign-born:
21.1% (86)
Other race - Speak another language Native:
38.4% (13)Foreign-born:
78.6% (320)
Two or more races - Speak only English Native:
10.6% (290)Foreign-born:
2.8% (148)
Two or more races - Speak another language Native:
89.6% (2,438)Foreign-born:
96.9% (5,045)
White alone - Speak only English Native:
78.4% (906)Foreign-born:
14.6% (38)
White alone - Speak another language Native:
21.7% (251)Foreign-born:
82.5% (214)
Hispanic or Latino - Speak only English Native:
16.6% (618)Foreign-born:
4.2% (303)
Hispanic or Latino - Speak another language Native:
83.4% (3,101)Foreign-born:
95.8% (6,989)
Foreign-born residents in Sunset 7,930 residents are foreign born (53.0% Latin America ).
This city:
57.5%Florida:
21.1%
Marital status for residents in Sunset Marital status - White (Caucasian) population 15 years and over
Males 23.9% Never married65.0% Now married0.0% Separated1.9% Widowed9.3% DivorcedFemales 20.5% Never married51.4% Now married3.4% Separated9.6% Widowed15.0% DivorcedWomen who gave birth in the past 12 months Now married:
75.0% (21)Unmarried:
25.0% (7)
Women who did not give birth in the past 12 months Now married:
52.5% (548)Unmarried:
47.5% (497)
Marital status - Black or African American population 15 years and over
Males 15.8% Never married68.4% Now married0.0% Separated0.0% Widowed15.8% DivorcedFemales 25.8% Never married6.5% Now married67.7% Separated0.0% Widowed0.0% DivorcedWomen who did not give birth in the past 12 months Now married:
0.0% (0)Unmarried:
100.0% (6)
Marital status - Asian population 15 years and over
Males 0.0% Never married89.3% Now married10.7% Separated0.0% Widowed0.0% DivorcedFemales 0.0% Never married100.0% Now married0.0% Separated0.0% Widowed0.0% DivorcedWomen who did not give birth in the past 12 months Now married:
100.0% (81)Unmarried:
0.0% (0)
Marital status - Other race population 15 years and over
Males 23.4% Never married69.7% Now married0.0% Separated0.0% Widowed6.9% DivorcedFemales 13.4% Never married49.2% Now married5.6% Separated0.0% Widowed31.8% DivorcedWomen who did not give birth in the past 12 months Now married:
52.9% (64)Unmarried:
47.1% (57)
Marital status - Two or more races population 15 years and over
Males 29.3% Never married62.1% Now married0.9% Separated0.6% Widowed7.1% DivorcedFemales 22.0% Never married39.7% Now married1.9% Separated10.5% Widowed25.9% DivorcedWomen who gave birth in the past 12 months Now married:
100.0% (64)Unmarried:
0.0% (0)
Women who did not give birth in the past 12 months Now married:
49.2% (669)Unmarried:
50.8% (689)
Marital status - White alone, not Hispanic / Latino population 15 years and over
Males 30.4% Never married58.5% Now married0.0% Separated2.3% Widowed8.8% DivorcedFemales 19.3% Never married54.9% Now married1.1% Separated6.0% Widowed18.7% DivorcedWomen who gave birth in the past 12 months Now married:
100.0% (15)Unmarried:
0.0% (0)
Women who did not give birth in the past 12 months Now married:
58.2% (140)Unmarried:
41.8% (100)
Marital status - Hispanic or Latino population 15 years and over
Males 25.5% Never married64.6% Now married0.4% Separated1.2% Widowed8.3% DivorcedFemales 21.2% Never married45.8% Now married3.1% Separated10.1% Widowed19.7% DivorcedWomen who gave birth in the past 12 months Now married:
80.3% (52)Unmarried:
19.7% (13)
Women who did not give birth in the past 12 months Now married:
50.7% (1,279)Unmarried:
49.3% (1,244)
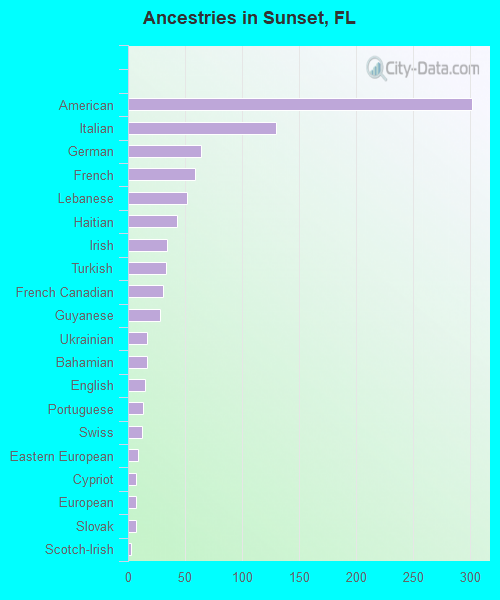
Ancestries in Sunset
302 3.2% American130 1.4% Italian64 0.7% German59 0.6% French52 0.5% Lebanese43 0.5% Haitian34 0.4% Irish33 0.3% Turkish31 0.3% French Canadian28 0.3% Guyanese17 0.2% Ukrainian17 0.2% Bahamian15 0.2% English13 0.1% Portuguese12 0.1% Swiss9 0.09% Eastern European7 0.07% Cypriot7 0.07% European7 0.07% Slovak3 0.03% Scotch-Irish2 0.02% British
Children Nativity (place of birth) in Sunset
Children under 6 years - Living with two parents Both parents native 252 100.0% NativeBoth parents foreign-born 316 100.0% NativeOne native, one foreign-born parent 225 100.0% NativeChildren under 6 years - Living with one parent Native parent 5 90.3% Native1 9.7% Foreign-bornForeign-born parent 15 54.6% Native12 45.4% Foreign-bornChildren 6 to 17 years - Living with two parents Both parents native 371 100.0% NativeBoth parents foreign-born 288 73.3% Native105 26.7% Foreign-bornOne native, one foreign-born parent 241 93.7% Native16 6.3% Foreign-bornChildren 6 to 17 years - Living with one parent Foreign-born parent 225 58.8% Native158 41.2% Foreign-born
Grandparents responsible for own grandchildren in Sunset
Grandparents (30 to 59 years) White / Caucasian 8 100.0% Not responsible for grandchildrenTwo or more races 16 44.0% Responsible for grandchildren20 56.0% Not responsible for grandchildrenHispanic or Latino 8 26.9% Responsible for grandchildren22 73.1% Not responsible for grandchildrenGrandparents (60 years and over) White / Caucasian 8 6.1% Responsible for grandchildren119 93.9% Not responsible for grandchildrenTwo or more races 26 100.0% Not responsible for grandchildrenHispanic or Latino 7 5.0% Responsible for grandchildren131 95.0% Not responsible for grandchildren