Races in Sunrise Manor, Nevada (NV) Detailed Stats
Data:
Races - White alone (%)
Races - White alone (% change since 2000)
Races - Black alone (%)
Races - Black alone (% change since 2000)
Races - American Indian alone (%)
Races - American Indian alone (% change since 2000)
Races - Asian alone (%)
Races - Asian alone (% change since 2000)
Races - Hispanic (%)
Races - Hispanic (% change since 2000)
Races - Native Hawaiian and Other Pacific Islander alone (%)
Races - Native Hawaiian and Other Pacific Islander alone (% change since 2000)
Races - Two or more races(%)
Races - Two or more races(% change since 2000)
Races - Other race alone (%)
Races - Other race alone (% change since 2000)
Racial diversity
Place of birth - Born in state of residence (%)
Place of birth - Born in state of residence (%) - White
Place of birth - Born in state of residence (%) - Black or African American
Place of birth - Born in state of residence (%) - Asian
Place of birth - Born in state of residence (%) - Hispanic or Latino
Place of birth - Born in state of residence (%) - American Indian and Alaska Native
Place of birth - Born in state of residence (%) - Multirace
Place of birth - Born in state of residence (%) - Other Race
Place of birth - Born in other state (%)
Place of birth - Born in other state (%) - White
Place of birth - Born in other state (%) - Black or African American
Place of birth - Born in other state (%) - Asian
Place of birth - Born in other state (%) - Hispanic or Latino
Place of birth - Born in other state (%) - American Indian and Alaska Native
Place of birth - Born in other state (%) - Multirace
Place of birth - Born in other state (%) - Other Race
Place of birth - Native, outside of US (%)
Place of birth - Native, outside of US (%) - White
Place of birth - Native, outside of US (%) - Black or African American
Place of birth - Native, outside of US (%) - Asian
Place of birth - Native, outside of US (%) - Hispanic or Latino
Place of birth - Native, outside of US (%) - American Indian and Alaska Native
Place of birth - Native, outside of US (%) - Multirace
Place of birth - Native, outside of US (%) - Other Race
Place of birth - Foreign born (%)
Place of birth - Foreign born (%) - White
Place of birth - Foreign born (%) - Black or African American
Place of birth - Foreign born (%) - Asian
Place of birth - Foreign born (%) - Hispanic or Latino
Place of birth - Foreign born (%) - American Indian and Alaska Native
Place of birth - Foreign born (%) - Multirace
Place of birth - Foreign born (%) - Other Race
Residents speaking English at home (%)
Residents speaking English at home - Born in the United States (%)
Residents speaking English at home - Native, born elsewhere (%)
Residents speaking English at home - Foreign born (%)
Residents speaking Spanish at home (%)
Residents speaking Spanish at home - Born in the United States (%)
Residents speaking Spanish at home - Native, born elsewhere (%)
Residents speaking Spanish at home - Foreign born (%)
Residents speaking other language at home (%)
Residents speaking other language at home - Born in the United States (%)
Residents speaking other language at home - Native, born elsewhere (%)
Residents speaking other language at home - Foreign born (%)
Marital status - Never married (%)
Marital status - Now married (%)
Marital status - Separated (%)
Marital status - Widowed (%)
Marital status - Divorced (%)
Ancestries Reported - Arab (%)
Ancestries Reported - Czech (%)
Ancestries Reported - Danish (%)
Ancestries Reported - Dutch (%)
Ancestries Reported - English (%)
Ancestries Reported - French (%)
Ancestries Reported - French Canadian (%)
Ancestries Reported - German (%)
Ancestries Reported - Greek (%)
Ancestries Reported - Hungarian (%)
Ancestries Reported - Irish (%)
Ancestries Reported - Italian (%)
Ancestries Reported - Lithuanian (%)
Ancestries Reported - Norwegian (%)
Ancestries Reported - Polish (%)
Ancestries Reported - Portuguese (%)
Ancestries Reported - Russian (%)
Ancestries Reported - Scotch-Irish (%)
Ancestries Reported - Scottish (%)
Ancestries Reported - Slovak (%)
Ancestries Reported - Subsaharan African (%)
Ancestries Reported - Swedish (%)
Ancestries Reported - Swiss (%)
Ancestries Reported - Ukrainian (%)
Ancestries Reported - United States (%)
Ancestries Reported - Welsh (%)
Ancestries Reported - West Indian (%)
Ancestries Reported - Other (%)
Geographical mobility - Same house 1 year ago (%)
Geographical mobility - Same house 1 year ago (%) - White
Geographical mobility - Same house 1 year ago (%) - Black or African American
Geographical mobility - Same house 1 year ago (%) - Asian
Geographical mobility - Same house 1 year ago (%) - Hispanic or Latino
Geographical mobility - Same house 1 year ago (%) - American Indian and Alaska Native
Geographical mobility - Same house 1 year ago (%) - Multirace
Geographical mobility - Same house 1 year ago (%) - Other Race
Geographical mobility - Moved within same county (%)
Geographical mobility - Moved within same county (%) - White
Geographical mobility - Moved within same county (%) - Black or African American
Geographical mobility - Moved within same county (%) - Asian
Geographical mobility - Moved within same county (%) - Hispanic or Latino
Geographical mobility - Moved within same county (%) - American Indian and Alaska Native
Geographical mobility - Moved within same county (%) - Multirace
Geographical mobility - Moved within same county (%) - Other Race
Geographical mobility - Moved from different county within same state (%)
Geographical mobility - Moved from different county within same state (%) - White
Geographical mobility - Moved from different county within same state (%) - Black or African American
Geographical mobility - Moved from different county within same state (%) - Asian
Geographical mobility - Moved from different county within same state (%) - Hispanic or Latino
Geographical mobility - Moved from different county within same state (%) - American Indian and Alaska Native
Geographical mobility - Moved from different county within same state (%) - Multirace
Geographical mobility - Moved from different county within same state (%) - Other Race
Geographical mobility - Moved from different state (%)
Geographical mobility - Moved from different state (%) - White
Geographical mobility - Moved from different state (%) - Black or African American
Geographical mobility - Moved from different state (%) - Asian
Geographical mobility - Moved from different state (%) - Hispanic or Latino
Geographical mobility - Moved from different state (%) - American Indian and Alaska Native
Geographical mobility - Moved from different state (%) - Multirace
Geographical mobility - Moved from different state (%) - Other Race
Geographical mobility - Moved from abroad (%)
Geographical mobility - Moved from abroad (%) - White
Geographical mobility - Moved from abroad (%) - Black or African American
Geographical mobility - Moved from abroad (%) - Asian
Geographical mobility - Moved from abroad (%) - Hispanic or Latino
Geographical mobility - Moved from abroad (%) - American Indian and Alaska Native
Geographical mobility - Moved from abroad (%) - Multirace
Geographical mobility - Moved from abroad (%) - Other Race
Place of birth for the foreign-born population - Ireland (%)
Place of birth for the foreign-born population - Denmark (%)
Place of birth for the foreign-born population - Norway (%)
Place of birth for the foreign-born population - Sweden (%)
Place of birth for the foreign-born population - United Kingdom (%)
Place of birth for the foreign-born population - England (%)
Place of birth for the foreign-born population - Scotland (%)
Place of birth for the foreign-born population - Other Northern Europe (%)
Place of birth for the foreign-born population - Austria (%)
Place of birth for the foreign-born population - Belgium (%)
Place of birth for the foreign-born population - France (%)
Place of birth for the foreign-born population - Germany (%)
Place of birth for the foreign-born population - Netherlands (%)
Place of birth for the foreign-born population - Switzerland (%)
Place of birth for the foreign-born population - Other Western Europe (%)
Place of birth for the foreign-born population - Greece (%)
Place of birth for the foreign-born population - Italy (%)
Place of birth for the foreign-born population - Portugal (%)
Place of birth for the foreign-born population - Spain (%)
Place of birth for the foreign-born population - Other Southern Europe (%)
Place of birth for the foreign-born population - Albania (%)
Place of birth for the foreign-born population - Belarus (%)
Place of birth for the foreign-born population - Bosnia and Herzegovina (%)
Place of birth for the foreign-born population - Bulgaria (%)
Place of birth for the foreign-born population - Croatia (%)
Place of birth for the foreign-born population - Czechoslovakia (%)
Place of birth for the foreign-born population - Hungary (%)
Place of birth for the foreign-born population - Latvia (%)
Place of birth for the foreign-born population - Lithuania (%)
Place of birth for the foreign-born population - North Macedonia (Macedonia) (%)
Place of birth for the foreign-born population - Moldova (%)
Place of birth for the foreign-born population - Poland (%)
Place of birth for the foreign-born population - Romania (%)
Place of birth for the foreign-born population - Russia (%)
Place of birth for the foreign-born population - Serbia (%)
Place of birth for the foreign-born population - Ukraine (%)
Place of birth for the foreign-born population - Other Eastern Europe (%)
Place of birth for the foreign-born population - China (%)
Place of birth for the foreign-born population - Hong Kong (%)
Place of birth for the foreign-born population - Taiwan (%)
Place of birth for the foreign-born population - Japan (%)
Place of birth for the foreign-born population - Korea (%)
Place of birth for the foreign-born population - Other Eastern Asia (%)
Place of birth for the foreign-born population - Afghanistan (%)
Place of birth for the foreign-born population - Bangladesh (%)
Place of birth for the foreign-born population - India (%)
Place of birth for the foreign-born population - Iran (%)
Place of birth for the foreign-born population - Kazakhstan (%)
Place of birth for the foreign-born population - Nepal (%)
Place of birth for the foreign-born population - Pakistan (%)
Place of birth for the foreign-born population - Sri Lanka (%)
Place of birth for the foreign-born population - Uzbekistan (%)
Place of birth for the foreign-born population - Other South Central Asia (%)
Place of birth for the foreign-born population - Burma (%)
Place of birth for the foreign-born population - Cambodia (%)
Place of birth for the foreign-born population - Indonesia (%)
Place of birth for the foreign-born population - Laos (%)
Place of birth for the foreign-born population - Malaysia (%)
Place of birth for the foreign-born population - Philippines (%)
Place of birth for the foreign-born population - Singapore (%)
Place of birth for the foreign-born population - Thailand (%)
Place of birth for the foreign-born population - Vietnam (%)
Place of birth for the foreign-born population - Other South Eastern Asia (%)
Place of birth for the foreign-born population - Armenia (%)
Place of birth for the foreign-born population - Iraq (%)
Place of birth for the foreign-born population - Israel (%)
Place of birth for the foreign-born population - Jordan (%)
Place of birth for the foreign-born population - Kuwait (%)
Place of birth for the foreign-born population - Lebanon (%)
Place of birth for the foreign-born population - Saudi Arabia (%)
Place of birth for the foreign-born population - Syria (%)
Place of birth for the foreign-born population - Turkey (%)
Place of birth for the foreign-born population - Yemen (%)
Place of birth for the foreign-born population - Other Western Asia (%)
Place of birth for the foreign-born population - Eritrea (%)
Place of birth for the foreign-born population - Ethiopia (%)
Place of birth for the foreign-born population - Kenya (%)
Place of birth for the foreign-born population - Somalia (%)
Place of birth for the foreign-born population - Uganda (%)
Place of birth for the foreign-born population - Zimbabwe (%)
Place of birth for the foreign-born population - Other Eastern Africa (%)
Place of birth for the foreign-born population - Cameroon (%)
Place of birth for the foreign-born population - Congo (%)
Place of birth for the foreign-born population - Democratic Republic of Congo (Zaire) (%)
Place of birth for the foreign-born population - Other Middle Africa (%)
Place of birth for the foreign-born population - Egypt (%)
Place of birth for the foreign-born population - Morocco (%)
Place of birth for the foreign-born population - Sudan (%)
Place of birth for the foreign-born population - Other Northern Africa (%)
Place of birth for the foreign-born population - South Africa (%)
Place of birth for the foreign-born population - Other Southern Africa (%)
Place of birth for the foreign-born population - Cabo Verde (%)
Place of birth for the foreign-born population - Ghana (%)
Place of birth for the foreign-born population - Liberia (%)
Place of birth for the foreign-born population - Nigeria (%)
Place of birth for the foreign-born population - Senegal (%)
Place of birth for the foreign-born population - Sierra Leone (%)
Place of birth for the foreign-born population - Other Western Africa (%)
Place of birth for the foreign-born population - Australia (%)
Place of birth for the foreign-born population - New Zealand (%)
Place of birth for the foreign-born population - Fiji (%)
Place of birth for the foreign-born population - Micronesia (%)
Place of birth for the foreign-born population - Bahamas (%)
Place of birth for the foreign-born population - Barbados (%)
Place of birth for the foreign-born population - Cuba (%)
Place of birth for the foreign-born population - Dominica (%)
Place of birth for the foreign-born population - Dominican Republic (%)
Place of birth for the foreign-born population - Grenada (%)
Place of birth for the foreign-born population - Haiti (%)
Place of birth for the foreign-born population - Jamaica (%)
Place of birth for the foreign-born population - St. Vincent and the Grenadines (%)
Place of birth for the foreign-born population - Trinidad and Tobago (%)
Place of birth for the foreign-born population - West Indies (%)
Place of birth for the foreign-born population - Other Caribbean (%)
Place of birth for the foreign-born population - Belize (%)
Place of birth for the foreign-born population - Costa Rica (%)
Place of birth for the foreign-born population - El Salvador (%)
Place of birth for the foreign-born population - Guatemala (%)
Place of birth for the foreign-born population - Honduras (%)
Place of birth for the foreign-born population - Mexico (%)
Place of birth for the foreign-born population - Nicaragua (%)
Place of birth for the foreign-born population - Panama (%)
Place of birth for the foreign-born population - Other Central America (%)
Place of birth for the foreign-born population - Argentina (%)
Place of birth for the foreign-born population - Bolivia (%)
Place of birth for the foreign-born population - Brazil (%)
Place of birth for the foreign-born population - Chile (%)
Place of birth for the foreign-born population - Colombia (%)
Place of birth for the foreign-born population - Ecuador (%)
Place of birth for the foreign-born population - Guyana (%)
Place of birth for the foreign-born population - Peru (%)
Place of birth for the foreign-born population - Uruguay (%)
Place of birth for the foreign-born population - Venezuela (%)
Place of birth for the foreign-born population - Other South America (%)
Place of birth for the foreign-born population - Canada (%)
Place of birth for the foreign-born population - Other Northern America (%)
Place of birth for the foreign-born population - Other (%)
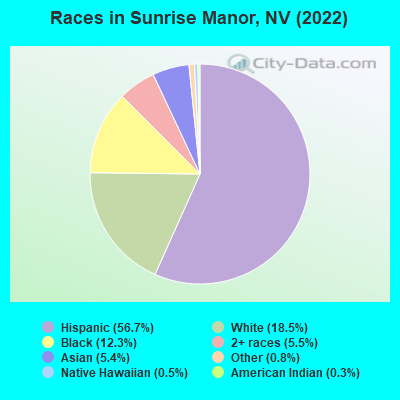
According to 2022 data, the most numerous races in Sunrise Manor, NV are White alone (37,972 residents), Hispanic (116,155 residents), and Black alone (25,223 residents). 46.9% of Sunrise Manor residents speak English at home. 27.1% of Sunrise Manor, NV residents are foreign-born (22.3% born in Latin America, 3.9% born in Asia), which is 33.5% greater than the foreign-born rate of 18.0% across the entire state of Nevada.
Race distribution in Sunrise Manor
2000 2022
81,044 51.9% White alone 40,619 26.0% Hispanic 19,533 12.5% Black alone 8,279 5.3% Asian alone 4,636 3.0% Two or more races 1,113 0.7% American Indian alone 650 0.4% Native Hawaiian and Other 246 0.2% Other race alone
116,155 56.7% Hispanic 37,972 18.5% White alone 25,223 12.3% Black alone 11,325 5.5% Two or more races 11,025 5.4% Asian alone 1,691 0.8% Other race alone 1,016 0.5% Native Hawaiian and Other 578 0.3% American Indian alone
2000 2022
1,303,001 65.2% White alone 393,970 19.7% Hispanic 131,509 6.6% Black alone 88,593 4.4% Asian alone 49,231 2.5% Two or more races 21,397 1.1% American Indian alone 7,769 0.4% Native Hawaiian and Other 2,787 0.1% Other race alone
1,410,145 44.4% White alone 961,357 30.3% Hispanic 286,471 9.0% Black alone 281,149 8.8% Asian alone 182,151 5.7% Two or more races 20,102 0.6% Native Hawaiian and Other 18,781 0.6% Other race alone 17,616 0.6% American Indian alone
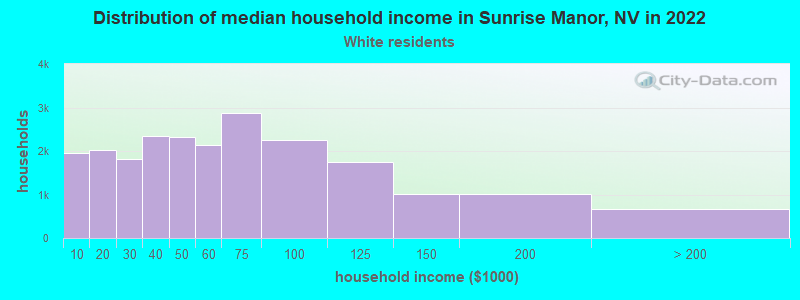
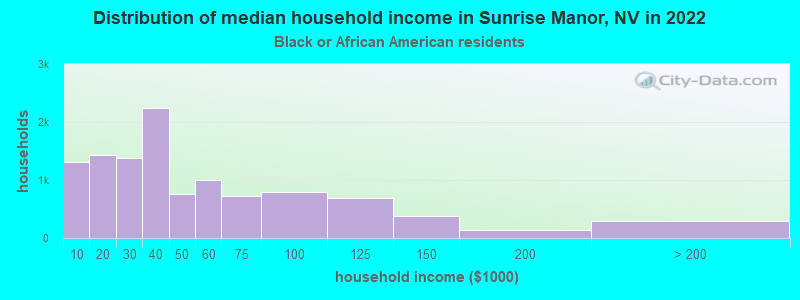
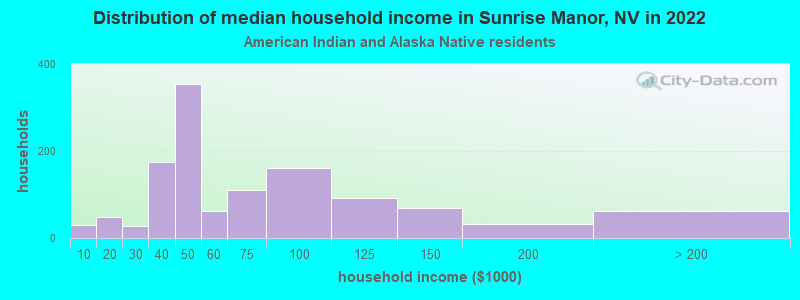
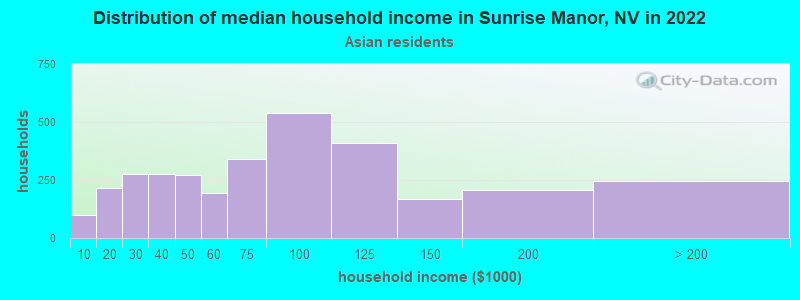
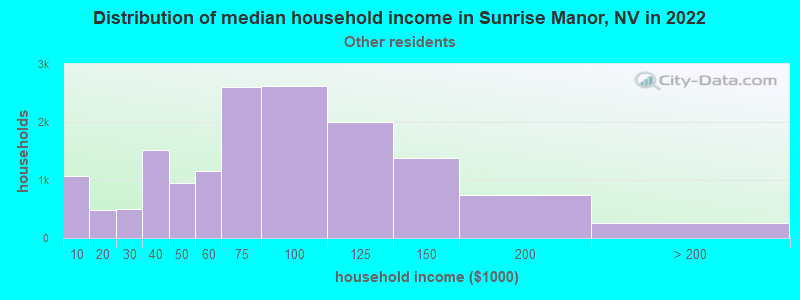
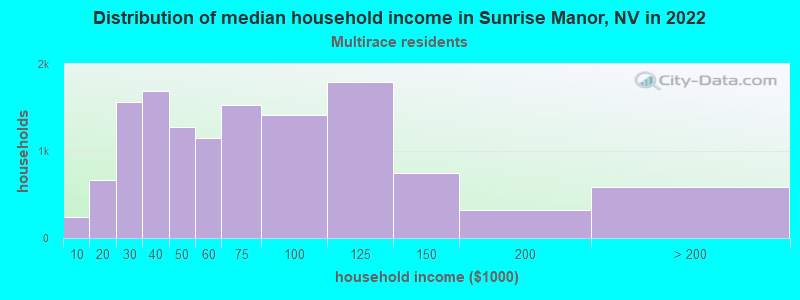
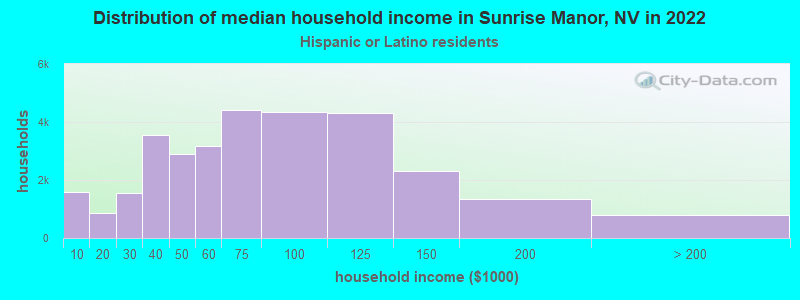
Income and house value in Sunrise Manor Median household income in 2022 $51,552 White non-Hispanic householders$36,146 Black householders$60,790 American Indian and Alaska Native householders$73,520 Asian householders$57,049 Native Hawaiian and other Pacific Islander householders$67,144 Some other race householders$59,616 Two or more races householders$64,011 Hispanic or Latino race householdersMedian 2022 house value $390,290 White Non-Hispanic householders$373,321 Black or African American householders$488,904 American Indian or Alaska Native householders $401,817 Asian householders$360,194 Native Hawaiian and other Pacific Islander householders$370,119 Some other race householders$387,409 Two or more races householders$367,238 Hispanic or Latino householders
Median age by race in Sunrise Manor
46.8 Median age for White residents46.5 47.4 34.7 Median age for Black or African American residents34.0 37.1 31.4 Median age for American Indian / Alaska Native residents24.7 34.4 49.2 Median age for Asian residents55.3 47.7 32.6 Median age for Native Hawaiian / Pacific Islander residents37.4 32.9 30.4 Median age for Other race residents28.3 33.0 30.5 Median age for Two or more races residents29.4 31.2 56.4 Median age for White alone residents56.2 57.0 29.1 Median age for Hispanic or Latino residents28.3 30.1
Owner/renter occupied households by race in Sunrise Manor
House owners and renters - White residents 12,282 55.4% Owner occupied9,875 44.6% Renter occupiedHouse owners and renters - Black or African American residents 3,269 29.4% Owner occupied7,865 70.6% Renter occupiedHouse owners and renters - American Indian / Alaska Native residents 710 51.2% Owner occupied678 48.8% Renter occupiedHouse owners and renters - Asian residents 2,536 70.5% Owner occupied1,063 29.5% Renter occupiedHouse owners and renters - Native Hawaiian / Pacific Islander residents 179 62.5% Owner occupied107 37.5% Renter occupiedHouse owners and renters - Other race residents 8,491 55.6% Owner occupied6,783 44.4% Renter occupiedHouse owners and renters - Two or more races residents 7,474 57.6% Owner occupied5,512 42.4% Renter occupiedHouse owners and renters - White alone residents 9,669 54.9% Owner occupied7,953 45.1% Renter occupiedHouse owners and renters - Hispanic or Latino residents 17,958 57.6% Owner occupied13,197 42.4% Renter occupied
Language usage in Sunrise Manor
English speakers - Total 46.9% of residents of Sunrise Manor speak English at home.
47.9% of residents speak Spanish at home 59,432 64.5% Speak English very well32,751 35.5% Speak English less than very well5.2% of residents speak other language at home 5,279 52.5% Speak English very well4,785 47.5% Speak English less than very well
English speakers - Born in the United States 75.1% of residents of Sunrise Manor speak English at home.
23.4% of residents speak Spanish at home 16,974 92.8% Speak English very well1,322 7.2% Speak English less than very well1.5% of residents speak other language at home 915 78.6% Speak English very well249 21.4% Speak English less than very well
English speakers - Native, born elsewhere 35.1% of residents of Sunrise Manor speak English at home.
46.5% of residents speak Spanish at home 1,979 87.5% Speak English very well283 12.5% Speak English less than very well18.4% of residents speak other language at home 740 82.7% Speak English very well155 17.3% Speak English less than very well
English speakers - Foreign-born 5.6% of residents of Sunrise Manor speak English at home.
81.0% of residents speak Spanish at home 16,617 36.5% Speak English very well28,884 63.5% Speak English less than very well13.4% of residents speak other language at home 3,262 43.3% Speak English very well4,267 56.7% Speak English less than very well
White (Caucasian) - Speak only English Native:
79.3% (38,178)Foreign-born:
28.6% (1,225)
White (Caucasian) - Speak another language Native:
20.7% (9,942)Foreign-born:
71.4% (3,052)
Black or African American - Speak only English Native:
98.7% (24,705)Foreign-born:
35.2% (200)
Black or African American - Speak another language Native:
1.6% (401)Foreign-born:
63.6% (361)
American Indian / Alaska Native - Speak another language Native:
46.3% (1,385)Foreign-born:
100.0% (2,137)
Asian - Speak only English Native:
66.8% (2,382)Foreign-born:
8.6% (638)
Asian - Speak another language Native:
33.2% (1,185)Foreign-born:
91.4% (6,786)
Native Hawaiian / Pacific Islander - Speak only English Native:
62.8% (523)Foreign-born:
14.2% (25)
Native Hawaiian / Pacific Islander - Speak another language Native:
40.0% (333)Foreign-born:
77.3% (135)
Other race - Speak only English Native:
21.8% (6,196)Foreign-born:
2.5% (622)
Other race - Speak another language Native:
78.2% (22,197)Foreign-born:
97.5% (24,306)
Two or more races - Speak only English Native:
48.7% (13,381)Foreign-born:
4.0% (676)
Two or more races - Speak another language Native:
51.3% (14,083)Foreign-born:
96.0% (16,362)
White alone - Speak only English Native:
95.3% (34,547)Foreign-born:
67.0% (676)
White alone - Speak another language Native:
4.7% (1,688)Foreign-born:
33.0% (333)
Hispanic or Latino - Speak only English Native:
25.5% (15,636)Foreign-born:
3.3% (1,527)
Hispanic or Latino - Speak another language Native:
74.5% (45,655)Foreign-born:
96.7% (45,346)
Foreign-born residents in Sunrise Manor 55,051 residents are foreign born (22.3% Latin America , 3.9% Asia ).
This city:
27.1%Nevada:
19.1%
Marital status for residents in Sunrise Manor Marital status - White (Caucasian) population 15 years and over
Males 39.9% Never married34.7% Now married2.0% Separated8.5% Widowed14.9% DivorcedFemales 31.7% Never married35.5% Now married5.2% Separated12.7% Widowed15.0% DivorcedWomen who gave birth in the past 12 months Now married:
20.2% (164)Unmarried:
79.8% (646)
Women who did not give birth in the past 12 months Now married:
36.0% (3,265)Unmarried:
64.0% (5,808)
Marital status - Black or African American population 15 years and over
Males 45.1% Never married29.3% Now married1.1% Separated9.2% Widowed15.3% DivorcedFemales 53.2% Never married18.1% Now married1.5% Separated7.9% Widowed19.4% DivorcedWomen who gave birth in the past 12 months Now married:
2.6% (12)Unmarried:
97.4% (465)
Women who did not give birth in the past 12 months Now married:
19.1% (1,375)Unmarried:
80.9% (5,836)
Marital status - American Indian / Alaska Native population 15 years and over
Males 42.4% Never married38.3% Now married1.8% Separated3.0% Widowed14.5% DivorcedFemales 33.4% Never married43.5% Now married5.3% Separated4.5% Widowed13.4% DivorcedWomen who gave birth in the past 12 months Now married:
46.0% (102)Unmarried:
54.0% (120)
Women who did not give birth in the past 12 months Now married:
34.1% (275)Unmarried:
65.9% (532)
Marital status - Asian population 15 years and over
Males 24.8% Never married67.7% Now married0.0% Separated0.0% Widowed7.5% DivorcedFemales 24.3% Never married63.2% Now married4.2% Separated6.0% Widowed2.4% DivorcedWomen who gave birth in the past 12 months Now married:
93.1% (106)Unmarried:
6.9% (8)
Women who did not give birth in the past 12 months Now married:
38.2% (946)Unmarried:
61.8% (1,531)
Marital status - Native Hawaiian / Pacific Islander population 15 years and over
Males 49.9% Never married38.3% Now married7.3% Separated0.0% Widowed4.5% DivorcedFemales 31.8% Never married51.0% Now married0.0% Separated3.0% Widowed14.2% DivorcedWomen who gave birth in the past 12 months Now married:
100.0% (150)Unmarried:
0.0% (0)
Women who did not give birth in the past 12 months Now married:
38.1% (109)Unmarried:
61.9% (177)
Marital status - Other race population 15 years and over
Males 49.0% Never married41.8% Now married0.4% Separated0.0% Widowed8.8% DivorcedFemales 42.9% Never married40.6% Now married4.0% Separated4.2% Widowed8.3% DivorcedWomen who gave birth in the past 12 months Now married:
51.9% (588)Unmarried:
48.1% (546)
Women who did not give birth in the past 12 months Now married:
37.9% (5,712)Unmarried:
62.1% (9,374)
Marital status - Two or more races population 15 years and over
Males 46.4% Never married41.5% Now married4.4% Separated0.5% Widowed7.2% DivorcedFemales 37.5% Never married37.7% Now married2.5% Separated9.5% Widowed12.7% DivorcedWomen who gave birth in the past 12 months Now married:
91.2% (620)Unmarried:
8.8% (60)
Women who did not give birth in the past 12 months Now married:
39.4% (4,500)Unmarried:
60.6% (6,933)
Marital status - White alone, not Hispanic / Latino population 15 years and over
Males 34.7% Never married35.2% Now married2.2% Separated9.4% Widowed18.5% DivorcedFemales 25.1% Never married37.2% Now married5.1% Separated15.0% Widowed17.7% DivorcedWomen who gave birth in the past 12 months Now married:
16.7% (76)Unmarried:
83.3% (380)
Women who did not give birth in the past 12 months Now married:
41.6% (2,106)Unmarried:
58.4% (2,958)
Marital status - Hispanic or Latino population 15 years and over
Males 50.0% Never married39.7% Now married1.5% Separated1.0% Widowed7.7% DivorcedFemales 42.4% Never married39.5% Now married3.8% Separated6.4% Widowed7.9% DivorcedWomen who gave birth in the past 12 months Now married:
61.3% (1,384)Unmarried:
38.7% (872)
Women who did not give birth in the past 12 months Now married:
36.8% (10,866)Unmarried:
63.2% (18,648)
Ancestries in Sunrise Manor
3,559 2.7% English3,463 2.6% American2,124 1.6% German1,845 1.4% Italian1,726 1.3% Irish1,424 1.1% African898 0.7% European564 0.4% Polish441 0.3% French428 0.3% Scottish414 0.3% Norwegian410 0.3% French Canadian301 0.2% Hungarian248 0.2% Afghan194 0.1% Nigerian151 0.1% Scotch-Irish140 0.1% Danish116 0.09% British105 0.08% Dutch104 0.08% Armenian98 0.07% Iraqi94 0.07% Brazilian92 0.07% Portuguese87 0.07% Greek83 0.06% Ethiopian80 0.06% Scandinavian79 0.06% Czech72 0.05% Welsh72 0.05% Serbian61 0.05% Canadian59 0.04% Swedish58 0.04% Ukrainian56 0.04% Celtic55 0.04% Northern European54 0.04% Romanian50 0.04% Russian49 0.04% Lithuanian49 0.04% Jamaican42 0.03% Czechoslovakian37 0.03% Jordanian36 0.03% Iranian36 0.03% Eastern European35 0.03% Belizean27 0.02% Croatian25 0.02% Slavic25 0.02% Austrian24 0.02% Slovak24 0.02% Cape Verdean23 0.02% Estonian23 0.02% Swiss22 0.02% West Indian21 0.02% Belgian19 0.01% Lebanese19 0.01% Turkish17 0.01% Arab15 0.01% Icelander15 0.01% Palestinian14 0.01% Finnish11 0.01% Maltese10 0.01% Yugoslavian8 0.01% Syrian
Geographical mobility in Sunrise Manor Same house 1 year ago 46,909 87.3% White (Caucasian)22,598 85.4% Black or African American3,632 85.9% American Indian / Alaska Native10,227 96.0% Asian878 87.3% Native Hawaiian / Pacific Islander52,307 92.5% Other race42,001 86.0% Two or more races33,019 87.3% White alone, not Hispanic / Latino103,624 90.0% Hispanic or LatinoMoved within same county 4,530 8.4% White / Caucasian2,006 7.6% Black or African American313 7.4% American Indian / Alaska Native196 1.8% Asian104 10.3% Native Hawaiian / Pacific Islander3,184 5.6% Other race4,078 8.4% Two or more races3,016 8.0% White alone, not Hispanic / Latino8,304 7.2% Hispanic or LatinoMoved within same state 763 2.9% Black or African American2 0.0% AsianMoved from different state 2,273 4.2% White / Caucasian1,100 4.2% Black or African American183 4.3% American Indian / Alaska Native351 3.3% Asian33 3.3% Native Hawaiian / Pacific Islander1,071 1.9% Other race2,721 5.6% Two or more races1,808 4.8% White alone, not Hispanic / Latino3,219 2.8% Hispanic or LatinoMoved from abroad 41 0.4% Asian31 0.1% Two or more races31 0.0% Hispanic or Latino
Children Nativity (place of birth) in Sunrise Manor
Children under 6 years - Living with two parents Both parents native 1,282 100.0% NativeBoth parents foreign-born 2,120 95.5% Native99 4.5% Foreign-bornOne native, one foreign-born parent 1,764 100.0% NativeChildren under 6 years - Living with one parent Native parent 6,040 100.0% NativeForeign-born parent 2,908 94.3% Native175 5.7% Foreign-bornChildren 6 to 17 years - Living with two parents Both parents native 4,239 100.0% NativeBoth parents foreign-born 8,490 93.1% Native626 6.9% Foreign-bornOne native, one foreign-born parent 2,768 100.0% NativeChildren 6 to 17 years - Living with one parent Native parent 12,828 100.0% NativeForeign-born parent 6,018 50.3% Native5,938 49.7% Foreign-born
Place of birth for residents in Sunrise Manor 45,598 Americas45,240 Latin America40,183 Central America7,908 Asia6,279 South Eastern Asia3,823 Caribbean1,232 South America1,036 Europe606 Eastern Asia579 Western Asia443 South Central Asia405 Africa372 Western Europe358 Northern America290 Northern Europe285 Eastern Europe236 China236 Eastern Africa141 Western Africa101 Oceania88 Southern Europe19 Northern Africa19 Australia and New Zealand Subregion3 Southern Africa33,667 Mexico5,332 Philippines3,402 Cuba3,004 El Salvador1,823 Guatemala774 Honduras643 Nicaragua430 Thailand402 Colombia320 Canada304 Dominican Republic285 Peru245 Iraq230 Germany225 Japan224 Syria219 Vietnam204 India201 Venezuela173 Brazil172 Cambodia149 Poland148 Ethiopia144 Korea143 Panama134 China128 Scotland118 Laos101 England94 Afghanistan84 Costa Rica81 Pakistan70 Hong Kong68 Jamaica65 Uganda62 Romania60 Austria49 United Kingdom45 Netherlands39 Iran38 Fiji38 Argentina37 Yemen36 Liberia31 Chile30 Taiwan30 Nigeria27 West Indies27 Belize26 Sierra Leone24 Ivory Coast23 Greece22 Senegal21 Turkey21 Bolivia21 Spain20 Ecuador19 Portugal18 Italy17 Jordan16 Uruguay16 Russia16 Bosnia and Herzegovina14 Sri Lanka13 Armenia12 Belgium12 France11 Lebanon11 Trinidad and Tobago10 Switzerland10 New Zealand10 Guyana9 Haiti9 Australia9 Kazakhstan8 Israel7 Ireland7 Sudan6 Croatia6 Indonesia6 Ukraine4 Bulgaria4 Hungary4 Denmark3 South Africa3 Czechoslovakia
Grandparents responsible for own grandchildren in Sunrise Manor
Grandparents (30 to 59 years) White / Caucasian 688 60.6% Responsible for grandchildren448 39.4% Not responsible for grandchildrenBlack or African American 263 50.4% Responsible for grandchildren258 49.6% Not responsible for grandchildrenAmerican Indian / Alaska Native 39 32.8% Responsible for grandchildren79 67.2% Not responsible for grandchildrenAsian 123 57.2% Responsible for grandchildren92 42.8% Not responsible for grandchildrenNative Hawaiian / Pacific Islander 1 1.4% Responsible for grandchildren90 98.6% Not responsible for grandchildrenOther race 594 33.7% Responsible for grandchildren1,170 66.3% Not responsible for grandchildrenTwo or more races 43 4.1% Responsible for grandchildren1,005 95.9% Not responsible for grandchildrenWhite alone, not Hispanic / Latino 344 57.4% Responsible for grandchildren255 42.6% Not responsible for grandchildrenHispanic or Latino 630 24.6% Responsible for grandchildren1,934 75.4% Not responsible for grandchildrenGrandparents (60 years and over) White / Caucasian 427 100.0% Not responsible for grandchildrenBlack or African American 184 45.5% Responsible for grandchildren220 54.5% Not responsible for grandchildrenAmerican Indian / Alaska Native 7 18.8% Responsible for grandchildren29 81.2% Not responsible for grandchildrenAsian 31 5.9% Responsible for grandchildren491 94.1% Not responsible for grandchildrenOther race 193 28.3% Responsible for grandchildren490 71.7% Not responsible for grandchildrenTwo or more races 67 8.1% Responsible for grandchildren758 91.9% Not responsible for grandchildrenWhite alone, not Hispanic / Latino 126 30.1% Responsible for grandchildren292 69.9% Not responsible for grandchildrenHispanic or Latino 321 25.4% Responsible for grandchildren942 74.6% Not responsible for grandchildren