Races in Summit, New Jersey (NJ) Detailed Stats
Data:
Races - White alone (%)
Races - White alone (% change since 2000)
Races - Black alone (%)
Races - Black alone (% change since 2000)
Races - American Indian alone (%)
Races - American Indian alone (% change since 2000)
Races - Asian alone (%)
Races - Asian alone (% change since 2000)
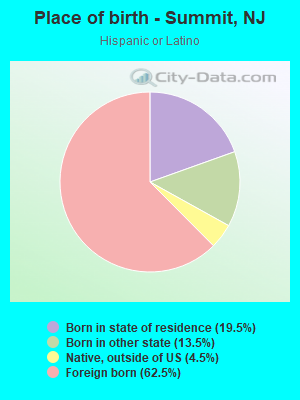
Races - Hispanic (%)
Races - Hispanic (% change since 2000)
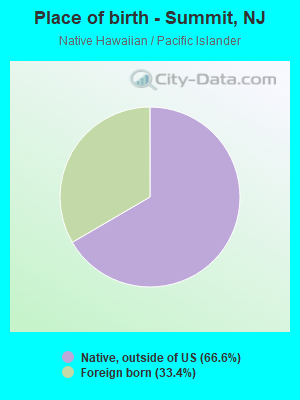
Races - Native Hawaiian and Other Pacific Islander alone (%)
Races - Native Hawaiian and Other Pacific Islander alone (% change since 2000)
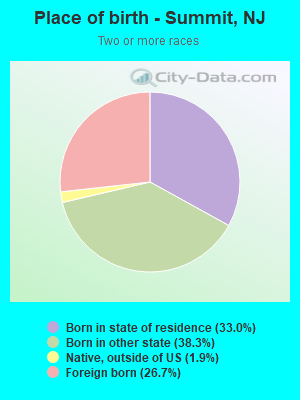
Races - Two or more races(%)
Races - Two or more races(% change since 2000)
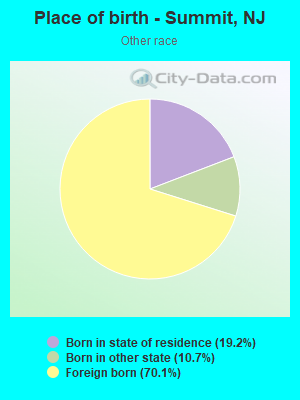
Races - Other race alone (%)
Races - Other race alone (% change since 2000)
Racial diversity
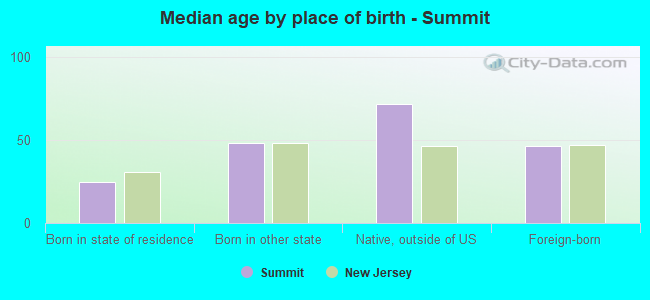
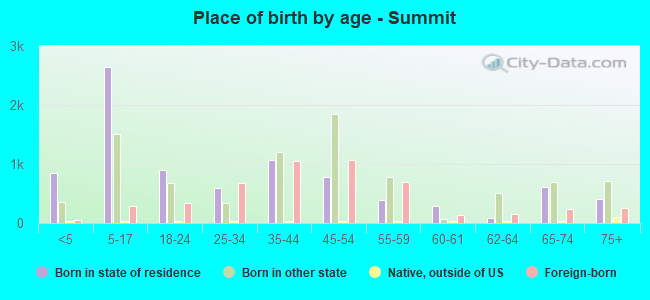
Place of birth - Born in state of residence (%)
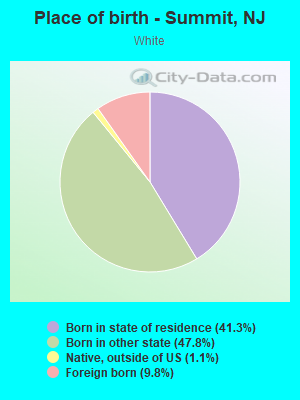
Place of birth - Born in state of residence (%) - White
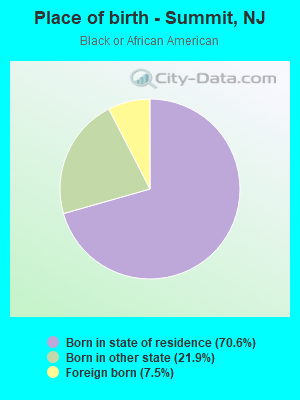
Place of birth - Born in state of residence (%) - Black or African American
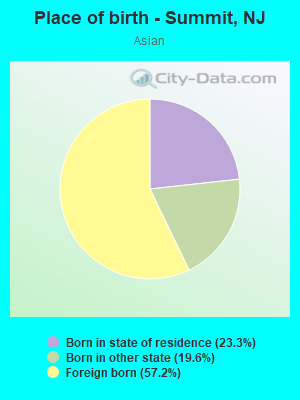
Place of birth - Born in state of residence (%) - Asian
Place of birth - Born in state of residence (%) - Hispanic or Latino
Place of birth - Born in state of residence (%) - American Indian and Alaska Native
Place of birth - Born in state of residence (%) - Multirace
Place of birth - Born in state of residence (%) - Other Race
Place of birth - Born in other state (%)
Place of birth - Born in other state (%) - White
Place of birth - Born in other state (%) - Black or African American
Place of birth - Born in other state (%) - Asian
Place of birth - Born in other state (%) - Hispanic or Latino
Place of birth - Born in other state (%) - American Indian and Alaska Native
Place of birth - Born in other state (%) - Multirace
Place of birth - Born in other state (%) - Other Race
Place of birth - Native, outside of US (%)
Place of birth - Native, outside of US (%) - White
Place of birth - Native, outside of US (%) - Black or African American
Place of birth - Native, outside of US (%) - Asian
Place of birth - Native, outside of US (%) - Hispanic or Latino
Place of birth - Native, outside of US (%) - American Indian and Alaska Native
Place of birth - Native, outside of US (%) - Multirace
Place of birth - Native, outside of US (%) - Other Race
Place of birth - Foreign born (%)
Place of birth - Foreign born (%) - White
Place of birth - Foreign born (%) - Black or African American
Place of birth - Foreign born (%) - Asian
Place of birth - Foreign born (%) - Hispanic or Latino
Place of birth - Foreign born (%) - American Indian and Alaska Native
Place of birth - Foreign born (%) - Multirace
Place of birth - Foreign born (%) - Other Race
Residents speaking English at home (%)
Residents speaking English at home - Born in the United States (%)
Residents speaking English at home - Native, born elsewhere (%)
Residents speaking English at home - Foreign born (%)
Residents speaking Spanish at home (%)
Residents speaking Spanish at home - Born in the United States (%)
Residents speaking Spanish at home - Native, born elsewhere (%)
Residents speaking Spanish at home - Foreign born (%)
Residents speaking other language at home (%)
Residents speaking other language at home - Born in the United States (%)
Residents speaking other language at home - Native, born elsewhere (%)
Residents speaking other language at home - Foreign born (%)
Marital status - Never married (%)
Marital status - Now married (%)
Marital status - Separated (%)
Marital status - Widowed (%)
Marital status - Divorced (%)
Ancestries Reported - Arab (%)
Ancestries Reported - Czech (%)
Ancestries Reported - Danish (%)
Ancestries Reported - Dutch (%)
Ancestries Reported - English (%)
Ancestries Reported - French (%)
Ancestries Reported - French Canadian (%)
Ancestries Reported - German (%)
Ancestries Reported - Greek (%)
Ancestries Reported - Hungarian (%)
Ancestries Reported - Irish (%)
Ancestries Reported - Italian (%)
Ancestries Reported - Lithuanian (%)
Ancestries Reported - Norwegian (%)
Ancestries Reported - Polish (%)
Ancestries Reported - Portuguese (%)
Ancestries Reported - Russian (%)
Ancestries Reported - Scotch-Irish (%)
Ancestries Reported - Scottish (%)
Ancestries Reported - Slovak (%)
Ancestries Reported - Subsaharan African (%)
Ancestries Reported - Swedish (%)
Ancestries Reported - Swiss (%)
Ancestries Reported - Ukrainian (%)
Ancestries Reported - United States (%)
Ancestries Reported - Welsh (%)
Ancestries Reported - West Indian (%)
Ancestries Reported - Other (%)
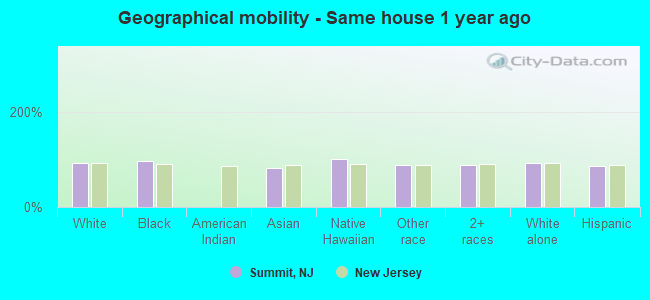
Geographical mobility - Same house 1 year ago (%)
Geographical mobility - Same house 1 year ago (%) - White
Geographical mobility - Same house 1 year ago (%) - Black or African American
Geographical mobility - Same house 1 year ago (%) - Asian
Geographical mobility - Same house 1 year ago (%) - Hispanic or Latino
Geographical mobility - Same house 1 year ago (%) - American Indian and Alaska Native
Geographical mobility - Same house 1 year ago (%) - Multirace
Geographical mobility - Same house 1 year ago (%) - Other Race
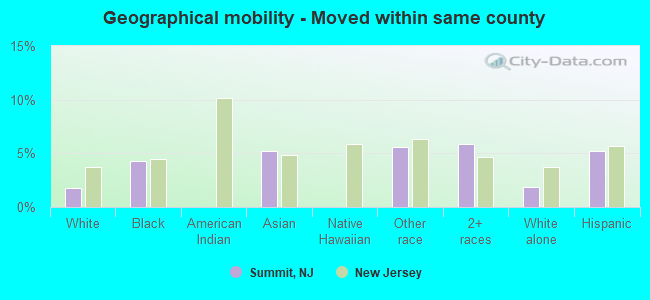
Geographical mobility - Moved within same county (%)
Geographical mobility - Moved within same county (%) - White
Geographical mobility - Moved within same county (%) - Black or African American
Geographical mobility - Moved within same county (%) - Asian
Geographical mobility - Moved within same county (%) - Hispanic or Latino
Geographical mobility - Moved within same county (%) - American Indian and Alaska Native
Geographical mobility - Moved within same county (%) - Multirace
Geographical mobility - Moved within same county (%) - Other Race
Geographical mobility - Moved from different county within same state (%)
Geographical mobility - Moved from different county within same state (%) - White
Geographical mobility - Moved from different county within same state (%) - Black or African American
Geographical mobility - Moved from different county within same state (%) - Asian
Geographical mobility - Moved from different county within same state (%) - Hispanic or Latino
Geographical mobility - Moved from different county within same state (%) - American Indian and Alaska Native
Geographical mobility - Moved from different county within same state (%) - Multirace
Geographical mobility - Moved from different county within same state (%) - Other Race
Geographical mobility - Moved from different state (%)
Geographical mobility - Moved from different state (%) - White
Geographical mobility - Moved from different state (%) - Black or African American
Geographical mobility - Moved from different state (%) - Asian
Geographical mobility - Moved from different state (%) - Hispanic or Latino
Geographical mobility - Moved from different state (%) - American Indian and Alaska Native
Geographical mobility - Moved from different state (%) - Multirace
Geographical mobility - Moved from different state (%) - Other Race
Geographical mobility - Moved from abroad (%)
Geographical mobility - Moved from abroad (%) - White
Geographical mobility - Moved from abroad (%) - Black or African American
Geographical mobility - Moved from abroad (%) - Asian
Geographical mobility - Moved from abroad (%) - Hispanic or Latino
Geographical mobility - Moved from abroad (%) - American Indian and Alaska Native
Geographical mobility - Moved from abroad (%) - Multirace
Geographical mobility - Moved from abroad (%) - Other Race
Place of birth for the foreign-born population - Ireland (%)
Place of birth for the foreign-born population - Denmark (%)
Place of birth for the foreign-born population - Norway (%)
Place of birth for the foreign-born population - Sweden (%)
Place of birth for the foreign-born population - United Kingdom (%)
Place of birth for the foreign-born population - England (%)
Place of birth for the foreign-born population - Scotland (%)
Place of birth for the foreign-born population - Other Northern Europe (%)
Place of birth for the foreign-born population - Austria (%)
Place of birth for the foreign-born population - Belgium (%)
Place of birth for the foreign-born population - France (%)
Place of birth for the foreign-born population - Germany (%)
Place of birth for the foreign-born population - Netherlands (%)
Place of birth for the foreign-born population - Switzerland (%)
Place of birth for the foreign-born population - Other Western Europe (%)
Place of birth for the foreign-born population - Greece (%)
Place of birth for the foreign-born population - Italy (%)
Place of birth for the foreign-born population - Portugal (%)
Place of birth for the foreign-born population - Spain (%)
Place of birth for the foreign-born population - Other Southern Europe (%)
Place of birth for the foreign-born population - Albania (%)
Place of birth for the foreign-born population - Belarus (%)
Place of birth for the foreign-born population - Bosnia and Herzegovina (%)
Place of birth for the foreign-born population - Bulgaria (%)
Place of birth for the foreign-born population - Croatia (%)
Place of birth for the foreign-born population - Czechoslovakia (%)
Place of birth for the foreign-born population - Hungary (%)
Place of birth for the foreign-born population - Latvia (%)
Place of birth for the foreign-born population - Lithuania (%)
Place of birth for the foreign-born population - North Macedonia (Macedonia) (%)
Place of birth for the foreign-born population - Moldova (%)
Place of birth for the foreign-born population - Poland (%)
Place of birth for the foreign-born population - Romania (%)
Place of birth for the foreign-born population - Russia (%)
Place of birth for the foreign-born population - Serbia (%)
Place of birth for the foreign-born population - Ukraine (%)
Place of birth for the foreign-born population - Other Eastern Europe (%)
Place of birth for the foreign-born population - China (%)
Place of birth for the foreign-born population - Hong Kong (%)
Place of birth for the foreign-born population - Taiwan (%)
Place of birth for the foreign-born population - Japan (%)
Place of birth for the foreign-born population - Korea (%)
Place of birth for the foreign-born population - Other Eastern Asia (%)
Place of birth for the foreign-born population - Afghanistan (%)
Place of birth for the foreign-born population - Bangladesh (%)
Place of birth for the foreign-born population - India (%)
Place of birth for the foreign-born population - Iran (%)
Place of birth for the foreign-born population - Kazakhstan (%)
Place of birth for the foreign-born population - Nepal (%)
Place of birth for the foreign-born population - Pakistan (%)
Place of birth for the foreign-born population - Sri Lanka (%)
Place of birth for the foreign-born population - Uzbekistan (%)
Place of birth for the foreign-born population - Other South Central Asia (%)
Place of birth for the foreign-born population - Burma (%)
Place of birth for the foreign-born population - Cambodia (%)
Place of birth for the foreign-born population - Indonesia (%)
Place of birth for the foreign-born population - Laos (%)
Place of birth for the foreign-born population - Malaysia (%)
Place of birth for the foreign-born population - Philippines (%)
Place of birth for the foreign-born population - Singapore (%)
Place of birth for the foreign-born population - Thailand (%)
Place of birth for the foreign-born population - Vietnam (%)
Place of birth for the foreign-born population - Other South Eastern Asia (%)
Place of birth for the foreign-born population - Armenia (%)
Place of birth for the foreign-born population - Iraq (%)
Place of birth for the foreign-born population - Israel (%)
Place of birth for the foreign-born population - Jordan (%)
Place of birth for the foreign-born population - Kuwait (%)
Place of birth for the foreign-born population - Lebanon (%)
Place of birth for the foreign-born population - Saudi Arabia (%)
Place of birth for the foreign-born population - Syria (%)
Place of birth for the foreign-born population - Turkey (%)
Place of birth for the foreign-born population - Yemen (%)
Place of birth for the foreign-born population - Other Western Asia (%)
Place of birth for the foreign-born population - Eritrea (%)
Place of birth for the foreign-born population - Ethiopia (%)
Place of birth for the foreign-born population - Kenya (%)
Place of birth for the foreign-born population - Somalia (%)
Place of birth for the foreign-born population - Uganda (%)
Place of birth for the foreign-born population - Zimbabwe (%)
Place of birth for the foreign-born population - Other Eastern Africa (%)
Place of birth for the foreign-born population - Cameroon (%)
Place of birth for the foreign-born population - Congo (%)
Place of birth for the foreign-born population - Democratic Republic of Congo (Zaire) (%)
Place of birth for the foreign-born population - Other Middle Africa (%)
Place of birth for the foreign-born population - Egypt (%)
Place of birth for the foreign-born population - Morocco (%)
Place of birth for the foreign-born population - Sudan (%)
Place of birth for the foreign-born population - Other Northern Africa (%)
Place of birth for the foreign-born population - South Africa (%)
Place of birth for the foreign-born population - Other Southern Africa (%)
Place of birth for the foreign-born population - Cabo Verde (%)
Place of birth for the foreign-born population - Ghana (%)
Place of birth for the foreign-born population - Liberia (%)
Place of birth for the foreign-born population - Nigeria (%)
Place of birth for the foreign-born population - Senegal (%)
Place of birth for the foreign-born population - Sierra Leone (%)
Place of birth for the foreign-born population - Other Western Africa (%)
Place of birth for the foreign-born population - Australia (%)
Place of birth for the foreign-born population - New Zealand (%)
Place of birth for the foreign-born population - Fiji (%)
Place of birth for the foreign-born population - Micronesia (%)
Place of birth for the foreign-born population - Bahamas (%)
Place of birth for the foreign-born population - Barbados (%)
Place of birth for the foreign-born population - Cuba (%)
Place of birth for the foreign-born population - Dominica (%)
Place of birth for the foreign-born population - Dominican Republic (%)
Place of birth for the foreign-born population - Grenada (%)
Place of birth for the foreign-born population - Haiti (%)
Place of birth for the foreign-born population - Jamaica (%)
Place of birth for the foreign-born population - St. Vincent and the Grenadines (%)
Place of birth for the foreign-born population - Trinidad and Tobago (%)
Place of birth for the foreign-born population - West Indies (%)
Place of birth for the foreign-born population - Other Caribbean (%)
Place of birth for the foreign-born population - Belize (%)
Place of birth for the foreign-born population - Costa Rica (%)
Place of birth for the foreign-born population - El Salvador (%)
Place of birth for the foreign-born population - Guatemala (%)
Place of birth for the foreign-born population - Honduras (%)
Place of birth for the foreign-born population - Mexico (%)
Place of birth for the foreign-born population - Nicaragua (%)
Place of birth for the foreign-born population - Panama (%)
Place of birth for the foreign-born population - Other Central America (%)
Place of birth for the foreign-born population - Argentina (%)
Place of birth for the foreign-born population - Bolivia (%)
Place of birth for the foreign-born population - Brazil (%)
Place of birth for the foreign-born population - Chile (%)
Place of birth for the foreign-born population - Colombia (%)
Place of birth for the foreign-born population - Ecuador (%)
Place of birth for the foreign-born population - Guyana (%)
Place of birth for the foreign-born population - Peru (%)
Place of birth for the foreign-born population - Uruguay (%)
Place of birth for the foreign-born population - Venezuela (%)
Place of birth for the foreign-born population - Other South America (%)
Place of birth for the foreign-born population - Canada (%)
Place of birth for the foreign-born population - Other Northern America (%)
Place of birth for the foreign-born population - Other (%)
Latest news about races in Summit, NJ collected exclusively by city-data.com from local newspapers, TV, and radio stations
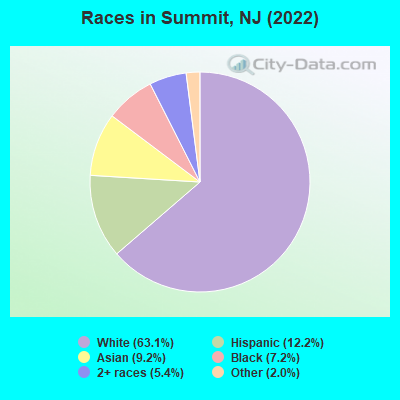
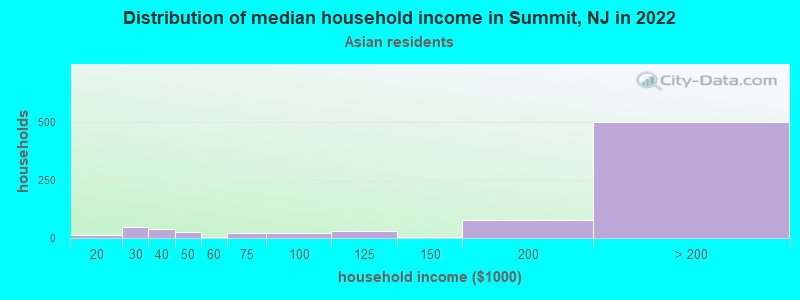
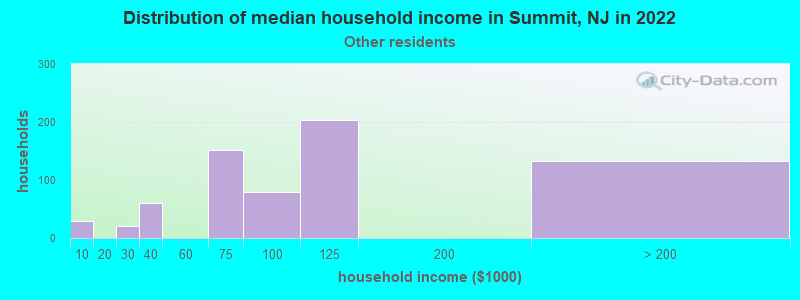
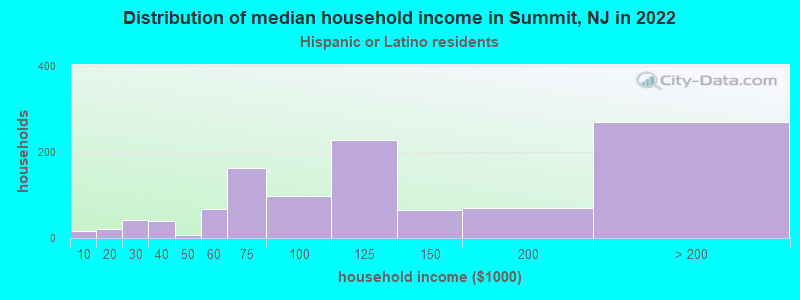
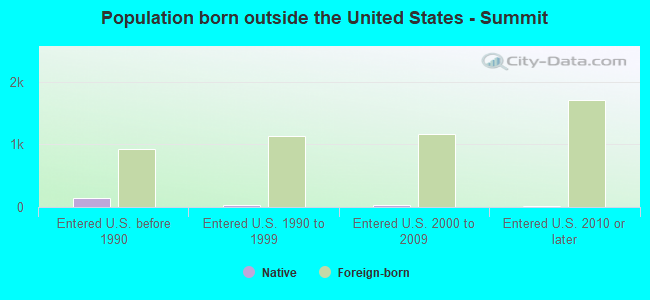
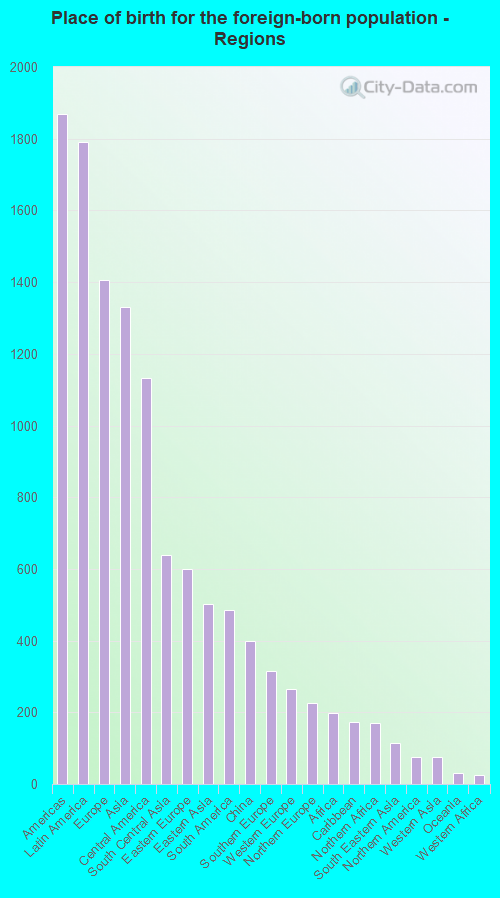
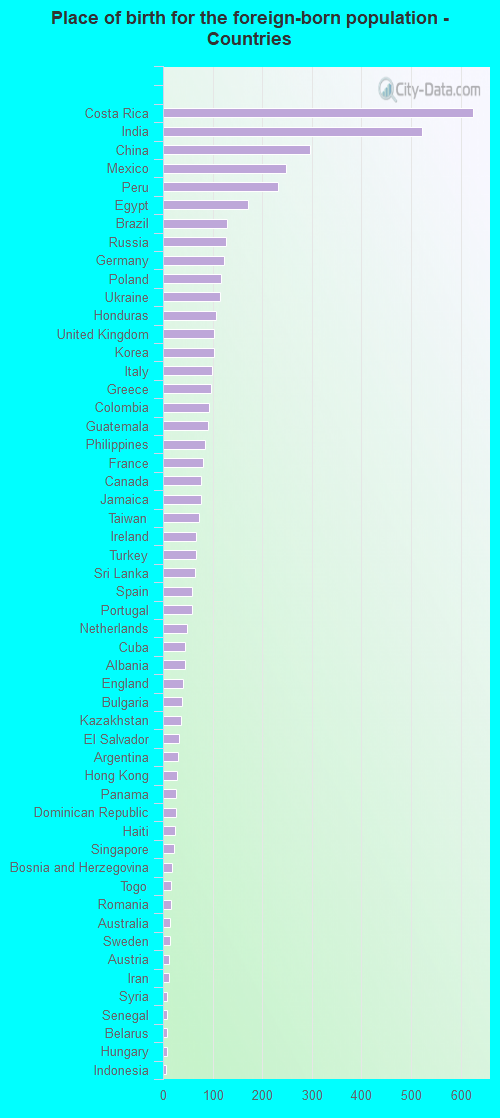
According to 2022 data, the most numerous races in Summit, NJ are White alone (14,165 residents), Hispanic (2,748 residents), and Black alone (1,625 residents). 71.5% of Summit residents speak English at home. 21.5% of Summit, NJ residents are foreign-born (7.8% born in Latin America, 6.1% born in Europe, 5.8% born in Asia), which is 6.8% less than the foreign-born rate of 23.0% across the entire state of New Jersey.
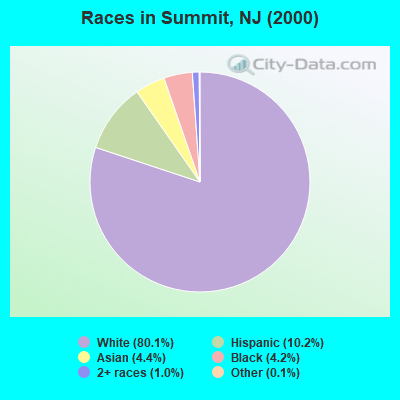
Race distribution in Summit
2000 2022
5,557,209 66.0% White alone 1,117,191 13.3% Hispanic 1,096,171 13.0% Black alone 477,012 5.7% Asian alone 133,689 1.6% Two or more races 19,565 0.2% Other race alone 11,338 0.1% American Indian alone 2,175 0.03% Native Hawaiian and Other
4,766,476 51.5% White alone 2,028,470 21.9% Hispanic 1,111,632 12.0% Black alone 923,546 10.0% Asian alone 332,237 3.6% Two or more races 89,847 1.0% Other race alone 8,557 0.09% American Indian alone 934 0.01% Native Hawaiian and Other
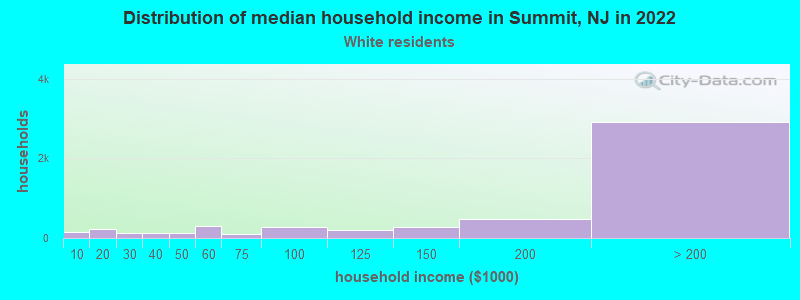
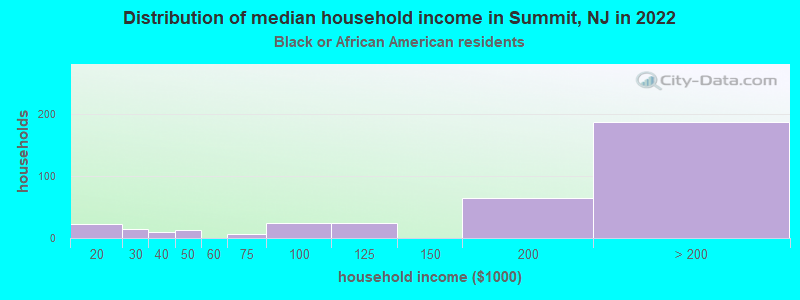
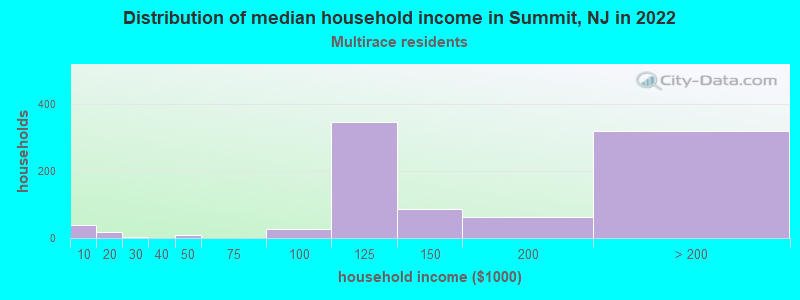
Income and house value in Summit Median household income in 2022 over $200,000 White non-Hispanic householders$174,181 Black householdersover $200,000 Asian householders$87,002 Some other race householders$112,455 Two or more races householders$109,732 Hispanic or Latino race householdersMedian 2022 house value over $1,000,000 White Non-Hispanic householders$512,584 Black or African American householders over $1,000,000 Asian householders$308,988 Native Hawaiian and other Pacific Islander householders$617,977 Some other race householders$713,483 Two or more races householders$653,708 Hispanic or Latino householders
Median age by race in Summit
43.1 Median age for White residents40.9 44.1 38.1 Median age for Black or African American residents38.8 34.9 -656,626,505.4 Median age for American Indian / Alaska Native residents-749,529,189.5 -612,668,742.9 39.4 Median age for Asian residents42.0 37.0 -1,010,045,661.1 Median age for Native Hawaiian / Pacific Islander residents-860,335,194.7 -713,070,378.3 39.5 Median age for Other race residents34.9 41.6 34.2 Median age for Two or more races residents28.9 40.2 42.4 Median age for White alone residents41.4 43.6 38.9 Median age for Hispanic or Latino residents36.4 41.0
Owner/renter occupied households by race in Summit
House owners and renters - White residents 4,009 78.6% Owner occupied1,090 21.4% Renter occupiedHouse owners and renters - Black or African American residents 193 57.9% Owner occupied140 42.1% Renter occupiedHouse owners and renters - American Indian / Alaska Native residents 29 100.0% Renter occupiedHouse owners and renters - Asian residents 552 70.3% Owner occupied233 29.7% Renter occupiedHouse owners and renters - Native Hawaiian / Pacific Islander residents 20 100.0% Renter occupiedHouse owners and renters - Other race residents 144 23.0% Owner occupied483 77.0% Renter occupiedHouse owners and renters - Two or more races residents 519 59.5% Owner occupied353 40.5% Renter occupiedHouse owners and renters - White alone residents 4,078 77.7% Owner occupied1,173 22.3% Renter occupiedHouse owners and renters - Hispanic or Latino residents 341 34.2% Owner occupied655 65.8% Renter occupied
Language usage in Summit
English speakers - Total 71.5% of residents of Summit speak English at home.
10.9% of residents speak Spanish at home 1,184 51.4% Speak English very well1,121 48.6% Speak English less than very well16.7% of residents speak other language at home 2,768 78.1% Speak English very well777 21.9% Speak English less than very well
English speakers - Born in the United States 89.6% of residents of Summit speak English at home.
2.2% of residents speak Spanish at home 174 94.6% Speak English very well10 5.4% Speak English less than very well8.4% of residents speak other language at home 642 93.2% Speak English very well47 6.8% Speak English less than very well
English speakers - Native, born elsewhere 30.8% of residents of Summit speak English at home.
50.9% of residents speak Spanish at home 39 34.2% Speak English very well75 65.8% Speak English less than very well10.3% of residents speak other language at home 23 100.0% Speak English very well
English speakers - Foreign-born 13.9% of residents of Summit speak English at home.
32.2% of residents speak Spanish at home 557 35.3% Speak English very well1,023 64.7% Speak English less than very well51.9% of residents speak other language at home 1,829 71.8% Speak English very well718 28.2% Speak English less than very well
White (Caucasian) - Speak only English Native:
96.9% (11,282)Foreign-born:
25.2% (342)
White (Caucasian) - Speak another language Native:
5.3% (614)Foreign-born:
75.5% (1,024)
Black or African American - Speak only English Native:
95.4% (1,375)Foreign-born:
27.0% (33)
Black or African American - Speak another language Native:
4.1% (59)Foreign-born:
72.7% (89)
Asian - Speak only English Native:
63.3% (460)Foreign-born:
8.0% (94)
Asian - Speak another language Native:
35.7% (260)Foreign-born:
91.4% (1,070)
Native Hawaiian / Pacific Islander - Speak only English Native:
99.5% (19)Foreign-born:
96.3% (17)
Other race - Speak only English Native:
46.0% (265)Foreign-born:
7.4% (98)
Other race - Speak another language Native:
56.4% (326)Foreign-born:
93.6% (1,247)
Two or more races - Speak only English Native:
79.2% (1,132)Foreign-born:
7.9% (45)
Two or more races - Speak another language Native:
13.6% (195)Foreign-born:
92.1% (521)
White alone - Speak only English Native:
95.5% (11,252)Foreign-born:
23.2% (365)
White alone - Speak another language Native:
4.7% (553)Foreign-born:
75.7% (1,191)
Hispanic or Latino - Speak only English Native:
46.7% (451)Foreign-born:
5.0% (86)
Hispanic or Latino - Speak another language Native:
53.6% (517)Foreign-born:
95.3% (1,651)
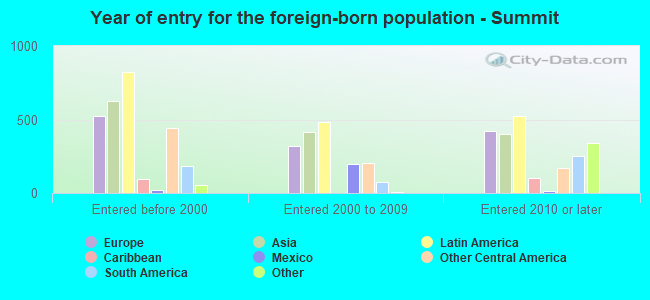
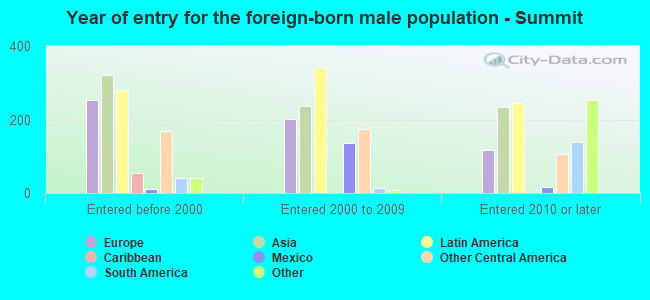
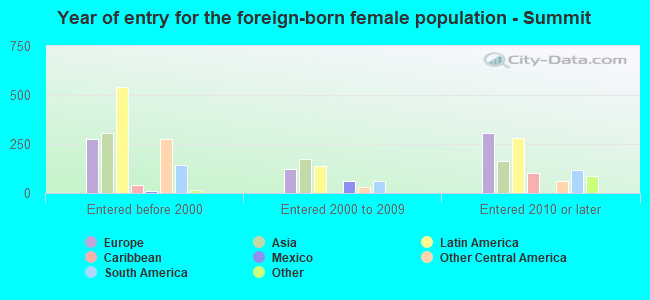
Foreign-born residents in Summit 4,836 residents are foreign born (7.8% Latin America , 6.1% Europe , 5.8% Asia ).
This city:
21.5%New Jersey:
23.2%
Marital status for residents in Summit Marital status - White (Caucasian) population 15 years and over
Males 27.2% Never married64.2% Now married0.6% Separated0.8% Widowed7.2% DivorcedFemales 26.7% Never married54.4% Now married0.6% Separated9.8% Widowed8.5% DivorcedWomen who gave birth in the past 12 months Now married:
100.0% (129)Unmarried:
0.0% (0)
Women who did not give birth in the past 12 months Now married:
50.7% (1,434)Unmarried:
49.3% (1,396)
Marital status - Black or African American population 15 years and over
Males 73.9% Never married26.1% Now married0.0% Separated0.0% Widowed0.0% DivorcedFemales 56.4% Never married35.8% Now married2.3% Separated0.0% Widowed5.5% DivorcedWomen who gave birth in the past 12 months Now married:
100.0% (12)Unmarried:
0.0% (0)
Women who did not give birth in the past 12 months Now married:
38.7% (158)Unmarried:
61.3% (251)
Marital status - Asian population 15 years and over
Males 12.8% Never married82.5% Now married0.0% Separated0.9% Widowed3.8% DivorcedFemales 27.0% Never married67.0% Now married0.0% Separated1.9% Widowed4.1% DivorcedWomen who gave birth in the past 12 months Now married:
100.0% (14)Unmarried:
0.0% (0)
Women who did not give birth in the past 12 months Now married:
63.1% (384)Unmarried:
36.9% (224)
Marital status - Native Hawaiian / Pacific Islander population 15 years and over
Males 0.0% Never married100.0% Now married0.0% Separated0.0% Widowed0.0% DivorcedFemales 100.0% Never married0.0% Now married0.0% Separated0.0% Widowed0.0% DivorcedWomen who gave birth in the past 12 months Now married:
0.0% (0)Unmarried:
100.0% (19)
Marital status - Other race population 15 years and over
Males 51.9% Never married44.2% Now married0.0% Separated0.0% Widowed3.9% DivorcedFemales 41.5% Never married32.9% Now married7.3% Separated7.1% Widowed11.3% DivorcedWomen who gave birth in the past 12 months Now married:
36.4% (8)Unmarried:
63.6% (15)
Women who did not give birth in the past 12 months Now married:
39.2% (277)Unmarried:
60.8% (429)
Marital status - Two or more races population 15 years and over
Males 27.0% Never married51.3% Now married2.4% Separated9.4% Widowed9.9% DivorcedFemales 68.5% Never married19.3% Now married0.0% Separated0.4% Widowed11.7% DivorcedWomen who gave birth in the past 12 months Now married:
92.9% (17)Unmarried:
7.1% (1)
Women who did not give birth in the past 12 months Now married:
18.2% (70)Unmarried:
81.8% (314)
Marital status - White alone, not Hispanic / Latino population 15 years and over
Males 27.4% Never married64.7% Now married0.4% Separated0.9% Widowed6.7% DivorcedFemales 27.4% Never married53.8% Now married0.7% Separated9.1% Widowed8.9% DivorcedWomen who gave birth in the past 12 months Now married:
100.0% (136)Unmarried:
0.0% (0)
Women who did not give birth in the past 12 months Now married:
50.3% (1,506)Unmarried:
49.7% (1,486)
Marital status - Hispanic or Latino population 15 years and over
Males 39.4% Never married47.8% Now married2.2% Separated3.5% Widowed7.1% DivorcedFemales 31.2% Never married42.2% Now married5.0% Separated9.4% Widowed12.3% DivorcedWomen who gave birth in the past 12 months Now married:
100.0% (26)Unmarried:
0.0% (0)
Women who did not give birth in the past 12 months Now married:
41.5% (325)Unmarried:
58.5% (459)
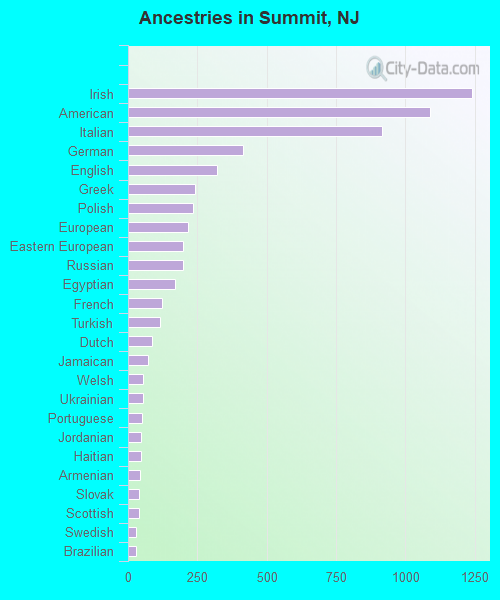
Ancestries in Summit
1,239 11.1% Irish1,088 9.8% American915 8.2% Italian413 3.7% German321 2.9% English241 2.2% Greek233 2.1% Polish215 1.9% European199 1.8% Eastern European198 1.8% Russian171 1.5% Egyptian123 1.1% French115 1.0% Turkish88 0.8% Dutch72 0.6% Jamaican55 0.5% Welsh53 0.5% Ukrainian50 0.4% Portuguese46 0.4% Jordanian46 0.4% Haitian42 0.4% Armenian38 0.3% Slovak38 0.3% Scottish28 0.3% Swedish28 0.3% Brazilian26 0.2% Croatian25 0.2% Scandinavian24 0.2% Danish24 0.2% Albanian24 0.2% Hungarian23 0.2% Northern European23 0.2% British21 0.2% Canadian19 0.2% French Canadian19 0.2% Norwegian19 0.2% Lebanese15 0.1% Iranian15 0.1% Estonian15 0.1% Serbian10 0.09% Israeli9 0.08% Czech9 0.08% Syrian9 0.08% Australian7 0.06% Scotch-Irish6 0.05% Senegalese5 0.04% Bulgarian
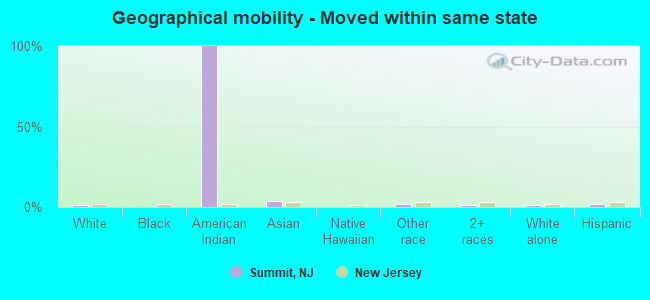
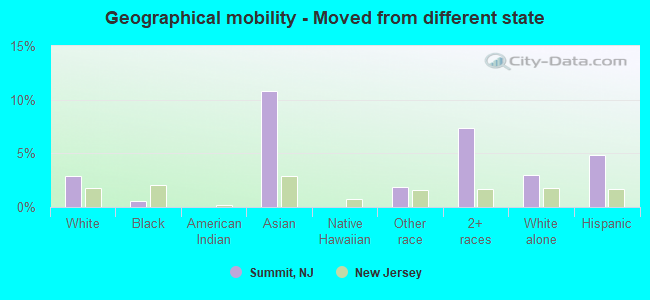
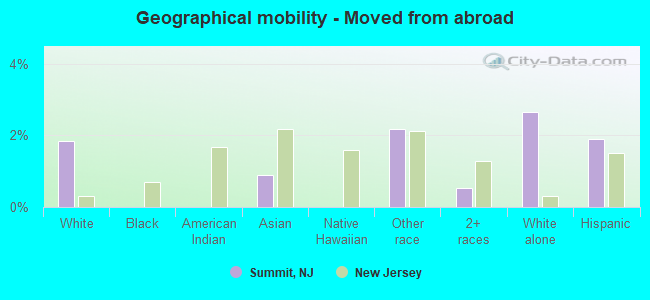
Geographical mobility in Summit Same house 1 year ago 12,344 92.1% White (Caucasian)1,561 96.6% Black or African American1,708 81.9% Asian38 100.0% Native Hawaiian / Pacific Islander1,649 87.8% Other race1,907 87.9% Two or more races12,885 92.0% White alone, not Hispanic / Latino2,320 85.5% Hispanic or LatinoMoved within same county 237 1.8% White / Caucasian69 4.2% Black or African American109 5.2% Asian105 5.6% Other race126 5.8% Two or more races257 1.8% White alone, not Hispanic / Latino143 5.3% Hispanic or LatinoMoved within same state 169 1.3% White / Caucasian36 100.0% American Indian / Alaska Native92 4.4% Asian32 1.7% Other race22 1.0% Two or more races162 1.2% White alone, not Hispanic / Latino60 2.2% Hispanic or LatinoMoved from different state 382 2.9% White / Caucasian8 0.5% Black or African American226 10.8% Asian35 1.8% Other race159 7.3% Two or more races412 2.9% White alone, not Hispanic / Latino132 4.9% Hispanic or LatinoMoved from abroad 246 1.8% White18 0.9% Asian41 2.2% Other race12 0.5% Two or more races373 2.7% White alone, not Hispanic / Latino52 1.9% Hispanic or Latino
Children Nativity (place of birth) in Summit
Children under 6 years - Living with two parents Both parents native 926 100.0% NativeBoth parents foreign-born 158 77.2% Native47 22.8% Foreign-bornOne native, one foreign-born parent 193 100.0% NativeChildren under 6 years - Living with one parent Native parent 16 89.0% Native2 11.0% Foreign-bornForeign-born parent 29 73.1% Native11 26.9% Foreign-bornChildren 6 to 17 years - Living with two parents Both parents native 2,209 100.0% NativeBoth parents foreign-born 512 64.3% Native285 35.7% Foreign-bornOne native, one foreign-born parent 357 100.0% NativeChildren 6 to 17 years - Living with one parent Native parent 586 100.0% NativeForeign-born parent 119 52.1% Native109 47.9% Foreign-born