Races in Suitland, Maryland (MD) Detailed Stats
Data:
Races - White alone (%)
Races - White alone (% change since 2000)
Races - Black alone (%)
Races - Black alone (% change since 2000)
Races - American Indian alone (%)
Races - American Indian alone (% change since 2000)
Races - Asian alone (%)
Races - Asian alone (% change since 2000)
Races - Hispanic (%)
Races - Hispanic (% change since 2000)
Races - Native Hawaiian and Other Pacific Islander alone (%)
Races - Native Hawaiian and Other Pacific Islander alone (% change since 2000)
Races - Two or more races(%)
Races - Two or more races(% change since 2000)
Races - Other race alone (%)
Races - Other race alone (% change since 2000)
Racial diversity
Place of birth - Born in state of residence (%)
Place of birth - Born in state of residence (%) - White
Place of birth - Born in state of residence (%) - Black or African American
Place of birth - Born in state of residence (%) - Asian
Place of birth - Born in state of residence (%) - Hispanic or Latino
Place of birth - Born in state of residence (%) - American Indian and Alaska Native
Place of birth - Born in state of residence (%) - Multirace
Place of birth - Born in state of residence (%) - Other Race
Place of birth - Born in other state (%)
Place of birth - Born in other state (%) - White
Place of birth - Born in other state (%) - Black or African American
Place of birth - Born in other state (%) - Asian
Place of birth - Born in other state (%) - Hispanic or Latino
Place of birth - Born in other state (%) - American Indian and Alaska Native
Place of birth - Born in other state (%) - Multirace
Place of birth - Born in other state (%) - Other Race
Place of birth - Native, outside of US (%)
Place of birth - Native, outside of US (%) - White
Place of birth - Native, outside of US (%) - Black or African American
Place of birth - Native, outside of US (%) - Asian
Place of birth - Native, outside of US (%) - Hispanic or Latino
Place of birth - Native, outside of US (%) - American Indian and Alaska Native
Place of birth - Native, outside of US (%) - Multirace
Place of birth - Native, outside of US (%) - Other Race
Place of birth - Foreign born (%)
Place of birth - Foreign born (%) - White
Place of birth - Foreign born (%) - Black or African American
Place of birth - Foreign born (%) - Asian
Place of birth - Foreign born (%) - Hispanic or Latino
Place of birth - Foreign born (%) - American Indian and Alaska Native
Place of birth - Foreign born (%) - Multirace
Place of birth - Foreign born (%) - Other Race
Residents speaking English at home (%)
Residents speaking English at home - Born in the United States (%)
Residents speaking English at home - Native, born elsewhere (%)
Residents speaking English at home - Foreign born (%)
Residents speaking Spanish at home (%)
Residents speaking Spanish at home - Born in the United States (%)
Residents speaking Spanish at home - Native, born elsewhere (%)
Residents speaking Spanish at home - Foreign born (%)
Residents speaking other language at home (%)
Residents speaking other language at home - Born in the United States (%)
Residents speaking other language at home - Native, born elsewhere (%)
Residents speaking other language at home - Foreign born (%)
Marital status - Never married (%)
Marital status - Now married (%)
Marital status - Separated (%)
Marital status - Widowed (%)
Marital status - Divorced (%)
Ancestries Reported - Arab (%)
Ancestries Reported - Czech (%)
Ancestries Reported - Danish (%)
Ancestries Reported - Dutch (%)
Ancestries Reported - English (%)
Ancestries Reported - French (%)
Ancestries Reported - French Canadian (%)
Ancestries Reported - German (%)
Ancestries Reported - Greek (%)
Ancestries Reported - Hungarian (%)
Ancestries Reported - Irish (%)
Ancestries Reported - Italian (%)
Ancestries Reported - Lithuanian (%)
Ancestries Reported - Norwegian (%)
Ancestries Reported - Polish (%)
Ancestries Reported - Portuguese (%)
Ancestries Reported - Russian (%)
Ancestries Reported - Scotch-Irish (%)
Ancestries Reported - Scottish (%)
Ancestries Reported - Slovak (%)
Ancestries Reported - Subsaharan African (%)
Ancestries Reported - Swedish (%)
Ancestries Reported - Swiss (%)
Ancestries Reported - Ukrainian (%)
Ancestries Reported - United States (%)
Ancestries Reported - Welsh (%)
Ancestries Reported - West Indian (%)
Ancestries Reported - Other (%)
Geographical mobility - Same house 1 year ago (%)
Geographical mobility - Same house 1 year ago (%) - White
Geographical mobility - Same house 1 year ago (%) - Black or African American
Geographical mobility - Same house 1 year ago (%) - Asian
Geographical mobility - Same house 1 year ago (%) - Hispanic or Latino
Geographical mobility - Same house 1 year ago (%) - American Indian and Alaska Native
Geographical mobility - Same house 1 year ago (%) - Multirace
Geographical mobility - Same house 1 year ago (%) - Other Race
Geographical mobility - Moved within same county (%)
Geographical mobility - Moved within same county (%) - White
Geographical mobility - Moved within same county (%) - Black or African American
Geographical mobility - Moved within same county (%) - Asian
Geographical mobility - Moved within same county (%) - Hispanic or Latino
Geographical mobility - Moved within same county (%) - American Indian and Alaska Native
Geographical mobility - Moved within same county (%) - Multirace
Geographical mobility - Moved within same county (%) - Other Race
Geographical mobility - Moved from different county within same state (%)
Geographical mobility - Moved from different county within same state (%) - White
Geographical mobility - Moved from different county within same state (%) - Black or African American
Geographical mobility - Moved from different county within same state (%) - Asian
Geographical mobility - Moved from different county within same state (%) - Hispanic or Latino
Geographical mobility - Moved from different county within same state (%) - American Indian and Alaska Native
Geographical mobility - Moved from different county within same state (%) - Multirace
Geographical mobility - Moved from different county within same state (%) - Other Race
Geographical mobility - Moved from different state (%)
Geographical mobility - Moved from different state (%) - White
Geographical mobility - Moved from different state (%) - Black or African American
Geographical mobility - Moved from different state (%) - Asian
Geographical mobility - Moved from different state (%) - Hispanic or Latino
Geographical mobility - Moved from different state (%) - American Indian and Alaska Native
Geographical mobility - Moved from different state (%) - Multirace
Geographical mobility - Moved from different state (%) - Other Race
Geographical mobility - Moved from abroad (%)
Geographical mobility - Moved from abroad (%) - White
Geographical mobility - Moved from abroad (%) - Black or African American
Geographical mobility - Moved from abroad (%) - Asian
Geographical mobility - Moved from abroad (%) - Hispanic or Latino
Geographical mobility - Moved from abroad (%) - American Indian and Alaska Native
Geographical mobility - Moved from abroad (%) - Multirace
Geographical mobility - Moved from abroad (%) - Other Race
Place of birth for the foreign-born population - Ireland (%)
Place of birth for the foreign-born population - Denmark (%)
Place of birth for the foreign-born population - Norway (%)
Place of birth for the foreign-born population - Sweden (%)
Place of birth for the foreign-born population - United Kingdom (%)
Place of birth for the foreign-born population - England (%)
Place of birth for the foreign-born population - Scotland (%)
Place of birth for the foreign-born population - Other Northern Europe (%)
Place of birth for the foreign-born population - Austria (%)
Place of birth for the foreign-born population - Belgium (%)
Place of birth for the foreign-born population - France (%)
Place of birth for the foreign-born population - Germany (%)
Place of birth for the foreign-born population - Netherlands (%)
Place of birth for the foreign-born population - Switzerland (%)
Place of birth for the foreign-born population - Other Western Europe (%)
Place of birth for the foreign-born population - Greece (%)
Place of birth for the foreign-born population - Italy (%)
Place of birth for the foreign-born population - Portugal (%)
Place of birth for the foreign-born population - Spain (%)
Place of birth for the foreign-born population - Other Southern Europe (%)
Place of birth for the foreign-born population - Albania (%)
Place of birth for the foreign-born population - Belarus (%)
Place of birth for the foreign-born population - Bosnia and Herzegovina (%)
Place of birth for the foreign-born population - Bulgaria (%)
Place of birth for the foreign-born population - Croatia (%)
Place of birth for the foreign-born population - Czechoslovakia (%)
Place of birth for the foreign-born population - Hungary (%)
Place of birth for the foreign-born population - Latvia (%)
Place of birth for the foreign-born population - Lithuania (%)
Place of birth for the foreign-born population - North Macedonia (Macedonia) (%)
Place of birth for the foreign-born population - Moldova (%)
Place of birth for the foreign-born population - Poland (%)
Place of birth for the foreign-born population - Romania (%)
Place of birth for the foreign-born population - Russia (%)
Place of birth for the foreign-born population - Serbia (%)
Place of birth for the foreign-born population - Ukraine (%)
Place of birth for the foreign-born population - Other Eastern Europe (%)
Place of birth for the foreign-born population - China (%)
Place of birth for the foreign-born population - Hong Kong (%)
Place of birth for the foreign-born population - Taiwan (%)
Place of birth for the foreign-born population - Japan (%)
Place of birth for the foreign-born population - Korea (%)
Place of birth for the foreign-born population - Other Eastern Asia (%)
Place of birth for the foreign-born population - Afghanistan (%)
Place of birth for the foreign-born population - Bangladesh (%)
Place of birth for the foreign-born population - India (%)
Place of birth for the foreign-born population - Iran (%)
Place of birth for the foreign-born population - Kazakhstan (%)
Place of birth for the foreign-born population - Nepal (%)
Place of birth for the foreign-born population - Pakistan (%)
Place of birth for the foreign-born population - Sri Lanka (%)
Place of birth for the foreign-born population - Uzbekistan (%)
Place of birth for the foreign-born population - Other South Central Asia (%)
Place of birth for the foreign-born population - Burma (%)
Place of birth for the foreign-born population - Cambodia (%)
Place of birth for the foreign-born population - Indonesia (%)
Place of birth for the foreign-born population - Laos (%)
Place of birth for the foreign-born population - Malaysia (%)
Place of birth for the foreign-born population - Philippines (%)
Place of birth for the foreign-born population - Singapore (%)
Place of birth for the foreign-born population - Thailand (%)
Place of birth for the foreign-born population - Vietnam (%)
Place of birth for the foreign-born population - Other South Eastern Asia (%)
Place of birth for the foreign-born population - Armenia (%)
Place of birth for the foreign-born population - Iraq (%)
Place of birth for the foreign-born population - Israel (%)
Place of birth for the foreign-born population - Jordan (%)
Place of birth for the foreign-born population - Kuwait (%)
Place of birth for the foreign-born population - Lebanon (%)
Place of birth for the foreign-born population - Saudi Arabia (%)
Place of birth for the foreign-born population - Syria (%)
Place of birth for the foreign-born population - Turkey (%)
Place of birth for the foreign-born population - Yemen (%)
Place of birth for the foreign-born population - Other Western Asia (%)
Place of birth for the foreign-born population - Eritrea (%)
Place of birth for the foreign-born population - Ethiopia (%)
Place of birth for the foreign-born population - Kenya (%)
Place of birth for the foreign-born population - Somalia (%)
Place of birth for the foreign-born population - Uganda (%)
Place of birth for the foreign-born population - Zimbabwe (%)
Place of birth for the foreign-born population - Other Eastern Africa (%)
Place of birth for the foreign-born population - Cameroon (%)
Place of birth for the foreign-born population - Congo (%)
Place of birth for the foreign-born population - Democratic Republic of Congo (Zaire) (%)
Place of birth for the foreign-born population - Other Middle Africa (%)
Place of birth for the foreign-born population - Egypt (%)
Place of birth for the foreign-born population - Morocco (%)
Place of birth for the foreign-born population - Sudan (%)
Place of birth for the foreign-born population - Other Northern Africa (%)
Place of birth for the foreign-born population - South Africa (%)
Place of birth for the foreign-born population - Other Southern Africa (%)
Place of birth for the foreign-born population - Cabo Verde (%)
Place of birth for the foreign-born population - Ghana (%)
Place of birth for the foreign-born population - Liberia (%)
Place of birth for the foreign-born population - Nigeria (%)
Place of birth for the foreign-born population - Senegal (%)
Place of birth for the foreign-born population - Sierra Leone (%)
Place of birth for the foreign-born population - Other Western Africa (%)
Place of birth for the foreign-born population - Australia (%)
Place of birth for the foreign-born population - New Zealand (%)
Place of birth for the foreign-born population - Fiji (%)
Place of birth for the foreign-born population - Micronesia (%)
Place of birth for the foreign-born population - Bahamas (%)
Place of birth for the foreign-born population - Barbados (%)
Place of birth for the foreign-born population - Cuba (%)
Place of birth for the foreign-born population - Dominica (%)
Place of birth for the foreign-born population - Dominican Republic (%)
Place of birth for the foreign-born population - Grenada (%)
Place of birth for the foreign-born population - Haiti (%)
Place of birth for the foreign-born population - Jamaica (%)
Place of birth for the foreign-born population - St. Vincent and the Grenadines (%)
Place of birth for the foreign-born population - Trinidad and Tobago (%)
Place of birth for the foreign-born population - West Indies (%)
Place of birth for the foreign-born population - Other Caribbean (%)
Place of birth for the foreign-born population - Belize (%)
Place of birth for the foreign-born population - Costa Rica (%)
Place of birth for the foreign-born population - El Salvador (%)
Place of birth for the foreign-born population - Guatemala (%)
Place of birth for the foreign-born population - Honduras (%)
Place of birth for the foreign-born population - Mexico (%)
Place of birth for the foreign-born population - Nicaragua (%)
Place of birth for the foreign-born population - Panama (%)
Place of birth for the foreign-born population - Other Central America (%)
Place of birth for the foreign-born population - Argentina (%)
Place of birth for the foreign-born population - Bolivia (%)
Place of birth for the foreign-born population - Brazil (%)
Place of birth for the foreign-born population - Chile (%)
Place of birth for the foreign-born population - Colombia (%)
Place of birth for the foreign-born population - Ecuador (%)
Place of birth for the foreign-born population - Guyana (%)
Place of birth for the foreign-born population - Peru (%)
Place of birth for the foreign-born population - Uruguay (%)
Place of birth for the foreign-born population - Venezuela (%)
Place of birth for the foreign-born population - Other South America (%)
Place of birth for the foreign-born population - Canada (%)
Place of birth for the foreign-born population - Other Northern America (%)
Place of birth for the foreign-born population - Other (%)
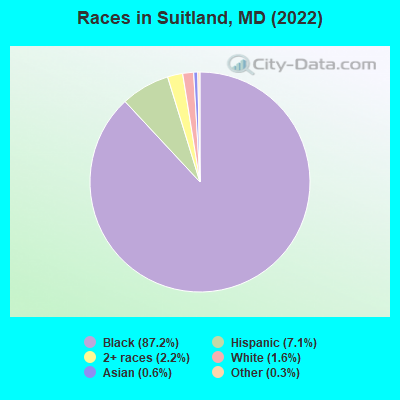
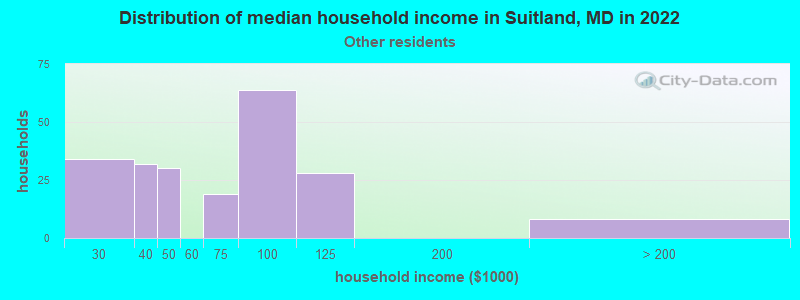
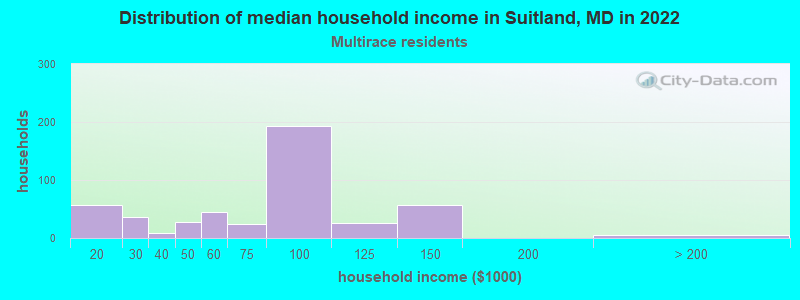
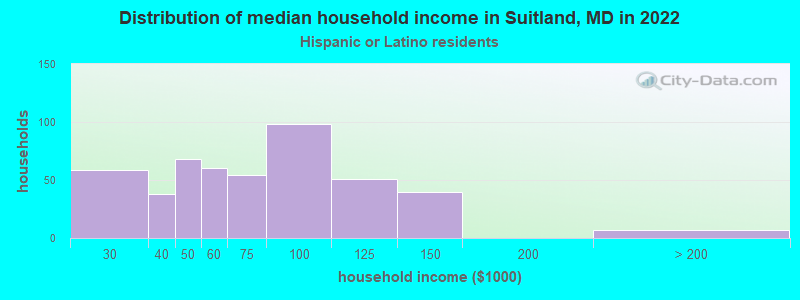
According to 2022 data, the most numerous races in Suitland, MD are White alone (411 residents), Black alone (22,282 residents), and Hispanic (1,810 residents). 86.7% of Suitland residents speak English at home.
Race distribution in Suitland 22,282 87.2% Black alone 1,810 7.1% Hispanic 575 2.2% Two or more races 411 1.6% White alone 161 0.6% Asian alone 69 0.3% Other race alone
2000 2022
3,286,547 62.1% White alone 1,464,735 27.7% Black alone 227,916 4.3% Hispanic 209,738 4.0% Asian alone 82,946 1.6% Two or more races 13,312 0.3% American Indian alone 9,379 0.2% Other race alone 1,913 0.04% Native Hawaiian and Other
2,906,492 47.1% White alone 1,800,914 29.2% Black alone 705,842 11.4% Hispanic 401,818 6.5% Asian alone 291,317 4.7% Two or more races 46,930 0.8% Other race alone 8,930 0.1% American Indian alone 2,417 0.04% Native Hawaiian and Other
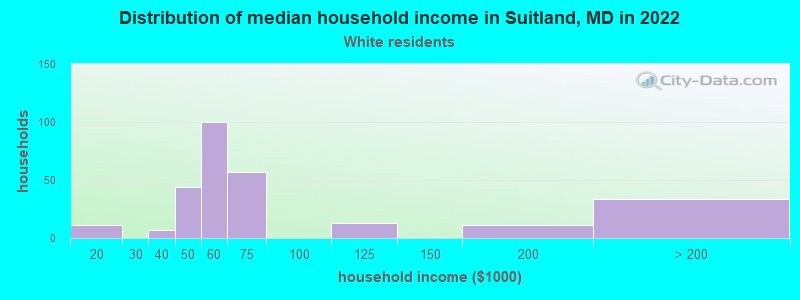
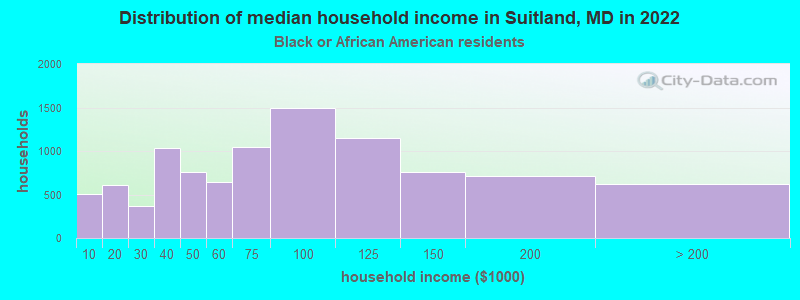
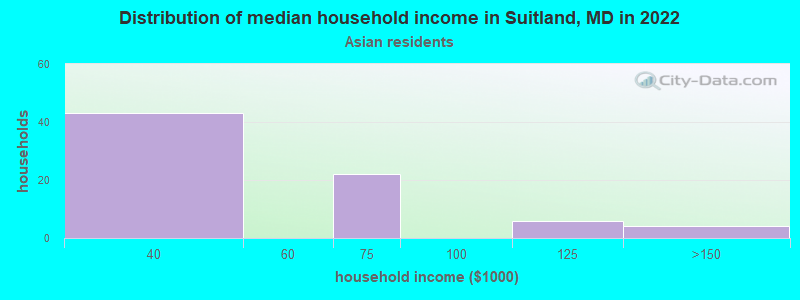
Income and house value in Suitland Median household income in 2022 $55,072 White non-Hispanic householders$73,272 Black householders$56,794 Asian householders$69,248 Some other race householders$51,087 Two or more races householders$68,192 Hispanic or Latino race householders
Median age by race in Suitland
41.9 Median age for White residents51.1 32.1 41.1 Median age for Black or African American residents40.3 42.1 -780,410,741.7 Median age for American Indian / Alaska Native residents-888,297,871.5 -689,905,591.2 43.0 Median age for Asian residents45.3 39.0 -571,600,480.8 Median age for Native Hawaiian / Pacific Islander residents-720,061,021.4 -760,942,760.2 23.7 Median age for Other race residents15.2 34.6 26.0 Median age for Two or more races residents33.7 24.1 41.1 Median age for White alone residents48.5 36.9 23.1 Median age for Hispanic or Latino residents23.5 23.3
Owner/renter occupied households by race in Suitland
House owners and renters - White residents 127 46.1% Owner occupied149 53.9% Renter occupiedHouse owners and renters - Black or African American residents 3,506 36.3% Owner occupied6,149 63.7% Renter occupiedHouse owners and renters - Asian residents 40 69.3% Owner occupied18 30.7% Renter occupiedHouse owners and renters - Other race residents 33 15.5% Owner occupied179 84.5% Renter occupiedHouse owners and renters - Two or more races residents 257 37.2% Owner occupied434 62.8% Renter occupiedHouse owners and renters - White alone residents 121 47.4% Owner occupied134 52.6% Renter occupiedHouse owners and renters - Hispanic or Latino residents 137 29.5% Owner occupied327 70.5% Renter occupied
Language usage in Suitland
English speakers - Total 86.7% of residents of Suitland speak English at home.
5.5% of residents speak Spanish at home 537 40.7% Speak English very well782 59.3% Speak English less than very well5.7% of residents speak other language at home 1,070 77.6% Speak English very well309 22.4% Speak English less than very well
English speakers - Born in the United States 95.7% of residents of Suitland speak English at home.
2.4% of residents speak Spanish at home 293 81.2% Speak English very well68 18.8% Speak English less than very well1.1% of residents speak other language at home 167 100.0% Speak English very well
English speakers - Native, born elsewhere 97.6% of residents of Suitland speak English at home.
3.8% of residents speak Spanish at home 8 100.0% Speak English very well
English speakers - Foreign-born 21.5% of residents of Suitland speak English at home.
32.7% of residents speak Spanish at home 127 16.1% Speak English very well662 83.9% Speak English less than very well46.9% of residents speak other language at home 824 72.9% Speak English very well307 27.1% Speak English less than very well
White (Caucasian) - Speak only English Native:
93.9% (399)Foreign-born:
3.8% (1)
White (Caucasian) - Speak another language Native:
6.4% (27)Foreign-born:
88.4% (21)
Black or African American - Speak only English Native:
97.6% (19,031)Foreign-born:
25.5% (333)
Black or African American - Speak another language Native:
2.2% (421)Foreign-born:
76.1% (994)
Asian - Speak only English Native:
78.1% (4)Foreign-born:
30.7% (62)
Other race - Speak only English Native:
48.4% (133)Foreign-born:
4.8% (22)
Other race - Speak another language Native:
56.4% (155)Foreign-born:
94.9% (431)
Two or more races - Speak only English Native:
70.5% (455)Foreign-born:
19.6% (120)
Two or more races - Speak another language Native:
30.2% (195)Foreign-born:
80.7% (494)
White alone - Speak only English Native:
95.6% (394)Foreign-born:
52.0% (1)
White alone - Speak another language Native:
4.2% (17)Foreign-born:
49.1% (1)
Hispanic or Latino - Speak only English Native:
30.9% (184)Foreign-born:
7.4% (64)
Hispanic or Latino - Speak another language Native:
69.8% (415)Foreign-born:
91.9% (794)
Foreign-born residents in Suitland
Marital status for residents in Suitland Marital status - White (Caucasian) population 15 years and over
Males 31.4% Never married51.2% Now married4.8% Separated0.0% Widowed12.6% DivorcedFemales 65.0% Never married29.2% Now married0.0% Separated0.4% Widowed5.4% DivorcedWomen who gave birth in the past 12 months Now married:
100.0% (6)Unmarried:
0.0% (0)
Women who did not give birth in the past 12 months Now married:
22.2% (31)Unmarried:
77.8% (108)
Marital status - Black or African American population 15 years and over
Males 51.0% Never married29.3% Now married2.2% Separated3.3% Widowed14.3% DivorcedFemales 52.0% Never married24.0% Now married2.8% Separated6.3% Widowed14.9% DivorcedWomen who gave birth in the past 12 months Now married:
19.5% (39)Unmarried:
80.5% (163)
Women who did not give birth in the past 12 months Now married:
21.0% (1,117)Unmarried:
79.0% (4,202)
Marital status - Asian population 15 years and over
Males 47.5% Never married52.5% Now married0.0% Separated0.0% Widowed0.0% DivorcedFemales 23.3% Never married56.7% Now married20.0% Separated0.0% Widowed0.0% DivorcedWomen who did not give birth in the past 12 months Now married:
76.7% (22)Unmarried:
23.3% (7)
Marital status - Other race population 15 years and over
Males 63.0% Never married37.0% Now married0.0% Separated0.0% Widowed0.0% DivorcedFemales 71.2% Never married17.3% Now married0.0% Separated0.0% Widowed11.5% DivorcedWomen who did not give birth in the past 12 months Now married:
21.0% (50)Unmarried:
79.0% (188)
Marital status - Two or more races population 15 years and over
Males 56.8% Never married39.5% Now married0.0% Separated3.7% Widowed0.0% DivorcedFemales 28.1% Never married45.5% Now married0.0% Separated11.8% Widowed14.6% DivorcedWomen who gave birth in the past 12 months Now married:
100.0% (51)Unmarried:
0.0% (0)
Women who did not give birth in the past 12 months Now married:
55.3% (170)Unmarried:
44.7% (138)
Marital status - White alone, not Hispanic / Latino population 15 years and over
Males 25.5% Never married54.9% Now married5.4% Separated0.0% Widowed14.1% DivorcedFemales 61.3% Never married32.0% Now married0.0% Separated0.4% Widowed6.2% DivorcedWomen who gave birth in the past 12 months Now married:
100.0% (7)Unmarried:
0.0% (0)
Women who did not give birth in the past 12 months Now married:
25.9% (34)Unmarried:
74.1% (98)
Marital status - Hispanic or Latino population 15 years and over
Males 52.6% Never married42.0% Now married0.0% Separated0.0% Widowed5.4% DivorcedFemales 44.6% Never married41.8% Now married0.0% Separated6.3% Widowed7.3% DivorcedWomen who gave birth in the past 12 months Now married:
100.0% (48)Unmarried:
0.0% (0)
Women who did not give birth in the past 12 months Now married:
41.6% (192)Unmarried:
58.4% (269)
Ancestries in Suitland
328 1.7% Ghanaian317 1.6% American291 1.5% African185 0.9% Ethiopian103 0.5% Jamaican74 0.4% English69 0.4% Portuguese63 0.3% Haitian44 0.2% West Indian39 0.2% German37 0.2% Guyanese37 0.2% Irish32 0.2% Nigerian17 0.09% Italian1 0.01% Belgian
Children Nativity (place of birth) in Suitland
Children under 6 years - Living with two parents Both parents native 454 100.0% NativeBoth parents foreign-born 145 100.0% NativeOne native, one foreign-born parent 228 100.0% NativeChildren under 6 years - Living with one parent Native parent 791 100.0% NativeForeign-born parent 44 100.0% NativeChildren 6 to 17 years - Living with two parents Both parents native 524 99.9% Native1 0.1% Foreign-bornBoth parents foreign-born 244 62.2% Native148 37.8% Foreign-bornOne native, one foreign-born parent 45 100.0% NativeChildren 6 to 17 years - Living with one parent Native parent 1,607 100.0% NativeForeign-born parent 273 63.2% Native159 36.8% Foreign-born
Grandparents responsible for own grandchildren in Suitland
Grandparents (30 to 59 years) Black or African American 135 46.1% Responsible for grandchildren158 53.9% Not responsible for grandchildrenOther race 22 100.0% Not responsible for grandchildrenHispanic or Latino 23 100.0% Not responsible for grandchildrenGrandparents (60 years and over) Black or African American 95 29.2% Responsible for grandchildren231 70.8% Not responsible for grandchildrenHispanic or Latino 44 100.0% Not responsible for grandchildren