Races in Sugarland Run, Virginia (VA) Detailed Stats
Data:
Races - White alone (%)
Races - White alone (% change since 2000)
Races - Black alone (%)
Races - Black alone (% change since 2000)
Races - American Indian alone (%)
Races - American Indian alone (% change since 2000)
Races - Asian alone (%)
Races - Asian alone (% change since 2000)
Races - Hispanic (%)
Races - Hispanic (% change since 2000)
Races - Native Hawaiian and Other Pacific Islander alone (%)
Races - Native Hawaiian and Other Pacific Islander alone (% change since 2000)
Races - Two or more races(%)
Races - Two or more races(% change since 2000)
Races - Other race alone (%)
Races - Other race alone (% change since 2000)
Racial diversity
Place of birth - Born in state of residence (%)
Place of birth - Born in state of residence (%) - White
Place of birth - Born in state of residence (%) - Black or African American
Place of birth - Born in state of residence (%) - Asian
Place of birth - Born in state of residence (%) - Hispanic or Latino
Place of birth - Born in state of residence (%) - American Indian and Alaska Native
Place of birth - Born in state of residence (%) - Multirace
Place of birth - Born in state of residence (%) - Other Race
Place of birth - Born in other state (%)
Place of birth - Born in other state (%) - White
Place of birth - Born in other state (%) - Black or African American
Place of birth - Born in other state (%) - Asian
Place of birth - Born in other state (%) - Hispanic or Latino
Place of birth - Born in other state (%) - American Indian and Alaska Native
Place of birth - Born in other state (%) - Multirace
Place of birth - Born in other state (%) - Other Race
Place of birth - Native, outside of US (%)
Place of birth - Native, outside of US (%) - White
Place of birth - Native, outside of US (%) - Black or African American
Place of birth - Native, outside of US (%) - Asian
Place of birth - Native, outside of US (%) - Hispanic or Latino
Place of birth - Native, outside of US (%) - American Indian and Alaska Native
Place of birth - Native, outside of US (%) - Multirace
Place of birth - Native, outside of US (%) - Other Race
Place of birth - Foreign born (%)
Place of birth - Foreign born (%) - White
Place of birth - Foreign born (%) - Black or African American
Place of birth - Foreign born (%) - Asian
Place of birth - Foreign born (%) - Hispanic or Latino
Place of birth - Foreign born (%) - American Indian and Alaska Native
Place of birth - Foreign born (%) - Multirace
Place of birth - Foreign born (%) - Other Race
Residents speaking English at home (%)
Residents speaking English at home - Born in the United States (%)
Residents speaking English at home - Native, born elsewhere (%)
Residents speaking English at home - Foreign born (%)
Residents speaking Spanish at home (%)
Residents speaking Spanish at home - Born in the United States (%)
Residents speaking Spanish at home - Native, born elsewhere (%)
Residents speaking Spanish at home - Foreign born (%)
Residents speaking other language at home (%)
Residents speaking other language at home - Born in the United States (%)
Residents speaking other language at home - Native, born elsewhere (%)
Residents speaking other language at home - Foreign born (%)
Marital status - Never married (%)
Marital status - Now married (%)
Marital status - Separated (%)
Marital status - Widowed (%)
Marital status - Divorced (%)
Ancestries Reported - Arab (%)
Ancestries Reported - Czech (%)
Ancestries Reported - Danish (%)
Ancestries Reported - Dutch (%)
Ancestries Reported - English (%)
Ancestries Reported - French (%)
Ancestries Reported - French Canadian (%)
Ancestries Reported - German (%)
Ancestries Reported - Greek (%)
Ancestries Reported - Hungarian (%)
Ancestries Reported - Irish (%)
Ancestries Reported - Italian (%)
Ancestries Reported - Lithuanian (%)
Ancestries Reported - Norwegian (%)
Ancestries Reported - Polish (%)
Ancestries Reported - Portuguese (%)
Ancestries Reported - Russian (%)
Ancestries Reported - Scotch-Irish (%)
Ancestries Reported - Scottish (%)
Ancestries Reported - Slovak (%)
Ancestries Reported - Subsaharan African (%)
Ancestries Reported - Swedish (%)
Ancestries Reported - Swiss (%)
Ancestries Reported - Ukrainian (%)
Ancestries Reported - United States (%)
Ancestries Reported - Welsh (%)
Ancestries Reported - West Indian (%)
Ancestries Reported - Other (%)
Geographical mobility - Same house 1 year ago (%)
Geographical mobility - Same house 1 year ago (%) - White
Geographical mobility - Same house 1 year ago (%) - Black or African American
Geographical mobility - Same house 1 year ago (%) - Asian
Geographical mobility - Same house 1 year ago (%) - Hispanic or Latino
Geographical mobility - Same house 1 year ago (%) - American Indian and Alaska Native
Geographical mobility - Same house 1 year ago (%) - Multirace
Geographical mobility - Same house 1 year ago (%) - Other Race
Geographical mobility - Moved within same county (%)
Geographical mobility - Moved within same county (%) - White
Geographical mobility - Moved within same county (%) - Black or African American
Geographical mobility - Moved within same county (%) - Asian
Geographical mobility - Moved within same county (%) - Hispanic or Latino
Geographical mobility - Moved within same county (%) - American Indian and Alaska Native
Geographical mobility - Moved within same county (%) - Multirace
Geographical mobility - Moved within same county (%) - Other Race
Geographical mobility - Moved from different county within same state (%)
Geographical mobility - Moved from different county within same state (%) - White
Geographical mobility - Moved from different county within same state (%) - Black or African American
Geographical mobility - Moved from different county within same state (%) - Asian
Geographical mobility - Moved from different county within same state (%) - Hispanic or Latino
Geographical mobility - Moved from different county within same state (%) - American Indian and Alaska Native
Geographical mobility - Moved from different county within same state (%) - Multirace
Geographical mobility - Moved from different county within same state (%) - Other Race
Geographical mobility - Moved from different state (%)
Geographical mobility - Moved from different state (%) - White
Geographical mobility - Moved from different state (%) - Black or African American
Geographical mobility - Moved from different state (%) - Asian
Geographical mobility - Moved from different state (%) - Hispanic or Latino
Geographical mobility - Moved from different state (%) - American Indian and Alaska Native
Geographical mobility - Moved from different state (%) - Multirace
Geographical mobility - Moved from different state (%) - Other Race
Geographical mobility - Moved from abroad (%)
Geographical mobility - Moved from abroad (%) - White
Geographical mobility - Moved from abroad (%) - Black or African American
Geographical mobility - Moved from abroad (%) - Asian
Geographical mobility - Moved from abroad (%) - Hispanic or Latino
Geographical mobility - Moved from abroad (%) - American Indian and Alaska Native
Geographical mobility - Moved from abroad (%) - Multirace
Geographical mobility - Moved from abroad (%) - Other Race
Place of birth for the foreign-born population - Ireland (%)
Place of birth for the foreign-born population - Denmark (%)
Place of birth for the foreign-born population - Norway (%)
Place of birth for the foreign-born population - Sweden (%)
Place of birth for the foreign-born population - United Kingdom (%)
Place of birth for the foreign-born population - England (%)
Place of birth for the foreign-born population - Scotland (%)
Place of birth for the foreign-born population - Other Northern Europe (%)
Place of birth for the foreign-born population - Austria (%)
Place of birth for the foreign-born population - Belgium (%)
Place of birth for the foreign-born population - France (%)
Place of birth for the foreign-born population - Germany (%)
Place of birth for the foreign-born population - Netherlands (%)
Place of birth for the foreign-born population - Switzerland (%)
Place of birth for the foreign-born population - Other Western Europe (%)
Place of birth for the foreign-born population - Greece (%)
Place of birth for the foreign-born population - Italy (%)
Place of birth for the foreign-born population - Portugal (%)
Place of birth for the foreign-born population - Spain (%)
Place of birth for the foreign-born population - Other Southern Europe (%)
Place of birth for the foreign-born population - Albania (%)
Place of birth for the foreign-born population - Belarus (%)
Place of birth for the foreign-born population - Bosnia and Herzegovina (%)
Place of birth for the foreign-born population - Bulgaria (%)
Place of birth for the foreign-born population - Croatia (%)
Place of birth for the foreign-born population - Czechoslovakia (%)
Place of birth for the foreign-born population - Hungary (%)
Place of birth for the foreign-born population - Latvia (%)
Place of birth for the foreign-born population - Lithuania (%)
Place of birth for the foreign-born population - North Macedonia (Macedonia) (%)
Place of birth for the foreign-born population - Moldova (%)
Place of birth for the foreign-born population - Poland (%)
Place of birth for the foreign-born population - Romania (%)
Place of birth for the foreign-born population - Russia (%)
Place of birth for the foreign-born population - Serbia (%)
Place of birth for the foreign-born population - Ukraine (%)
Place of birth for the foreign-born population - Other Eastern Europe (%)
Place of birth for the foreign-born population - China (%)
Place of birth for the foreign-born population - Hong Kong (%)
Place of birth for the foreign-born population - Taiwan (%)
Place of birth for the foreign-born population - Japan (%)
Place of birth for the foreign-born population - Korea (%)
Place of birth for the foreign-born population - Other Eastern Asia (%)
Place of birth for the foreign-born population - Afghanistan (%)
Place of birth for the foreign-born population - Bangladesh (%)
Place of birth for the foreign-born population - India (%)
Place of birth for the foreign-born population - Iran (%)
Place of birth for the foreign-born population - Kazakhstan (%)
Place of birth for the foreign-born population - Nepal (%)
Place of birth for the foreign-born population - Pakistan (%)
Place of birth for the foreign-born population - Sri Lanka (%)
Place of birth for the foreign-born population - Uzbekistan (%)
Place of birth for the foreign-born population - Other South Central Asia (%)
Place of birth for the foreign-born population - Burma (%)
Place of birth for the foreign-born population - Cambodia (%)
Place of birth for the foreign-born population - Indonesia (%)
Place of birth for the foreign-born population - Laos (%)
Place of birth for the foreign-born population - Malaysia (%)
Place of birth for the foreign-born population - Philippines (%)
Place of birth for the foreign-born population - Singapore (%)
Place of birth for the foreign-born population - Thailand (%)
Place of birth for the foreign-born population - Vietnam (%)
Place of birth for the foreign-born population - Other South Eastern Asia (%)
Place of birth for the foreign-born population - Armenia (%)
Place of birth for the foreign-born population - Iraq (%)
Place of birth for the foreign-born population - Israel (%)
Place of birth for the foreign-born population - Jordan (%)
Place of birth for the foreign-born population - Kuwait (%)
Place of birth for the foreign-born population - Lebanon (%)
Place of birth for the foreign-born population - Saudi Arabia (%)
Place of birth for the foreign-born population - Syria (%)
Place of birth for the foreign-born population - Turkey (%)
Place of birth for the foreign-born population - Yemen (%)
Place of birth for the foreign-born population - Other Western Asia (%)
Place of birth for the foreign-born population - Eritrea (%)
Place of birth for the foreign-born population - Ethiopia (%)
Place of birth for the foreign-born population - Kenya (%)
Place of birth for the foreign-born population - Somalia (%)
Place of birth for the foreign-born population - Uganda (%)
Place of birth for the foreign-born population - Zimbabwe (%)
Place of birth for the foreign-born population - Other Eastern Africa (%)
Place of birth for the foreign-born population - Cameroon (%)
Place of birth for the foreign-born population - Congo (%)
Place of birth for the foreign-born population - Democratic Republic of Congo (Zaire) (%)
Place of birth for the foreign-born population - Other Middle Africa (%)
Place of birth for the foreign-born population - Egypt (%)
Place of birth for the foreign-born population - Morocco (%)
Place of birth for the foreign-born population - Sudan (%)
Place of birth for the foreign-born population - Other Northern Africa (%)
Place of birth for the foreign-born population - South Africa (%)
Place of birth for the foreign-born population - Other Southern Africa (%)
Place of birth for the foreign-born population - Cabo Verde (%)
Place of birth for the foreign-born population - Ghana (%)
Place of birth for the foreign-born population - Liberia (%)
Place of birth for the foreign-born population - Nigeria (%)
Place of birth for the foreign-born population - Senegal (%)
Place of birth for the foreign-born population - Sierra Leone (%)
Place of birth for the foreign-born population - Other Western Africa (%)
Place of birth for the foreign-born population - Australia (%)
Place of birth for the foreign-born population - New Zealand (%)
Place of birth for the foreign-born population - Fiji (%)
Place of birth for the foreign-born population - Micronesia (%)
Place of birth for the foreign-born population - Bahamas (%)
Place of birth for the foreign-born population - Barbados (%)
Place of birth for the foreign-born population - Cuba (%)
Place of birth for the foreign-born population - Dominica (%)
Place of birth for the foreign-born population - Dominican Republic (%)
Place of birth for the foreign-born population - Grenada (%)
Place of birth for the foreign-born population - Haiti (%)
Place of birth for the foreign-born population - Jamaica (%)
Place of birth for the foreign-born population - St. Vincent and the Grenadines (%)
Place of birth for the foreign-born population - Trinidad and Tobago (%)
Place of birth for the foreign-born population - West Indies (%)
Place of birth for the foreign-born population - Other Caribbean (%)
Place of birth for the foreign-born population - Belize (%)
Place of birth for the foreign-born population - Costa Rica (%)
Place of birth for the foreign-born population - El Salvador (%)
Place of birth for the foreign-born population - Guatemala (%)
Place of birth for the foreign-born population - Honduras (%)
Place of birth for the foreign-born population - Mexico (%)
Place of birth for the foreign-born population - Nicaragua (%)
Place of birth for the foreign-born population - Panama (%)
Place of birth for the foreign-born population - Other Central America (%)
Place of birth for the foreign-born population - Argentina (%)
Place of birth for the foreign-born population - Bolivia (%)
Place of birth for the foreign-born population - Brazil (%)
Place of birth for the foreign-born population - Chile (%)
Place of birth for the foreign-born population - Colombia (%)
Place of birth for the foreign-born population - Ecuador (%)
Place of birth for the foreign-born population - Guyana (%)
Place of birth for the foreign-born population - Peru (%)
Place of birth for the foreign-born population - Uruguay (%)
Place of birth for the foreign-born population - Venezuela (%)
Place of birth for the foreign-born population - Other South America (%)
Place of birth for the foreign-born population - Canada (%)
Place of birth for the foreign-born population - Other Northern America (%)
Place of birth for the foreign-born population - Other (%)
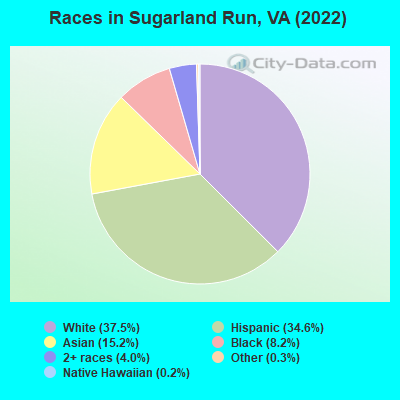
According to 2022 data, the most numerous races in Sugarland Run, VA are White alone (4,939 residents), Black alone (1,080 residents), and Hispanic (4,560 residents). 42.4% of Sugarland Run residents speak English at home.
Race distribution in Sugarland Run 4,939 37.5% White alone 4,560 34.6% Hispanic 2,000 15.2% Asian alone 1,080 8.2% Black alone 528 4.0% Two or more races 45 0.3% Other race alone 23 0.2% Native Hawaiian and Other 2 0.02% American Indian alone
2000 2022
4,965,637 70.2% White alone 1,376,378 19.4% Black alone 329,540 4.7% Hispanic 259,277 3.7% Asian alone 114,022 1.6% Two or more races 18,596 0.3% American Indian alone 11,685 0.2% Other race alone 3,380 0.05% Native Hawaiian and Other
5,095,130 58.7% White alone 1,594,785 18.4% Black alone 905,750 10.4% Hispanic 602,881 6.9% Asian alone 406,047 4.7% Two or more races 60,419 0.7% Other race alone 11,738 0.1% American Indian alone 6,869 0.08% Native Hawaiian and Other
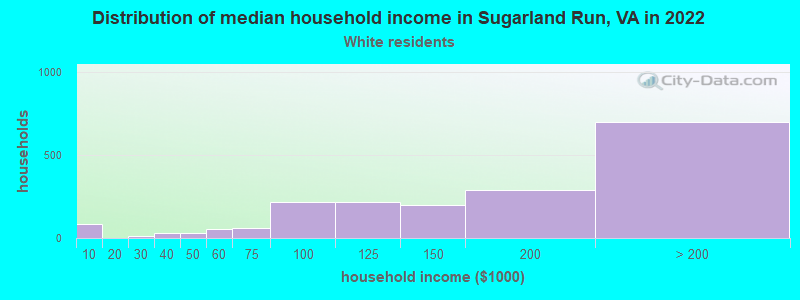
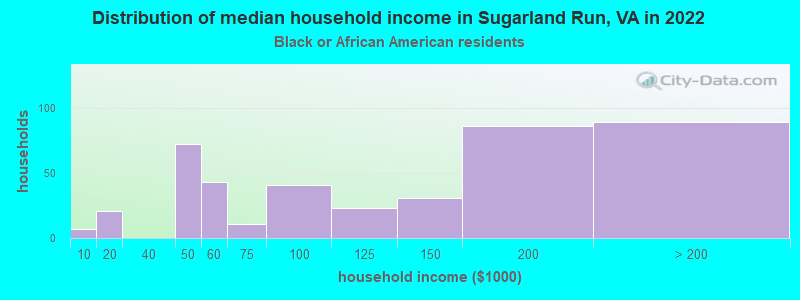
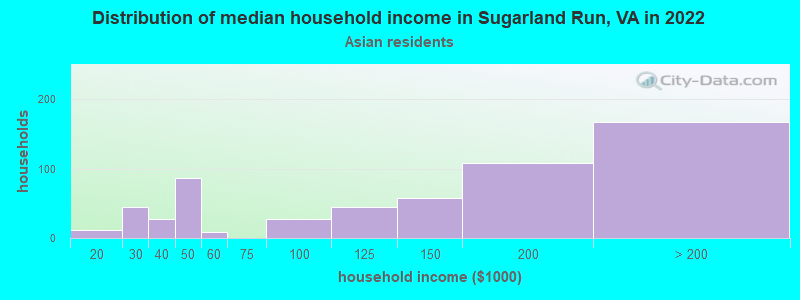
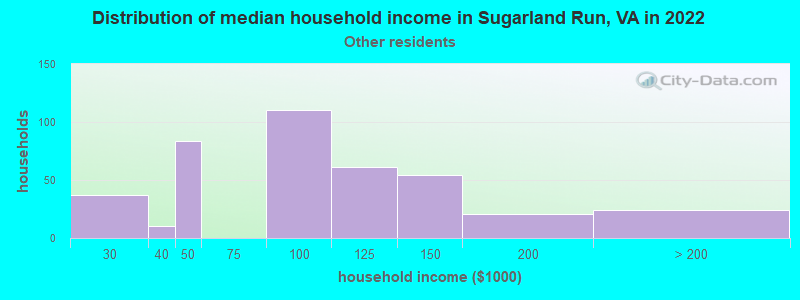
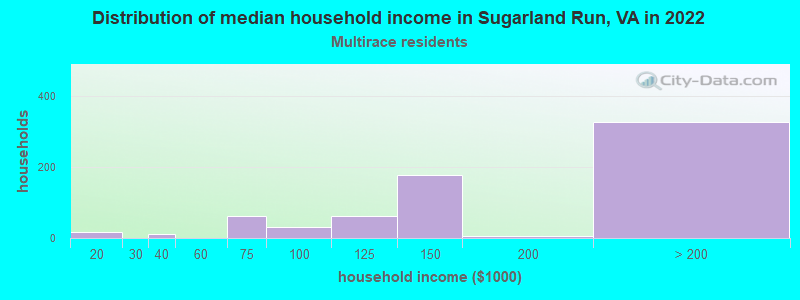
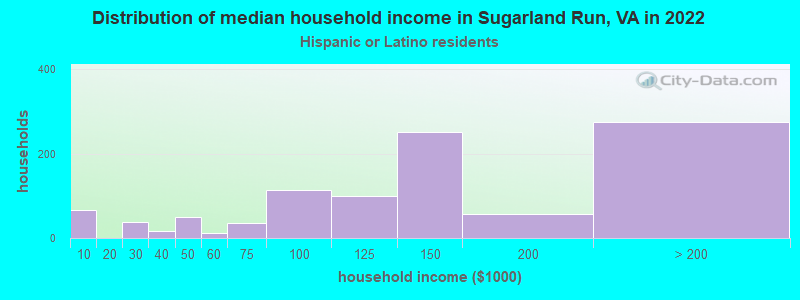
Income and house value in Sugarland Run Median household income in 2022 $162,253 White non-Hispanic householders$124,390 Black householders$145,022 Asian householders$85,339 Some other race householders$134,803 Hispanic or Latino race householders
Median age by race in Sugarland Run
37.2 Median age for White residents36.8 37.4 42.9 Median age for Black or African American residents39.5 43.5 -792,063,491.3 Median age for American Indian / Alaska Native residents-862,921,347.5 -673,154,906.1 43.5 Median age for Asian residents40.2 48.0 53.1 Median age for Native Hawaiian / Pacific Islander residents-541,531,822.5 33.0 26.8 Median age for Other race residents26.6 24.6 36.1 Median age for Two or more races residents35.3 46.0 37.7 Median age for White alone residents37.5 38.0 29.6 Median age for Hispanic or Latino residents29.1 32.8
Owner/renter occupied households by race in Sugarland Run
House owners and renters - White residents 1,647 86.5% Owner occupied256 13.5% Renter occupiedHouse owners and renters - Black or African American residents 260 63.7% Owner occupied148 36.3% Renter occupiedHouse owners and renters - Asian residents 542 94.2% Owner occupied34 5.8% Renter occupiedHouse owners and renters - Native Hawaiian / Pacific Islander residents 3 100.0% Owner occupiedHouse owners and renters - Other race residents 189 54.0% Owner occupied161 46.0% Renter occupiedHouse owners and renters - Two or more races residents 553 84.6% Owner occupied101 15.4% Renter occupiedHouse owners and renters - White alone residents 1,478 86.6% Owner occupied228 13.4% Renter occupiedHouse owners and renters - Hispanic or Latino residents 788 80.3% Owner occupied193 19.7% Renter occupied
Language usage in Sugarland Run
English speakers - Total 42.4% of residents of Sugarland Run speak English at home.
30.0% of residents speak Spanish at home 2,542 67.9% Speak English very well1,201 32.1% Speak English less than very well29.6% of residents speak other language at home 2,254 61.0% Speak English very well1,440 39.0% Speak English less than very well
English speakers - Born in the United States 83.4% of residents of Sugarland Run speak English at home.
5.7% of residents speak Spanish at home 198 100.0% Speak English very well12.4% of residents speak other language at home 418 97.4% Speak English very well11 2.6% Speak English less than very well
English speakers - Native, born elsewhere 44.6% of residents of Sugarland Run speak English at home.
47.5% of residents speak Spanish at home 66 100.0% Speak English very well12.9% of residents speak other language at home 18 100.0% Speak English very well
English speakers - Foreign-born 3.5% of residents of Sugarland Run speak English at home.
43.1% of residents speak Spanish at home 1,102 48.7% Speak English very well1,161 51.3% Speak English less than very well52.8% of residents speak other language at home 1,453 52.4% Speak English very well1,320 47.6% Speak English less than very well
White (Caucasian) - Speak only English Native:
86.4% (3,784)Foreign-born:
4.1% (45)
White (Caucasian) - Speak another language Native:
13.6% (596)Foreign-born:
98.5% (1,069)
Black or African American - Speak only English Native:
85.1% (514)Foreign-born:
3.1% (9)
Black or African American - Speak another language Native:
17.6% (107)Foreign-born:
100.0% (305)
Asian - Speak only English Native:
39.6% (154)Foreign-born:
4.6% (71)
Asian - Speak another language Native:
63.0% (245)Foreign-born:
95.3% (1,464)
Native Hawaiian / Pacific Islander - Speak another language Native:
100.0% (22)Foreign-born:
49.7% (9)
Other race - Speak only English Native:
21.0% (149)Foreign-born:
4.0% (40)
Other race - Speak another language Native:
79.5% (564)Foreign-born:
97.2% (981)
Two or more races - Speak only English Native:
37.3% (511)Foreign-born:
1.9% (27)
Two or more races - Speak another language Native:
71.9% (986)Foreign-born:
97.4% (1,385)
White alone - Speak only English Native:
88.8% (3,619)Foreign-born:
3.0% (21)
White alone - Speak another language Native:
13.0% (531)Foreign-born:
100.0% (706)
Hispanic or Latino - Speak only English Native:
29.5% (577)Foreign-born:
3.0% (72)
Hispanic or Latino - Speak another language Native:
69.9% (1,368)Foreign-born:
96.4% (2,272)
Foreign-born residents in Sugarland Run
Marital status for residents in Sugarland Run Marital status - White (Caucasian) population 15 years and over
Males 35.6% Never married56.9% Now married3.6% Separated1.0% Widowed3.0% DivorcedFemales 33.5% Never married48.4% Now married0.0% Separated6.5% Widowed11.5% DivorcedWomen who gave birth in the past 12 months Now married:
87.1% (81)Unmarried:
12.9% (12)
Women who did not give birth in the past 12 months Now married:
39.9% (541)Unmarried:
60.1% (817)
Marital status - Black or African American population 15 years and over
Males 29.2% Never married52.7% Now married4.0% Separated10.0% Widowed4.0% DivorcedFemales 33.6% Never married39.5% Now married2.4% Separated20.1% Widowed4.5% DivorcedWomen who did not give birth in the past 12 months Now married:
40.3% (95)Unmarried:
59.7% (140)
Marital status - Asian population 15 years and over
Males 27.0% Never married63.9% Now married0.0% Separated2.7% Widowed6.4% DivorcedFemales 17.6% Never married64.6% Now married0.8% Separated5.9% Widowed11.0% DivorcedWomen who gave birth in the past 12 months Now married:
100.0% (33)Unmarried:
0.0% (0)
Women who did not give birth in the past 12 months Now married:
53.6% (264)Unmarried:
46.4% (229)
Marital status - Native Hawaiian / Pacific Islander population 15 years and over
Males 0.0% Never married0.0% Now married0.0% Separated0.0% Widowed100.0% DivorcedFemales 0.0% Never married60.0% Now married40.0% Separated0.0% Widowed0.0% DivorcedWomen who did not give birth in the past 12 months Now married:
100.0% (6)Unmarried:
0.0% (0)
Marital status - Other race population 15 years and over
Males 43.9% Never married52.7% Now married0.0% Separated0.0% Widowed3.4% DivorcedFemales 14.6% Never married69.6% Now married0.0% Separated5.3% Widowed10.6% DivorcedWomen who gave birth in the past 12 months Now married:
100.0% (73)Unmarried:
0.0% (0)
Women who did not give birth in the past 12 months Now married:
75.0% (222)Unmarried:
25.0% (74)
Marital status - Two or more races population 15 years and over
Males 56.1% Never married43.9% Now married0.0% Separated0.0% Widowed0.0% DivorcedFemales 46.9% Never married47.9% Now married0.0% Separated3.8% Widowed1.4% DivorcedWomen who gave birth in the past 12 months Now married:
12.2% (11)Unmarried:
87.8% (83)
Women who did not give birth in the past 12 months Now married:
37.1% (276)Unmarried:
62.9% (467)
Marital status - White alone, not Hispanic / Latino population 15 years and over
Males 31.4% Never married60.0% Now married4.1% Separated1.2% Widowed3.3% DivorcedFemales 31.9% Never married51.6% Now married0.0% Separated5.7% Widowed10.9% DivorcedWomen who gave birth in the past 12 months Now married:
87.1% (85)Unmarried:
12.9% (13)
Women who did not give birth in the past 12 months Now married:
44.0% (497)Unmarried:
56.0% (632)
Marital status - Hispanic or Latino population 15 years and over
Males 51.1% Never married47.1% Now married0.3% Separated0.0% Widowed1.4% DivorcedFemales 40.4% Never married47.5% Now married0.0% Separated5.2% Widowed6.9% DivorcedWomen who gave birth in the past 12 months Now married:
47.6% (60)Unmarried:
52.4% (67)
Women who did not give birth in the past 12 months Now married:
39.9% (427)Unmarried:
60.1% (644)
Ancestries in Sugarland Run
329 4.3% Italian301 3.9% Somali300 3.9% English298 3.9% Syrian234 3.0% German179 2.3% American166 2.2% Irish146 1.9% European137 1.8% Afghan69 0.9% Iranian61 0.8% Polish52 0.7% Hungarian50 0.6% Scotch-Irish47 0.6% French39 0.5% Arab35 0.5% Ghanaian35 0.5% African30 0.4% British23 0.3% Scottish21 0.3% Swedish17 0.2% Estonian14 0.2% Slavic13 0.2% Dutch12 0.2% Czech12 0.2% Ukrainian10 0.1% Greek10 0.1% Yugoslavian8 0.1% Northern European8 0.1% Welsh7 0.09% Portuguese6 0.08% Norwegian
Geographical mobility in Sugarland Run Same house 1 year ago 5,007 89.4% White (Caucasian)885 83.0% Black or African American19 96.1% American Indian / Alaska Native1,759 87.2% Asian35 95.3% Native Hawaiian / Pacific Islander1,830 95.8% Other race2,567 91.2% Two or more races4,221 87.3% White alone, not Hispanic / Latino4,533 100.0% Hispanic or LatinoMoved within same county 83 1.5% White / Caucasian107 10.1% Black or African American10 0.5% Asian19 1.0% Other race37 1.3% Two or more races75 1.5% White alone, not Hispanic / Latino24 0.5% Hispanic or LatinoMoved within same state 305 5.4% White / Caucasian68 6.3% Black or African American170 8.4% Asian138 7.2% Other race284 10.1% Two or more races315 6.5% White alone, not Hispanic / Latino191 4.2% Hispanic or LatinoMoved from different state 33 0.6% White / Caucasian34 0.7% White alone, not Hispanic / LatinoMoved from abroad 109 1.9% White93 4.6% Asian28 1.0% Two or more races116 2.4% White alone, not Hispanic / Latino34 0.8% Hispanic or Latino
Children Nativity (place of birth) in Sugarland Run
Children under 6 years - Living with two parents Both parents native 104 100.0% NativeBoth parents foreign-born 535 100.0% NativeOne native, one foreign-born parent 52 100.0% NativeChildren under 6 years - Living with one parent Foreign-born parent 152 100.0% NativeChildren 6 to 17 years - Living with two parents Both parents native 547 100.0% NativeBoth parents foreign-born 800 77.5% Native233 22.5% Foreign-bornOne native, one foreign-born parent 62 100.0% NativeChildren 6 to 17 years - Living with one parent Native parent 140 100.0% Foreign-bornForeign-born parent 287 89.0% Native36 11.0% Foreign-born
Grandparents responsible for own grandchildren in Sugarland Run
Grandparents (30 to 59 years) White / Caucasian 29 100.0% Not responsible for grandchildrenOther race 37 54.4% Responsible for grandchildren31 45.6% Not responsible for grandchildrenHispanic or Latino 31 38.5% Responsible for grandchildren50 61.5% Not responsible for grandchildren
Grandparents (60 years and over) White / Caucasian 107 100.0% Not responsible for grandchildrenOther race 72 100.0% Not responsible for grandchildrenHispanic or Latino 143 100.0% Not responsible for grandchildren