Races in Streetsboro, Ohio (OH) Detailed Stats
Data:
Races - White alone (%)
Races - White alone (% change since 2000)
Races - Black alone (%)
Races - Black alone (% change since 2000)
Races - American Indian alone (%)
Races - American Indian alone (% change since 2000)
Races - Asian alone (%)
Races - Asian alone (% change since 2000)
Races - Hispanic (%)
Races - Hispanic (% change since 2000)
Races - Native Hawaiian and Other Pacific Islander alone (%)
Races - Native Hawaiian and Other Pacific Islander alone (% change since 2000)
Races - Two or more races(%)
Races - Two or more races(% change since 2000)
Races - Other race alone (%)
Races - Other race alone (% change since 2000)
Racial diversity
Place of birth - Born in state of residence (%)
Place of birth - Born in state of residence (%) - White
Place of birth - Born in state of residence (%) - Black or African American
Place of birth - Born in state of residence (%) - Asian
Place of birth - Born in state of residence (%) - Hispanic or Latino
Place of birth - Born in state of residence (%) - American Indian and Alaska Native
Place of birth - Born in state of residence (%) - Multirace
Place of birth - Born in state of residence (%) - Other Race
Place of birth - Born in other state (%)
Place of birth - Born in other state (%) - White
Place of birth - Born in other state (%) - Black or African American
Place of birth - Born in other state (%) - Asian
Place of birth - Born in other state (%) - Hispanic or Latino
Place of birth - Born in other state (%) - American Indian and Alaska Native
Place of birth - Born in other state (%) - Multirace
Place of birth - Born in other state (%) - Other Race
Place of birth - Native, outside of US (%)
Place of birth - Native, outside of US (%) - White
Place of birth - Native, outside of US (%) - Black or African American
Place of birth - Native, outside of US (%) - Asian
Place of birth - Native, outside of US (%) - Hispanic or Latino
Place of birth - Native, outside of US (%) - American Indian and Alaska Native
Place of birth - Native, outside of US (%) - Multirace
Place of birth - Native, outside of US (%) - Other Race
Place of birth - Foreign born (%)
Place of birth - Foreign born (%) - White
Place of birth - Foreign born (%) - Black or African American
Place of birth - Foreign born (%) - Asian
Place of birth - Foreign born (%) - Hispanic or Latino
Place of birth - Foreign born (%) - American Indian and Alaska Native
Place of birth - Foreign born (%) - Multirace
Place of birth - Foreign born (%) - Other Race
Residents speaking English at home (%)
Residents speaking English at home - Born in the United States (%)
Residents speaking English at home - Native, born elsewhere (%)
Residents speaking English at home - Foreign born (%)
Residents speaking Spanish at home (%)
Residents speaking Spanish at home - Born in the United States (%)
Residents speaking Spanish at home - Native, born elsewhere (%)
Residents speaking Spanish at home - Foreign born (%)
Residents speaking other language at home (%)
Residents speaking other language at home - Born in the United States (%)
Residents speaking other language at home - Native, born elsewhere (%)
Residents speaking other language at home - Foreign born (%)
Marital status - Never married (%)
Marital status - Now married (%)
Marital status - Separated (%)
Marital status - Widowed (%)
Marital status - Divorced (%)
Ancestries Reported - Arab (%)
Ancestries Reported - Czech (%)
Ancestries Reported - Danish (%)
Ancestries Reported - Dutch (%)
Ancestries Reported - English (%)
Ancestries Reported - French (%)
Ancestries Reported - French Canadian (%)
Ancestries Reported - German (%)
Ancestries Reported - Greek (%)
Ancestries Reported - Hungarian (%)
Ancestries Reported - Irish (%)
Ancestries Reported - Italian (%)
Ancestries Reported - Lithuanian (%)
Ancestries Reported - Norwegian (%)
Ancestries Reported - Polish (%)
Ancestries Reported - Portuguese (%)
Ancestries Reported - Russian (%)
Ancestries Reported - Scotch-Irish (%)
Ancestries Reported - Scottish (%)
Ancestries Reported - Slovak (%)
Ancestries Reported - Subsaharan African (%)
Ancestries Reported - Swedish (%)
Ancestries Reported - Swiss (%)
Ancestries Reported - Ukrainian (%)
Ancestries Reported - United States (%)
Ancestries Reported - Welsh (%)
Ancestries Reported - West Indian (%)
Ancestries Reported - Other (%)
Geographical mobility - Same house 1 year ago (%)
Geographical mobility - Same house 1 year ago (%) - White
Geographical mobility - Same house 1 year ago (%) - Black or African American
Geographical mobility - Same house 1 year ago (%) - Asian
Geographical mobility - Same house 1 year ago (%) - Hispanic or Latino
Geographical mobility - Same house 1 year ago (%) - American Indian and Alaska Native
Geographical mobility - Same house 1 year ago (%) - Multirace
Geographical mobility - Same house 1 year ago (%) - Other Race
Geographical mobility - Moved within same county (%)
Geographical mobility - Moved within same county (%) - White
Geographical mobility - Moved within same county (%) - Black or African American
Geographical mobility - Moved within same county (%) - Asian
Geographical mobility - Moved within same county (%) - Hispanic or Latino
Geographical mobility - Moved within same county (%) - American Indian and Alaska Native
Geographical mobility - Moved within same county (%) - Multirace
Geographical mobility - Moved within same county (%) - Other Race
Geographical mobility - Moved from different county within same state (%)
Geographical mobility - Moved from different county within same state (%) - White
Geographical mobility - Moved from different county within same state (%) - Black or African American
Geographical mobility - Moved from different county within same state (%) - Asian
Geographical mobility - Moved from different county within same state (%) - Hispanic or Latino
Geographical mobility - Moved from different county within same state (%) - American Indian and Alaska Native
Geographical mobility - Moved from different county within same state (%) - Multirace
Geographical mobility - Moved from different county within same state (%) - Other Race
Geographical mobility - Moved from different state (%)
Geographical mobility - Moved from different state (%) - White
Geographical mobility - Moved from different state (%) - Black or African American
Geographical mobility - Moved from different state (%) - Asian
Geographical mobility - Moved from different state (%) - Hispanic or Latino
Geographical mobility - Moved from different state (%) - American Indian and Alaska Native
Geographical mobility - Moved from different state (%) - Multirace
Geographical mobility - Moved from different state (%) - Other Race
Geographical mobility - Moved from abroad (%)
Geographical mobility - Moved from abroad (%) - White
Geographical mobility - Moved from abroad (%) - Black or African American
Geographical mobility - Moved from abroad (%) - Asian
Geographical mobility - Moved from abroad (%) - Hispanic or Latino
Geographical mobility - Moved from abroad (%) - American Indian and Alaska Native
Geographical mobility - Moved from abroad (%) - Multirace
Geographical mobility - Moved from abroad (%) - Other Race
Place of birth for the foreign-born population - Ireland (%)
Place of birth for the foreign-born population - Denmark (%)
Place of birth for the foreign-born population - Norway (%)
Place of birth for the foreign-born population - Sweden (%)
Place of birth for the foreign-born population - United Kingdom (%)
Place of birth for the foreign-born population - England (%)
Place of birth for the foreign-born population - Scotland (%)
Place of birth for the foreign-born population - Other Northern Europe (%)
Place of birth for the foreign-born population - Austria (%)
Place of birth for the foreign-born population - Belgium (%)
Place of birth for the foreign-born population - France (%)
Place of birth for the foreign-born population - Germany (%)
Place of birth for the foreign-born population - Netherlands (%)
Place of birth for the foreign-born population - Switzerland (%)
Place of birth for the foreign-born population - Other Western Europe (%)
Place of birth for the foreign-born population - Greece (%)
Place of birth for the foreign-born population - Italy (%)
Place of birth for the foreign-born population - Portugal (%)
Place of birth for the foreign-born population - Spain (%)
Place of birth for the foreign-born population - Other Southern Europe (%)
Place of birth for the foreign-born population - Albania (%)
Place of birth for the foreign-born population - Belarus (%)
Place of birth for the foreign-born population - Bosnia and Herzegovina (%)
Place of birth for the foreign-born population - Bulgaria (%)
Place of birth for the foreign-born population - Croatia (%)
Place of birth for the foreign-born population - Czechoslovakia (%)
Place of birth for the foreign-born population - Hungary (%)
Place of birth for the foreign-born population - Latvia (%)
Place of birth for the foreign-born population - Lithuania (%)
Place of birth for the foreign-born population - North Macedonia (Macedonia) (%)
Place of birth for the foreign-born population - Moldova (%)
Place of birth for the foreign-born population - Poland (%)
Place of birth for the foreign-born population - Romania (%)
Place of birth for the foreign-born population - Russia (%)
Place of birth for the foreign-born population - Serbia (%)
Place of birth for the foreign-born population - Ukraine (%)
Place of birth for the foreign-born population - Other Eastern Europe (%)
Place of birth for the foreign-born population - China (%)
Place of birth for the foreign-born population - Hong Kong (%)
Place of birth for the foreign-born population - Taiwan (%)
Place of birth for the foreign-born population - Japan (%)
Place of birth for the foreign-born population - Korea (%)
Place of birth for the foreign-born population - Other Eastern Asia (%)
Place of birth for the foreign-born population - Afghanistan (%)
Place of birth for the foreign-born population - Bangladesh (%)
Place of birth for the foreign-born population - India (%)
Place of birth for the foreign-born population - Iran (%)
Place of birth for the foreign-born population - Kazakhstan (%)
Place of birth for the foreign-born population - Nepal (%)
Place of birth for the foreign-born population - Pakistan (%)
Place of birth for the foreign-born population - Sri Lanka (%)
Place of birth for the foreign-born population - Uzbekistan (%)
Place of birth for the foreign-born population - Other South Central Asia (%)
Place of birth for the foreign-born population - Burma (%)
Place of birth for the foreign-born population - Cambodia (%)
Place of birth for the foreign-born population - Indonesia (%)
Place of birth for the foreign-born population - Laos (%)
Place of birth for the foreign-born population - Malaysia (%)
Place of birth for the foreign-born population - Philippines (%)
Place of birth for the foreign-born population - Singapore (%)
Place of birth for the foreign-born population - Thailand (%)
Place of birth for the foreign-born population - Vietnam (%)
Place of birth for the foreign-born population - Other South Eastern Asia (%)
Place of birth for the foreign-born population - Armenia (%)
Place of birth for the foreign-born population - Iraq (%)
Place of birth for the foreign-born population - Israel (%)
Place of birth for the foreign-born population - Jordan (%)
Place of birth for the foreign-born population - Kuwait (%)
Place of birth for the foreign-born population - Lebanon (%)
Place of birth for the foreign-born population - Saudi Arabia (%)
Place of birth for the foreign-born population - Syria (%)
Place of birth for the foreign-born population - Turkey (%)
Place of birth for the foreign-born population - Yemen (%)
Place of birth for the foreign-born population - Other Western Asia (%)
Place of birth for the foreign-born population - Eritrea (%)
Place of birth for the foreign-born population - Ethiopia (%)
Place of birth for the foreign-born population - Kenya (%)
Place of birth for the foreign-born population - Somalia (%)
Place of birth for the foreign-born population - Uganda (%)
Place of birth for the foreign-born population - Zimbabwe (%)
Place of birth for the foreign-born population - Other Eastern Africa (%)
Place of birth for the foreign-born population - Cameroon (%)
Place of birth for the foreign-born population - Congo (%)
Place of birth for the foreign-born population - Democratic Republic of Congo (Zaire) (%)
Place of birth for the foreign-born population - Other Middle Africa (%)
Place of birth for the foreign-born population - Egypt (%)
Place of birth for the foreign-born population - Morocco (%)
Place of birth for the foreign-born population - Sudan (%)
Place of birth for the foreign-born population - Other Northern Africa (%)
Place of birth for the foreign-born population - South Africa (%)
Place of birth for the foreign-born population - Other Southern Africa (%)
Place of birth for the foreign-born population - Cabo Verde (%)
Place of birth for the foreign-born population - Ghana (%)
Place of birth for the foreign-born population - Liberia (%)
Place of birth for the foreign-born population - Nigeria (%)
Place of birth for the foreign-born population - Senegal (%)
Place of birth for the foreign-born population - Sierra Leone (%)
Place of birth for the foreign-born population - Other Western Africa (%)
Place of birth for the foreign-born population - Australia (%)
Place of birth for the foreign-born population - New Zealand (%)
Place of birth for the foreign-born population - Fiji (%)
Place of birth for the foreign-born population - Micronesia (%)
Place of birth for the foreign-born population - Bahamas (%)
Place of birth for the foreign-born population - Barbados (%)
Place of birth for the foreign-born population - Cuba (%)
Place of birth for the foreign-born population - Dominica (%)
Place of birth for the foreign-born population - Dominican Republic (%)
Place of birth for the foreign-born population - Grenada (%)
Place of birth for the foreign-born population - Haiti (%)
Place of birth for the foreign-born population - Jamaica (%)
Place of birth for the foreign-born population - St. Vincent and the Grenadines (%)
Place of birth for the foreign-born population - Trinidad and Tobago (%)
Place of birth for the foreign-born population - West Indies (%)
Place of birth for the foreign-born population - Other Caribbean (%)
Place of birth for the foreign-born population - Belize (%)
Place of birth for the foreign-born population - Costa Rica (%)
Place of birth for the foreign-born population - El Salvador (%)
Place of birth for the foreign-born population - Guatemala (%)
Place of birth for the foreign-born population - Honduras (%)
Place of birth for the foreign-born population - Mexico (%)
Place of birth for the foreign-born population - Nicaragua (%)
Place of birth for the foreign-born population - Panama (%)
Place of birth for the foreign-born population - Other Central America (%)
Place of birth for the foreign-born population - Argentina (%)
Place of birth for the foreign-born population - Bolivia (%)
Place of birth for the foreign-born population - Brazil (%)
Place of birth for the foreign-born population - Chile (%)
Place of birth for the foreign-born population - Colombia (%)
Place of birth for the foreign-born population - Ecuador (%)
Place of birth for the foreign-born population - Guyana (%)
Place of birth for the foreign-born population - Peru (%)
Place of birth for the foreign-born population - Uruguay (%)
Place of birth for the foreign-born population - Venezuela (%)
Place of birth for the foreign-born population - Other South America (%)
Place of birth for the foreign-born population - Canada (%)
Place of birth for the foreign-born population - Other Northern America (%)
Place of birth for the foreign-born population - Other (%)
Latest news about races in Streetsboro, OH collected exclusively by city-data.com from local newspapers, TV, and radio stations
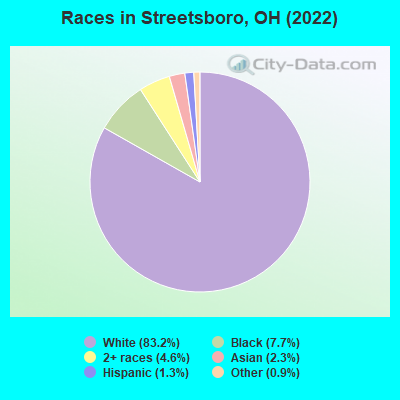
According to 2022 data, the most numerous races in Streetsboro, OH are White alone (14,435 residents), Black alone (1,329 residents), and Two or more races (803 residents). 96.6% of Streetsboro residents speak English at home. 2.6% of Streetsboro, OH residents are foreign-born (1.5% born in Asia, 0.6% born in Europe), which is 52.3% less than the foreign-born rate of 4.0% across the entire state of Ohio.
Race distribution in Streetsboro
2000 2022
9,538,111 84.0% White alone 1,290,662 11.4% Black alone 217,123 1.9% Hispanic 137,770 1.2% Two or more races 131,670 1.2% Asian alone 21,985 0.2% American Indian alone 13,483 0.1% Other race alone 2,336 0.02% Native Hawaiian and Other
8,948,793 76.1% White alone 1,401,403 11.9% Black alone 529,291 4.5% Two or more races 517,232 4.4% Hispanic 293,387 2.5% Asian alone 52,805 0.4% Other race alone 9,785 0.08% American Indian alone 3,362 0.03% Native Hawaiian and Other
Income and house value in Streetsboro Median household income in 2022 $91,276 White non-Hispanic householders$50,141 Black householders$54,581 Some other race householders$72,133 Two or more races householdersMedian 2022 house value $203,778 White Non-Hispanic householders$297,612 Black or African American householders $200,622 Asian householders$195,474 Two or more races householders$162,922 Hispanic or Latino householders
Median age by race in Streetsboro
41.3 Median age for White residents38.9 44.5 48.5 Median age for Black or African American residents71.2 45.2 -676,818,950.3 Median age for American Indian / Alaska Native residents-685,185,184.5 -666,666,666.0 69.0 Median age for Asian residents56.1 73.9 -800,387,596.1 Median age for Native Hawaiian / Pacific Islander residents-666,666,666.0 -805,394,989.6 59.7 Median age for Other race residents88.2 44.5 32.1 Median age for Two or more races residents41.4 21.2 41.6 Median age for White alone residents39.2 44.9 45.6 Median age for Hispanic or Latino residents45.4 31.5
Owner/renter occupied households by race in Streetsboro
House owners and renters - White residents 4,334 73.0% Owner occupied1,603 27.0% Renter occupiedHouse owners and renters - Black or African American residents 403 50.7% Owner occupied391 49.3% Renter occupiedHouse owners and renters - Asian residents 76 26.2% Owner occupied214 73.8% Renter occupiedHouse owners and renters - Other race residents 25 29.2% Owner occupied61 70.8% Renter occupiedHouse owners and renters - Two or more races residents 272 99.0% Owner occupied3 1.0% Renter occupiedHouse owners and renters - White alone residents 4,321 73.1% Owner occupied1,593 26.9% Renter occupiedHouse owners and renters - Hispanic or Latino residents 31 100.0% Owner occupied
Language usage in Streetsboro
English speakers - Total 96.6% of residents of Streetsboro speak English at home.
0.9% of residents speak Spanish at home 113 79.0% Speak English very well30 21.0% Speak English less than very well2.4% of residents speak other language at home 251 65.0% Speak English very well135 35.0% Speak English less than very well
English speakers - Born in the United States 99.3% of residents of Streetsboro speak English at home.
0.5% of residents speak other language at home 16 100.0% Speak English less than very well
English speakers - Native, born elsewhere 49.3% of residents of Streetsboro speak English at home.
22.9% of residents speak Spanish at home 15 45.5% Speak English very well18 54.5% Speak English less than very well26.4% of residents speak other language at home 38 100.0% Speak English very well
English speakers - Foreign-born 43.9% of residents of Streetsboro speak English at home.
54.8% of residents speak other language at home 153 61.0% Speak English very well98 39.0% Speak English less than very well
White (Caucasian) - Speak only English Native:
99.1% (13,585)Foreign-born:
69.5% (114)
White (Caucasian) - Speak another language Native:
0.9% (117)Foreign-born:
8.5% (14)
Black or African American - Speak only English Native:
98.2% (1,176)Foreign-born:
100.0% (21)
Asian - Speak only English Native:
82.4% (164)Foreign-born:
7.0% (14)
Asian - Speak another language Native:
19.3% (39)Foreign-born:
93.7% (194)
Two or more races - Speak only English Native:
99.0% (645)Foreign-born:
39.9% (58)
White alone - Speak only English Native:
99.8% (13,566)Foreign-born:
67.2% (114)
White alone - Speak another language Native:
0.4% (61)Foreign-born:
8.7% (15)
Foreign-born residents in Streetsboro 458 residents are foreign born (1.5% Asia , 0.6% Europe ).
Marital status for residents in Streetsboro Marital status - White (Caucasian) population 15 years and over
Males 34.3% Never married50.1% Now married1.5% Separated3.9% Widowed10.3% DivorcedFemales 27.7% Never married44.7% Now married0.8% Separated8.6% Widowed18.1% DivorcedWomen who gave birth in the past 12 months Now married:
48.0% (83)Unmarried:
52.0% (89)
Women who did not give birth in the past 12 months Now married:
41.1% (1,314)Unmarried:
58.9% (1,881)
Marital status - Black or African American population 15 years and over
Males 27.7% Never married60.6% Now married0.0% Separated0.0% Widowed11.6% DivorcedFemales 41.1% Never married36.1% Now married5.5% Separated8.9% Widowed8.4% DivorcedWomen who gave birth in the past 12 months Now married:
0.0% (0)Unmarried:
100.0% (23)
Women who did not give birth in the past 12 months Now married:
43.9% (193)Unmarried:
56.1% (247)
Marital status - Asian population 15 years and over
Males 0.0% Never married74.0% Now married0.0% Separated0.0% Widowed26.0% DivorcedFemales 0.0% Never married39.9% Now married0.0% Separated48.1% Widowed12.0% DivorcedWomen who did not give birth in the past 12 months Now married:
41.5% (27)Unmarried:
58.5% (38)
Marital status - Other race population 15 years and over
Males 34.5% Never married65.5% Now married0.0% Separated0.0% Widowed0.0% DivorcedFemales 89.0% Never married11.0% Now married0.0% Separated0.0% Widowed0.0% DivorcedWomen who did not give birth in the past 12 months Now married:
11.0% (11)Unmarried:
89.0% (86)
Marital status - Two or more races population 15 years and over
Males 34.8% Never married38.2% Now married0.0% Separated0.0% Widowed27.0% DivorcedFemales 23.9% Never married76.1% Now married0.0% Separated0.0% Widowed0.0% DivorcedWomen who did not give birth in the past 12 months Now married:
66.2% (115)Unmarried:
33.8% (59)
Marital status - White alone, not Hispanic / Latino population 15 years and over
Males 34.5% Never married49.8% Now married1.5% Separated3.9% Widowed10.3% DivorcedFemales 27.6% Never married44.8% Now married0.8% Separated8.7% Widowed18.2% DivorcedWomen who gave birth in the past 12 months Now married:
48.0% (82)Unmarried:
52.0% (89)
Women who did not give birth in the past 12 months Now married:
41.1% (1,293)Unmarried:
58.9% (1,854)
Marital status - Hispanic or Latino population 15 years and over
Males 0.0% Never married100.0% Now married0.0% Separated0.0% Widowed0.0% DivorcedFemales 16.4% Never married83.6% Now married0.0% Separated0.0% Widowed0.0% DivorcedWomen who did not give birth in the past 12 months Now married:
77.7% (85)Unmarried:
22.3% (24)
Ancestries in Streetsboro
1,311 18.9% German954 13.7% American737 10.6% English650 9.4% Italian273 3.9% Irish236 3.4% Polish203 2.9% Hungarian129 1.9% European98 1.4% Scottish93 1.3% Russian56 0.8% Slovak50 0.7% Arab48 0.7% Croatian41 0.6% Slovene31 0.4% Jamaican25 0.4% French18 0.3% Eastern European17 0.2% British17 0.2% Scotch-Irish16 0.2% Czech16 0.2% Pennsylvania German15 0.2% Austrian15 0.2% Latvian13 0.2% Armenian13 0.2% Dutch13 0.2% Scandinavian13 0.2% Swiss12 0.2% Romanian12 0.2% South African10 0.1% French Canadian7 0.1% Swedish
Geographical mobility in Streetsboro Same house 1 year ago 12,431 85.6% White (Caucasian)1,220 90.9% Black or African American413 100.0% Asian120 87.1% Other race905 97.2% Two or more races12,282 85.4% White alone, not Hispanic / Latino191 87.8% Hispanic or LatinoMoved within same county 1,026 7.1% White / Caucasian39 2.9% Black or African American14 10.3% Other race41 4.4% Two or more races1,051 7.3% White alone, not Hispanic / Latino23 10.7% Hispanic or LatinoMoved within same state 749 5.2% White / Caucasian100 7.5% Black or African American756 5.3% White alone, not Hispanic / LatinoMoved from different state 178 1.2% White / Caucasian170 1.2% White alone, not Hispanic / LatinoMoved from abroad 33 0.2% White33 0.2% White alone, not Hispanic / Latino
Children Nativity (place of birth) in Streetsboro
Children under 6 years - Living with two parents Both parents native 538 100.0% NativeBoth parents foreign-born 7 100.0% NativeChildren under 6 years - Living with one parent Native parent 368 100.0% Native
Children 6 to 17 years - Living with two parents Both parents native 1,134 100.0% NativeBoth parents foreign-born 52 100.0% Foreign-bornOne native, one foreign-born parent 97 100.0% NativeChildren 6 to 17 years - Living with one parent Native parent 604 100.0% Native
Grandparents responsible for own grandchildren in Streetsboro
Grandparents (30 to 59 years) White / Caucasian 7 6.3% Responsible for grandchildren104 93.7% Not responsible for grandchildrenWhite alone, not Hispanic / Latino 7 6.2% Responsible for grandchildren106 93.8% Not responsible for grandchildrenGrandparents (60 years and over) White / Caucasian 31 11.7% Responsible for grandchildren232 88.3% Not responsible for grandchildrenWhite alone, not Hispanic / Latino 31 11.6% Responsible for grandchildren233 88.4% Not responsible for grandchildren