Races in Stony Brook, New York (NY) Detailed Stats
Data:
Races - White alone (%)
Races - White alone (% change since 2000)
Races - Black alone (%)
Races - Black alone (% change since 2000)
Races - American Indian alone (%)
Races - American Indian alone (% change since 2000)
Races - Asian alone (%)
Races - Asian alone (% change since 2000)
Races - Hispanic (%)
Races - Hispanic (% change since 2000)
Races - Native Hawaiian and Other Pacific Islander alone (%)
Races - Native Hawaiian and Other Pacific Islander alone (% change since 2000)
Races - Two or more races(%)
Races - Two or more races(% change since 2000)
Races - Other race alone (%)
Races - Other race alone (% change since 2000)
Racial diversity
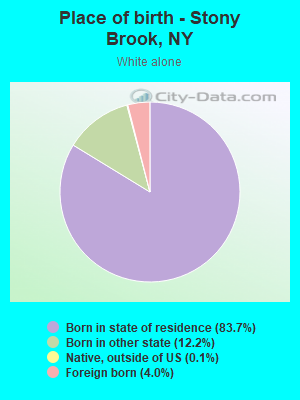
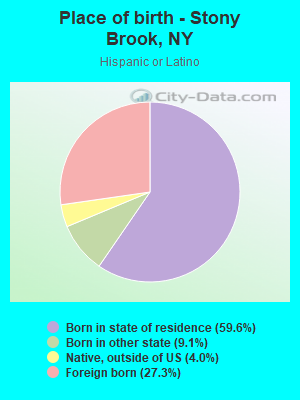
Place of birth - Born in state of residence (%)
Place of birth - Born in state of residence (%) - White
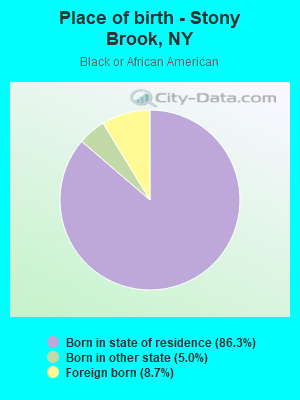
Place of birth - Born in state of residence (%) - Black or African American
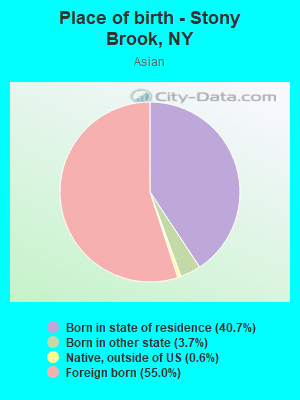
Place of birth - Born in state of residence (%) - Asian
Place of birth - Born in state of residence (%) - Hispanic or Latino
Place of birth - Born in state of residence (%) - American Indian and Alaska Native
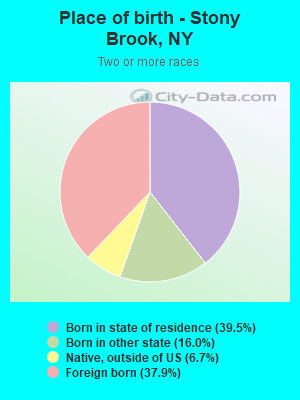
Place of birth - Born in state of residence (%) - Multirace
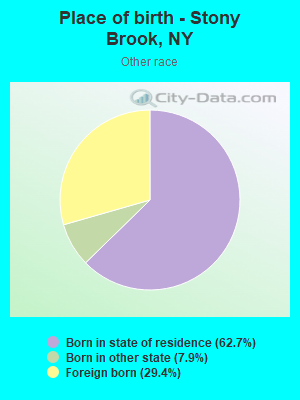
Place of birth - Born in state of residence (%) - Other Race
Place of birth - Born in other state (%)
Place of birth - Born in other state (%) - White
Place of birth - Born in other state (%) - Black or African American
Place of birth - Born in other state (%) - Asian
Place of birth - Born in other state (%) - Hispanic or Latino
Place of birth - Born in other state (%) - American Indian and Alaska Native
Place of birth - Born in other state (%) - Multirace
Place of birth - Born in other state (%) - Other Race
Place of birth - Native, outside of US (%)
Place of birth - Native, outside of US (%) - White
Place of birth - Native, outside of US (%) - Black or African American
Place of birth - Native, outside of US (%) - Asian
Place of birth - Native, outside of US (%) - Hispanic or Latino
Place of birth - Native, outside of US (%) - American Indian and Alaska Native
Place of birth - Native, outside of US (%) - Multirace
Place of birth - Native, outside of US (%) - Other Race
Place of birth - Foreign born (%)
Place of birth - Foreign born (%) - White
Place of birth - Foreign born (%) - Black or African American
Place of birth - Foreign born (%) - Asian
Place of birth - Foreign born (%) - Hispanic or Latino
Place of birth - Foreign born (%) - American Indian and Alaska Native
Place of birth - Foreign born (%) - Multirace
Place of birth - Foreign born (%) - Other Race
Residents speaking English at home (%)
Residents speaking English at home - Born in the United States (%)
Residents speaking English at home - Native, born elsewhere (%)
Residents speaking English at home - Foreign born (%)
Residents speaking Spanish at home (%)
Residents speaking Spanish at home - Born in the United States (%)
Residents speaking Spanish at home - Native, born elsewhere (%)
Residents speaking Spanish at home - Foreign born (%)
Residents speaking other language at home (%)
Residents speaking other language at home - Born in the United States (%)
Residents speaking other language at home - Native, born elsewhere (%)
Residents speaking other language at home - Foreign born (%)
Marital status - Never married (%)
Marital status - Now married (%)
Marital status - Separated (%)
Marital status - Widowed (%)
Marital status - Divorced (%)
Ancestries Reported - Arab (%)
Ancestries Reported - Czech (%)
Ancestries Reported - Danish (%)
Ancestries Reported - Dutch (%)
Ancestries Reported - English (%)
Ancestries Reported - French (%)
Ancestries Reported - French Canadian (%)
Ancestries Reported - German (%)
Ancestries Reported - Greek (%)
Ancestries Reported - Hungarian (%)
Ancestries Reported - Irish (%)
Ancestries Reported - Italian (%)
Ancestries Reported - Lithuanian (%)
Ancestries Reported - Norwegian (%)
Ancestries Reported - Polish (%)
Ancestries Reported - Portuguese (%)
Ancestries Reported - Russian (%)
Ancestries Reported - Scotch-Irish (%)
Ancestries Reported - Scottish (%)
Ancestries Reported - Slovak (%)
Ancestries Reported - Subsaharan African (%)
Ancestries Reported - Swedish (%)
Ancestries Reported - Swiss (%)
Ancestries Reported - Ukrainian (%)
Ancestries Reported - United States (%)
Ancestries Reported - Welsh (%)
Ancestries Reported - West Indian (%)
Ancestries Reported - Other (%)
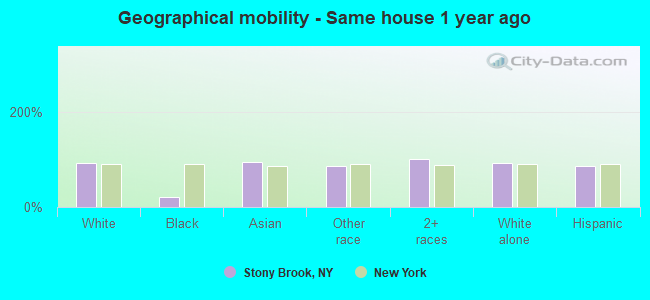
Geographical mobility - Same house 1 year ago (%)
Geographical mobility - Same house 1 year ago (%) - White
Geographical mobility - Same house 1 year ago (%) - Black or African American
Geographical mobility - Same house 1 year ago (%) - Asian
Geographical mobility - Same house 1 year ago (%) - Hispanic or Latino
Geographical mobility - Same house 1 year ago (%) - American Indian and Alaska Native
Geographical mobility - Same house 1 year ago (%) - Multirace
Geographical mobility - Same house 1 year ago (%) - Other Race
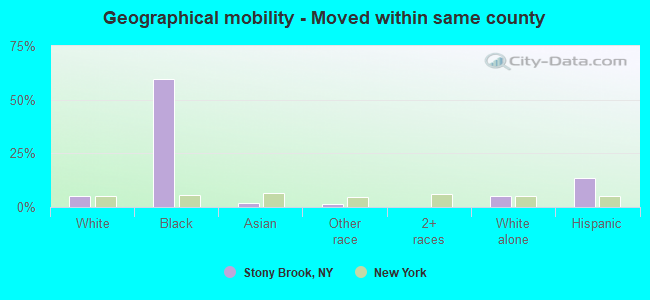
Geographical mobility - Moved within same county (%)
Geographical mobility - Moved within same county (%) - White
Geographical mobility - Moved within same county (%) - Black or African American
Geographical mobility - Moved within same county (%) - Asian
Geographical mobility - Moved within same county (%) - Hispanic or Latino
Geographical mobility - Moved within same county (%) - American Indian and Alaska Native
Geographical mobility - Moved within same county (%) - Multirace
Geographical mobility - Moved within same county (%) - Other Race
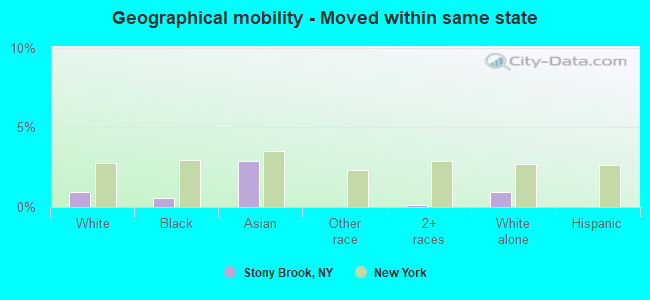
Geographical mobility - Moved from different county within same state (%)
Geographical mobility - Moved from different county within same state (%) - White
Geographical mobility - Moved from different county within same state (%) - Black or African American
Geographical mobility - Moved from different county within same state (%) - Asian
Geographical mobility - Moved from different county within same state (%) - Hispanic or Latino
Geographical mobility - Moved from different county within same state (%) - American Indian and Alaska Native
Geographical mobility - Moved from different county within same state (%) - Multirace
Geographical mobility - Moved from different county within same state (%) - Other Race
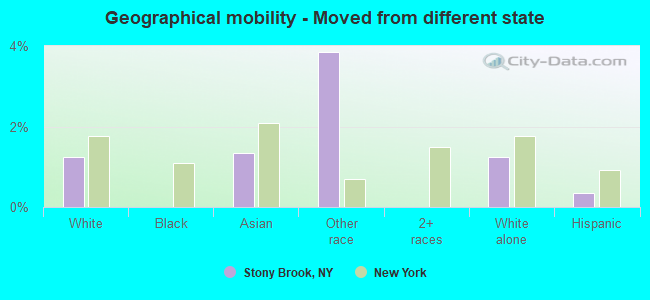
Geographical mobility - Moved from different state (%)
Geographical mobility - Moved from different state (%) - White
Geographical mobility - Moved from different state (%) - Black or African American
Geographical mobility - Moved from different state (%) - Asian
Geographical mobility - Moved from different state (%) - Hispanic or Latino
Geographical mobility - Moved from different state (%) - American Indian and Alaska Native
Geographical mobility - Moved from different state (%) - Multirace
Geographical mobility - Moved from different state (%) - Other Race
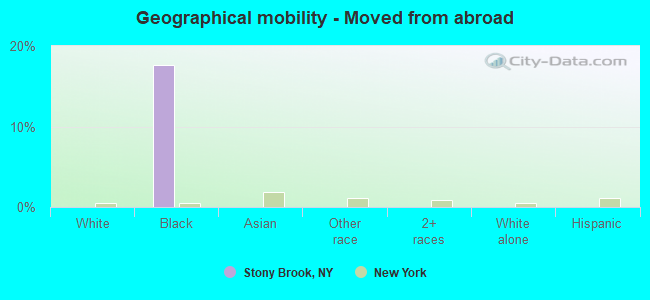
Geographical mobility - Moved from abroad (%)
Geographical mobility - Moved from abroad (%) - White
Geographical mobility - Moved from abroad (%) - Black or African American
Geographical mobility - Moved from abroad (%) - Asian
Geographical mobility - Moved from abroad (%) - Hispanic or Latino
Geographical mobility - Moved from abroad (%) - American Indian and Alaska Native
Geographical mobility - Moved from abroad (%) - Multirace
Geographical mobility - Moved from abroad (%) - Other Race
Place of birth for the foreign-born population - Ireland (%)
Place of birth for the foreign-born population - Denmark (%)
Place of birth for the foreign-born population - Norway (%)
Place of birth for the foreign-born population - Sweden (%)
Place of birth for the foreign-born population - United Kingdom (%)
Place of birth for the foreign-born population - England (%)
Place of birth for the foreign-born population - Scotland (%)
Place of birth for the foreign-born population - Other Northern Europe (%)
Place of birth for the foreign-born population - Austria (%)
Place of birth for the foreign-born population - Belgium (%)
Place of birth for the foreign-born population - France (%)
Place of birth for the foreign-born population - Germany (%)
Place of birth for the foreign-born population - Netherlands (%)
Place of birth for the foreign-born population - Switzerland (%)
Place of birth for the foreign-born population - Other Western Europe (%)
Place of birth for the foreign-born population - Greece (%)
Place of birth for the foreign-born population - Italy (%)
Place of birth for the foreign-born population - Portugal (%)
Place of birth for the foreign-born population - Spain (%)
Place of birth for the foreign-born population - Other Southern Europe (%)
Place of birth for the foreign-born population - Albania (%)
Place of birth for the foreign-born population - Belarus (%)
Place of birth for the foreign-born population - Bosnia and Herzegovina (%)
Place of birth for the foreign-born population - Bulgaria (%)
Place of birth for the foreign-born population - Croatia (%)
Place of birth for the foreign-born population - Czechoslovakia (%)
Place of birth for the foreign-born population - Hungary (%)
Place of birth for the foreign-born population - Latvia (%)
Place of birth for the foreign-born population - Lithuania (%)
Place of birth for the foreign-born population - North Macedonia (Macedonia) (%)
Place of birth for the foreign-born population - Moldova (%)
Place of birth for the foreign-born population - Poland (%)
Place of birth for the foreign-born population - Romania (%)
Place of birth for the foreign-born population - Russia (%)
Place of birth for the foreign-born population - Serbia (%)
Place of birth for the foreign-born population - Ukraine (%)
Place of birth for the foreign-born population - Other Eastern Europe (%)
Place of birth for the foreign-born population - China (%)
Place of birth for the foreign-born population - Hong Kong (%)
Place of birth for the foreign-born population - Taiwan (%)
Place of birth for the foreign-born population - Japan (%)
Place of birth for the foreign-born population - Korea (%)
Place of birth for the foreign-born population - Other Eastern Asia (%)
Place of birth for the foreign-born population - Afghanistan (%)
Place of birth for the foreign-born population - Bangladesh (%)
Place of birth for the foreign-born population - India (%)
Place of birth for the foreign-born population - Iran (%)
Place of birth for the foreign-born population - Kazakhstan (%)
Place of birth for the foreign-born population - Nepal (%)
Place of birth for the foreign-born population - Pakistan (%)
Place of birth for the foreign-born population - Sri Lanka (%)
Place of birth for the foreign-born population - Uzbekistan (%)
Place of birth for the foreign-born population - Other South Central Asia (%)
Place of birth for the foreign-born population - Burma (%)
Place of birth for the foreign-born population - Cambodia (%)
Place of birth for the foreign-born population - Indonesia (%)
Place of birth for the foreign-born population - Laos (%)
Place of birth for the foreign-born population - Malaysia (%)
Place of birth for the foreign-born population - Philippines (%)
Place of birth for the foreign-born population - Singapore (%)
Place of birth for the foreign-born population - Thailand (%)
Place of birth for the foreign-born population - Vietnam (%)
Place of birth for the foreign-born population - Other South Eastern Asia (%)
Place of birth for the foreign-born population - Armenia (%)
Place of birth for the foreign-born population - Iraq (%)
Place of birth for the foreign-born population - Israel (%)
Place of birth for the foreign-born population - Jordan (%)
Place of birth for the foreign-born population - Kuwait (%)
Place of birth for the foreign-born population - Lebanon (%)
Place of birth for the foreign-born population - Saudi Arabia (%)
Place of birth for the foreign-born population - Syria (%)
Place of birth for the foreign-born population - Turkey (%)
Place of birth for the foreign-born population - Yemen (%)
Place of birth for the foreign-born population - Other Western Asia (%)
Place of birth for the foreign-born population - Eritrea (%)
Place of birth for the foreign-born population - Ethiopia (%)
Place of birth for the foreign-born population - Kenya (%)
Place of birth for the foreign-born population - Somalia (%)
Place of birth for the foreign-born population - Uganda (%)
Place of birth for the foreign-born population - Zimbabwe (%)
Place of birth for the foreign-born population - Other Eastern Africa (%)
Place of birth for the foreign-born population - Cameroon (%)
Place of birth for the foreign-born population - Congo (%)
Place of birth for the foreign-born population - Democratic Republic of Congo (Zaire) (%)
Place of birth for the foreign-born population - Other Middle Africa (%)
Place of birth for the foreign-born population - Egypt (%)
Place of birth for the foreign-born population - Morocco (%)
Place of birth for the foreign-born population - Sudan (%)
Place of birth for the foreign-born population - Other Northern Africa (%)
Place of birth for the foreign-born population - South Africa (%)
Place of birth for the foreign-born population - Other Southern Africa (%)
Place of birth for the foreign-born population - Cabo Verde (%)
Place of birth for the foreign-born population - Ghana (%)
Place of birth for the foreign-born population - Liberia (%)
Place of birth for the foreign-born population - Nigeria (%)
Place of birth for the foreign-born population - Senegal (%)
Place of birth for the foreign-born population - Sierra Leone (%)
Place of birth for the foreign-born population - Other Western Africa (%)
Place of birth for the foreign-born population - Australia (%)
Place of birth for the foreign-born population - New Zealand (%)
Place of birth for the foreign-born population - Fiji (%)
Place of birth for the foreign-born population - Micronesia (%)
Place of birth for the foreign-born population - Bahamas (%)
Place of birth for the foreign-born population - Barbados (%)
Place of birth for the foreign-born population - Cuba (%)
Place of birth for the foreign-born population - Dominica (%)
Place of birth for the foreign-born population - Dominican Republic (%)
Place of birth for the foreign-born population - Grenada (%)
Place of birth for the foreign-born population - Haiti (%)
Place of birth for the foreign-born population - Jamaica (%)
Place of birth for the foreign-born population - St. Vincent and the Grenadines (%)
Place of birth for the foreign-born population - Trinidad and Tobago (%)
Place of birth for the foreign-born population - West Indies (%)
Place of birth for the foreign-born population - Other Caribbean (%)
Place of birth for the foreign-born population - Belize (%)
Place of birth for the foreign-born population - Costa Rica (%)
Place of birth for the foreign-born population - El Salvador (%)
Place of birth for the foreign-born population - Guatemala (%)
Place of birth for the foreign-born population - Honduras (%)
Place of birth for the foreign-born population - Mexico (%)
Place of birth for the foreign-born population - Nicaragua (%)
Place of birth for the foreign-born population - Panama (%)
Place of birth for the foreign-born population - Other Central America (%)
Place of birth for the foreign-born population - Argentina (%)
Place of birth for the foreign-born population - Bolivia (%)
Place of birth for the foreign-born population - Brazil (%)
Place of birth for the foreign-born population - Chile (%)
Place of birth for the foreign-born population - Colombia (%)
Place of birth for the foreign-born population - Ecuador (%)
Place of birth for the foreign-born population - Guyana (%)
Place of birth for the foreign-born population - Peru (%)
Place of birth for the foreign-born population - Uruguay (%)
Place of birth for the foreign-born population - Venezuela (%)
Place of birth for the foreign-born population - Other South America (%)
Place of birth for the foreign-born population - Canada (%)
Place of birth for the foreign-born population - Other Northern America (%)
Place of birth for the foreign-born population - Other (%)
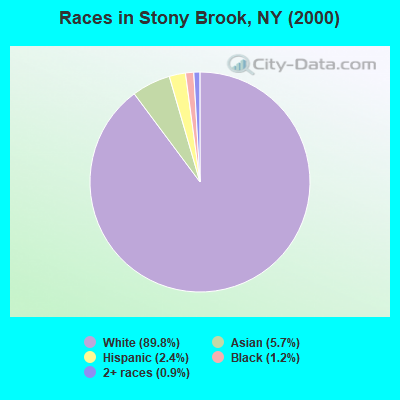
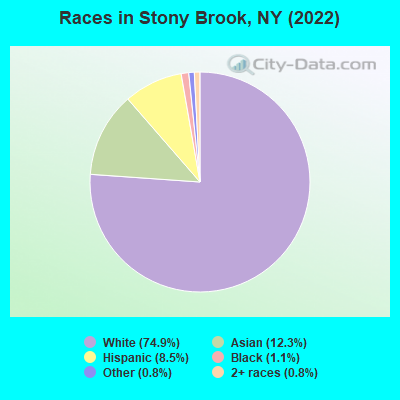
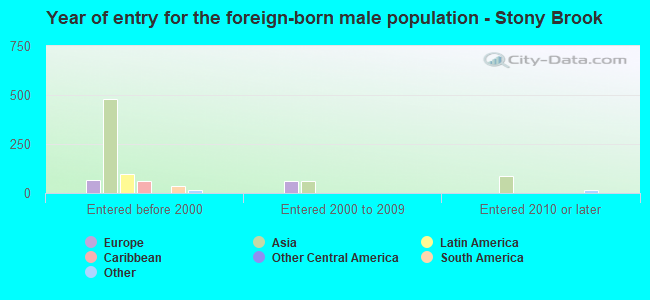
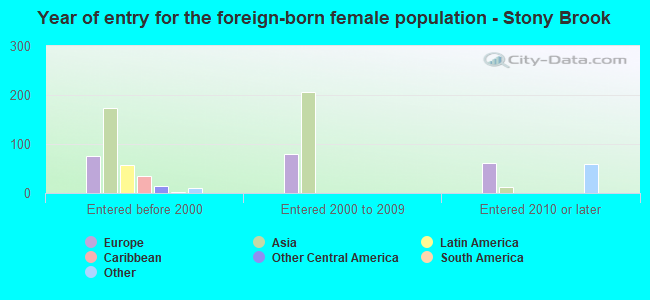
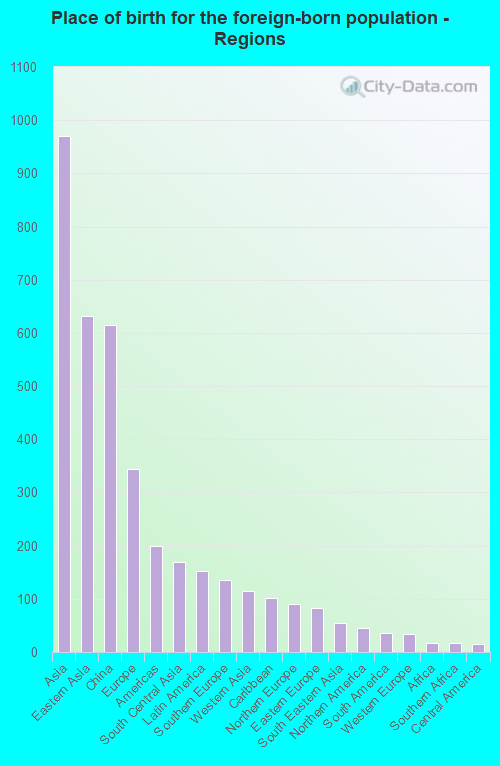
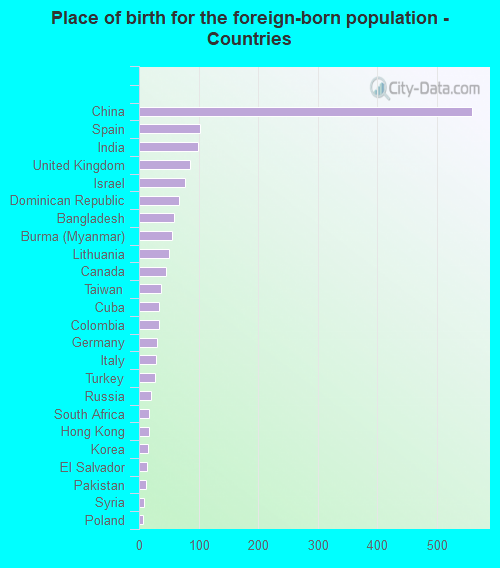
According to 2022 data, the most numerous races in Stony Brook, NY are White alone (9,374 residents), Hispanic (1,069 residents), and Black alone (140 residents). 80.1% of Stony Brook residents speak English at home. 12.3% of Stony Brook, NY residents are foreign-born (7.9% born in Asia, 2.8% born in Europe, 1.2% born in Latin America), which is 79.4% less than the foreign-born rate of 22.0% across the entire state of New York.
Race distribution in Stony Brook
2000 2022
11,760,981 62.0% White alone 2,867,583 15.1% Hispanic 2,812,623 14.8% Black alone 1,035,926 5.5% Asian alone 366,116 1.9% Two or more races 75,499 0.4% Other race alone 52,499 0.3% American Indian alone 5,230 0.03% Native Hawaiian and Other
10,408,933 52.9% White alone 3,867,299 19.7% Hispanic 2,633,840 13.4% Black alone 1,776,286 9.0% Asian alone 732,670 3.7% Two or more races 216,110 1.1% Other race alone 35,082 0.2% American Indian alone 6,931 0.04% Native Hawaiian and Other
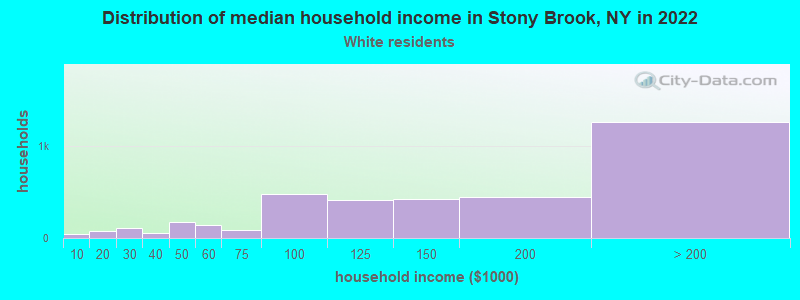
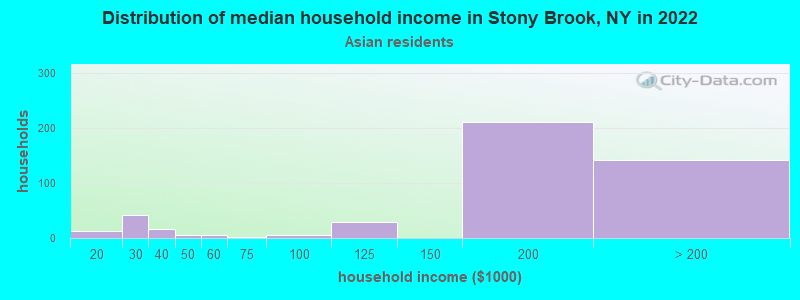
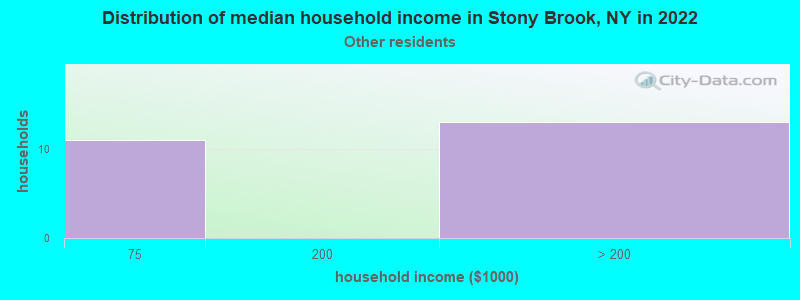
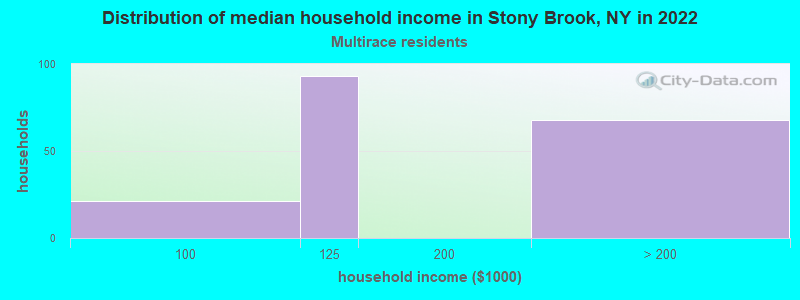
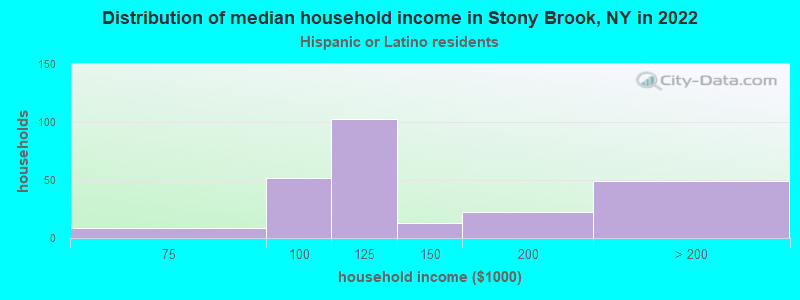
Income and house value in Stony Brook Median household income in 2022 $136,449 White non-Hispanic householders$167,716 Asian householders$112,163 Hispanic or Latino race householdersMedian 2022 house value $640,511 White Non-Hispanic householders$777,667 Black or African American householders $631,349 Asian householders$727,547 Two or more races householders$594,163 Hispanic or Latino householders
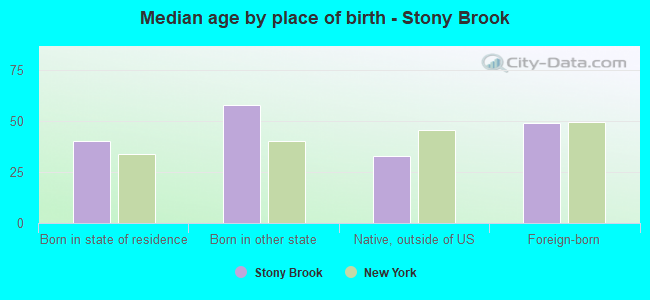
Median age by race in Stony Brook
50.5 Median age for White residents46.9 51.9 21.4 Median age for Black or African American residents-660,784,313.1 21.8 -748,832,865.7 Median age for American Indian / Alaska Native residents-807,017,543.1 -513,692,161.9 43.7 Median age for Asian residents45.1 41.8 -742,816,091.2 Median age for Native Hawaiian / Pacific Islander residents-831,187,409.8 -771,300,447.7 28.4 Median age for Other race residents10.3 60.1 40.6 Median age for Two or more races residents39.5 44.7 49.7 Median age for White alone residents46.3 51.7 34.8 Median age for Hispanic or Latino residents40.1 23.9
Owner/renter occupied households by race in Stony Brook
House owners and renters - White residents 3,387 90.4% Owner occupied358 9.6% Renter occupiedHouse owners and renters - Black or African American residents 12 100.0% Owner occupiedHouse owners and renters - Asian residents 448 93.5% Owner occupied31 6.5% Renter occupiedHouse owners and renters - Other race residents 25 100.0% Owner occupiedHouse owners and renters - Two or more races residents 95 58.8% Owner occupied66 41.2% Renter occupiedHouse owners and renters - White alone residents 3,413 90.8% Owner occupied347 9.2% Renter occupiedHouse owners and renters - Hispanic or Latino residents 146 60.6% Owner occupied95 39.4% Renter occupied
Language usage in Stony Brook
English speakers - Total 80.1% of residents of Stony Brook speak English at home.
4.0% of residents speak Spanish at home 377 78.9% Speak English very well101 21.1% Speak English less than very well15.7% of residents speak other language at home 1,327 71.6% Speak English very well527 28.4% Speak English less than very well
English speakers - Born in the United States 94.1% of residents of Stony Brook speak English at home.
3.7% of residents speak Spanish at home 48 100.0% Speak English very well2.4% of residents speak other language at home 32 100.0% Speak English very well
English speakers - Native, born elsewhere 12.3% of residents of Stony Brook speak English at home.
69.2% of residents speak Spanish at home 45 100.0% Speak English very well15.4% of residents speak other language at home 10 100.0% Speak English very well
English speakers - Foreign-born 20.4% of residents of Stony Brook speak English at home.
12.1% of residents speak Spanish at home 115 56.9% Speak English very well87 43.1% Speak English less than very well64.4% of residents speak other language at home 562 52.5% Speak English very well509 47.5% Speak English less than very well
White (Caucasian) - Speak only English Native:
97.6% (8,363)Foreign-born:
59.7% (184)
White (Caucasian) - Speak another language Native:
3.1% (267)Foreign-born:
49.4% (153)
Black or African American - Speak another language Native:
21.7% (45)Foreign-born:
89.3% (18)
Asian - Speak only English Native:
33.1% (222)Foreign-born:
7.8% (67)
Asian - Speak another language Native:
69.2% (466)Foreign-born:
94.8% (810)
Other race - Speak only English Native:
41.8% (36)Foreign-born:
45.0% (16)
Other race - Speak another language Native:
58.5% (51)Foreign-born:
46.6% (16)
Two or more races - Speak only English Native:
45.9% (137)Foreign-born:
5.7% (16)
Two or more races - Speak another language Native:
53.4% (160)Foreign-born:
95.1% (263)
White alone - Speak only English Native:
96.8% (8,295)Foreign-born:
48.0% (179)
White alone - Speak another language Native:
3.2% (271)Foreign-born:
52.0% (194)
Hispanic or Latino - Speak only English Native:
66.2% (395)Foreign-born:
12.8% (37)
Hispanic or Latino - Speak another language Native:
34.9% (208)Foreign-born:
86.7% (249)
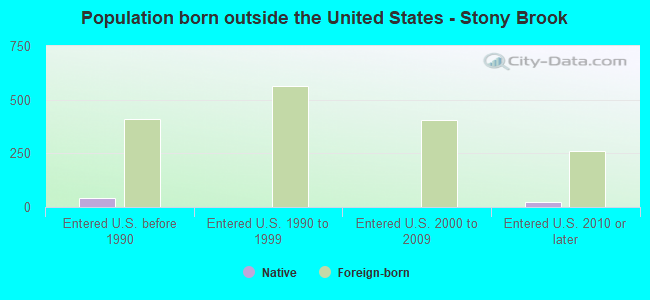
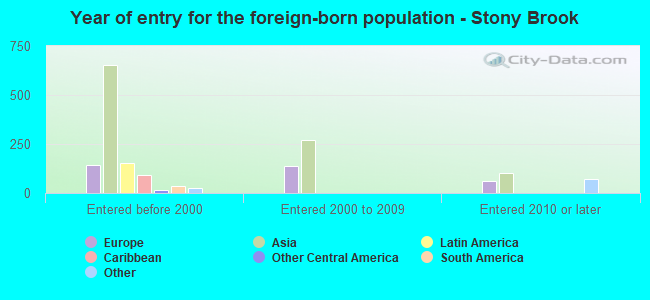
Foreign-born residents in Stony Brook 1,534 residents are foreign born (7.9% Asia , 2.8% Europe , 1.2% Latin America ).
This city:
12.3%New York:
22.6%
Marital status for residents in Stony Brook Marital status - White (Caucasian) population 15 years and over
Males 31.1% Never married59.8% Now married1.0% Separated2.5% Widowed5.6% DivorcedFemales 15.3% Never married61.7% Now married3.3% Separated10.8% Widowed8.9% DivorcedWomen who gave birth in the past 12 months Now married:
85.7% (68)Unmarried:
14.3% (11)
Women who did not give birth in the past 12 months Now married:
58.0% (867)Unmarried:
42.0% (628)
Marital status - Black or African American population 15 years and over
Males 100.0% Never married0.0% Now married0.0% Separated0.0% Widowed0.0% DivorcedFemales 92.1% Never married0.0% Now married0.0% Separated0.0% Widowed7.9% DivorcedWomen who did not give birth in the past 12 months Now married:
0.0% (0)Unmarried:
100.0% (138)
Marital status - Asian population 15 years and over
Males 33.0% Never married64.9% Now married0.0% Separated0.0% Widowed2.1% DivorcedFemales 20.7% Never married77.7% Now married0.0% Separated0.0% Widowed1.6% DivorcedWomen who gave birth in the past 12 months Now married:
100.0% (7)Unmarried:
0.0% (0)
Women who did not give birth in the past 12 months Now married:
68.4% (230)Unmarried:
31.6% (106)
Marital status - Other race population 15 years and over
Males 7.1% Never married53.6% Now married0.0% Separated0.0% Widowed39.3% DivorcedFemales 47.8% Never married39.1% Now married0.0% Separated8.7% Widowed4.3% DivorcedWomen who did not give birth in the past 12 months Now married:
0.0% (0)Unmarried:
100.0% (15)
Marital status - Two or more races population 15 years and over
Males 27.6% Never married72.4% Now married0.0% Separated0.0% Widowed0.0% DivorcedFemales 22.3% Never married77.7% Now married0.0% Separated0.0% Widowed0.0% DivorcedWomen who gave birth in the past 12 months Now married:
100.0% (44)Unmarried:
0.0% (0)
Women who did not give birth in the past 12 months Now married:
46.8% (53)Unmarried:
53.2% (60)
Marital status - White alone, not Hispanic / Latino population 15 years and over
Males 31.2% Never married59.3% Now married1.0% Separated2.7% Widowed5.8% DivorcedFemales 14.2% Never married63.4% Now married3.4% Separated11.2% Widowed7.7% DivorcedWomen who gave birth in the past 12 months Now married:
85.7% (73)Unmarried:
14.3% (12)
Women who did not give birth in the past 12 months Now married:
61.3% (917)Unmarried:
38.7% (578)
Marital status - Hispanic or Latino population 15 years and over
Males 28.8% Never married71.2% Now married0.0% Separated0.0% Widowed0.0% DivorcedFemales 44.2% Never married40.7% Now married0.0% Separated0.2% Widowed14.8% DivorcedWomen who gave birth in the past 12 months Now married:
100.0% (31)Unmarried:
0.0% (0)
Women who did not give birth in the past 12 months Now married:
20.6% (62)Unmarried:
79.4% (238)
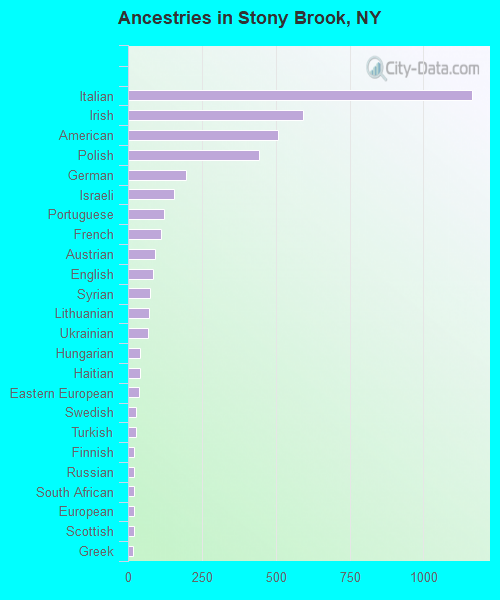
Ancestries in Stony Brook
1,164 19.9% Italian591 10.1% Irish509 8.7% American442 7.6% Polish195 3.3% German157 2.7% Israeli122 2.1% Portuguese112 1.9% French90 1.5% Austrian83 1.4% English73 1.2% Syrian70 1.2% Lithuanian69 1.2% Ukrainian41 0.7% Hungarian39 0.7% Haitian36 0.6% Eastern European27 0.5% Swedish27 0.5% Turkish22 0.4% Finnish22 0.4% Russian21 0.4% South African20 0.3% European20 0.3% Scottish16 0.3% Greek8 0.1% British4 0.07% Dutch3 0.05% Romanian
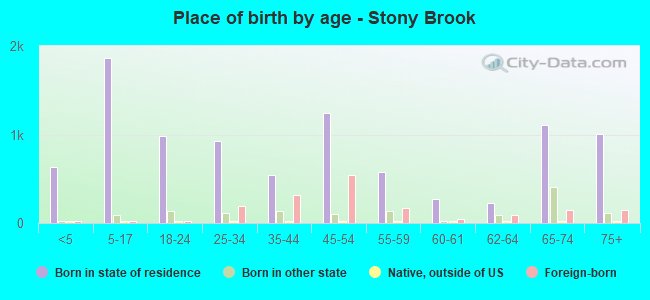
Children Nativity (place of birth) in Stony Brook
Children under 6 years - Living with two parents Both parents native 365 100.0% NativeBoth parents foreign-born 303 100.0% NativeOne native, one foreign-born parent 159 100.0% NativeChildren under 6 years - Living with one parent Native parent 118 100.0% NativeForeign-born parent 11 100.0% NativeChildren 6 to 17 years - Living with two parents Both parents native 1,036 100.0% Native0 0.0% Foreign-bornBoth parents foreign-born 176 90.5% Native19 9.5% Foreign-bornOne native, one foreign-born parent 90 100.0% NativeChildren 6 to 17 years - Living with one parent Native parent 220 100.0% NativeForeign-born parent 43 51.5% Native40 48.5% Foreign-born
Grandparents responsible for own grandchildren in Stony Brook
Grandparents (30 to 59 years) White / Caucasian 9 64.2% Responsible for grandchildren5 35.8% Not responsible for grandchildrenWhite alone, not Hispanic / Latino 9 60.5% Responsible for grandchildren6 39.5% Not responsible for grandchildren
Grandparents (60 years and over) White / Caucasian 4 2.9% Responsible for grandchildren119 97.1% Not responsible for grandchildrenWhite alone, not Hispanic / Latino 4 3.2% Responsible for grandchildren130 96.8% Not responsible for grandchildren